Name
基于RSI指标和ZigZag指标趋势追踪策略Trend-Tracking-Strategy-Based-on-RSI-and-ZigZag-Indicators
Author
ChaoZhang
Strategy Description
本策略名称为“基于RSI指标和ZigZag指标的加密货币15分钟趋势追踪策略”。该策略专门针对15分钟时间周期的加密货币市场(如ETHUSD/T、BTCUSD/T等)设计。策略通过结合RSI指标判断超买超卖与ZigZag指标判断价格跳动来确定趋势方向,属于典型的趋势跟踪策略。
本策略的核心逻辑是同时使用RSI指标和ZigZag指标来判断价格趋势。具体来说,RSI指标判断价格是否超买或超卖,ZigZag指标判断价格是否发生指定百分比的大幅跳动。当两者同时发出交易信号时,我们判断趋势发生转折,可以进行反向操作。
关于RSI指标,我们设置超买线为75,超卖线为25。当RSI指标线从下向上穿过25时,认为行情由超卖转为看涨,当RSI指标线从上向下穿过75时,认为行情由看涨转为超卖。
关于ZigZag指标,我们设置价格跳动幅度阈值为1%。当价格出现1%以上的大幅跳动时,ZigZag指标线会发出信号。结合趋势判断,我们可以看出价格趋势的转折点。
在双指标发出信号时,如果之前趋势方向为看涨,现在RSI超买而ZigZag显示跳空缺口,那么我们判定行情见顶,此时可以考虑做空;反之,如果之前趋势方向为看跌,现在RSI超卖而ZigZag显示跳空缺口,那么我们判定行情见底,此时可以考虑做多。通过这样的逻辑,我们可以进行趋势跟踪操作。
本策略最大的优势在于结合双指标判断,可以有效过滤假信号,提高信号质量。仅仅依靠单一指标很容易产生假信号,而本策略通过RSI指标和ZigZag指标的验证,可以过滤掉一些无效信号,从而提高交易胜率。
另一个优势是参数设置灵活。本策略中的RSI参数和ZigZag参数都是可以自定义的,我们可以根据不同市场的特点,调整参数以达到最佳效果。这赋予了策略很大的灵活性。
本策略的主要风险在于指标发出错误信号的概率。尽管我们采用了双指标组合验证,但在市场剧烈波动的时候,仍然可能出现指标失效的情况,导致交易失误。此外,参数设置不当也会影响策略效果。
为降低风险,我们可以适当缩短仓位持有时间,及时止损。同时优化参数设置非常重要,需要充分考虑市场特点。当面临异常市场时,手动干预停止交易也是必要的。
本策略可以从以下几个方面进行优化:
-
增加指标组合,引入更多指标进行综合判断,如KDJ、MACD等,可以进一步过滤信号。
-
引入机器学习算法,通过AI技术自动优化参数设置,适应市场变化。
-
增加自适应止损机制,能够根据市场波动幅度来动态调整止损距离。
-
优化仓位管理,比如根据趋势强弱分配资金等方法。
-
设定备选策略,在异常市场中自动切换。
本策略整体来说是一种典型的趋势跟踪策略,核心思路是结合RSI指标和ZigZag指标来判断价格趋势转折点。策略优势在于双指标组合过滤误导信号,提高交易效率。需要充分考虑到指标失效风险,并不断通过参数优化、止损优化、仓位优化等手段进一步完善策略。总的来说,本策略为加密货币市场提供了一种有效的趋势跟踪解决方案。
||
The strategy is named "Crypto 15-minute Trend Tracking Strategy Based on RSI and ZigZag Indicators". It is specifically designed for 15-minute crypto markets like ETHUSD/T and BTCUSD/T. The strategy determines trend direction by combining RSI indicator to judge overbought/oversold levels and ZigZag indicator to detect price spikes. It belongs to a typical trend following strategy.
The core logic of this strategy is to use both RSI and ZigZag indicators to determine price trend. Specifically, the RSI indicator judges whether price is overbought or oversold. The ZigZag indicator detects whether price has a significant percentage spike. When both indicators give trading signals simultaneously, we determine that there is a trend reversal for a counter position.
For the RSI indicator, we set the overbought line at 75 and the oversold line at 25. When RSI rises from below 25 to above 25, it is considered a reversal from oversold to bullish. When RSI falls from above 75 to below 75, it indicates a reversal from bullish to oversold.
For the ZigZag indicator, we set the price spike threshold to 1% in percentage change. When price makes a spike over 1% in amplitude, the ZigZag line will give a signal. Combined with trend judgment, we can identify trend reversals.
When both indicators give signals, if the previous trend is bullish and now RSI overbought while ZigZag shows price spike, we determine that price is topping and may consider shorting. On the contrary, if previous trend is bearish and now RSI oversold while ZigZag shows price spike, we determine that price is bottoming and may consider longing. Through this logic, we can follow the trend.
The biggest advantage of this strategy is improved signal quality through combining two indicators. A single indicator tends to give many false signals. But this strategy uses RSI and ZigZag for verification, filtering out many bogus signals and improving win rate.
Another strength is flexible parameter tuning. The RSI and ZigZag parameters are customizable according to different market conditions for best results. This brings great adaptiveness to the strategy.
The main risk is incorrect signals from the indicators. Despite the dual indicator validation, there can still be failures during high volatility leading to trading mistakes. Inappropriate parameter setting also impacts strategy performance.
To reduce risks, we may shorten position holding period for timely stop loss. Parameter optimization is also very important catering to market characteristics. Manual intervention may be necessary when facing abnormal market conditions.
The strategy can be improved from the following aspects:
-
Add more indicators like KDJ and MACD for combined judgment to further filter signals.
-
Introduce machine learning algorithms for automatic parameter optimization adapting to market changes.
-
Build an adaptive stop loss mechanism with dynamic protection based on market volatility.
-
Optimize position sizing based on trend strengths.
-
Set up alternative strategies to switch automatically in uncommon markets.
In summary, this is a typical trend following strategy. The core idea is to identify trend reversals using RSI and ZigZag indicators in combination. The advantage lies in improved signal quality through dual indicator filtration. Risks of indicator failure need to be fully considered, and the strategy continuously improved through parameter tuning, stop loss optimization, position sizing and so on. Overall this provides an effective trend tracking solution for the crypto market.
[/trans]
Strategy Arguments
| Argument | Default | Description |
|---|---|---|
| v_input_1 | 5 | RSI Length |
| v_input_2 | 25 | overSold |
| v_input_3 | 75 | overBought |
| v_input_4 | true | Minimum % Change |
| v_input_5 | true | longa |
| v_input_6 | false | shorta |
Source (PineScript)
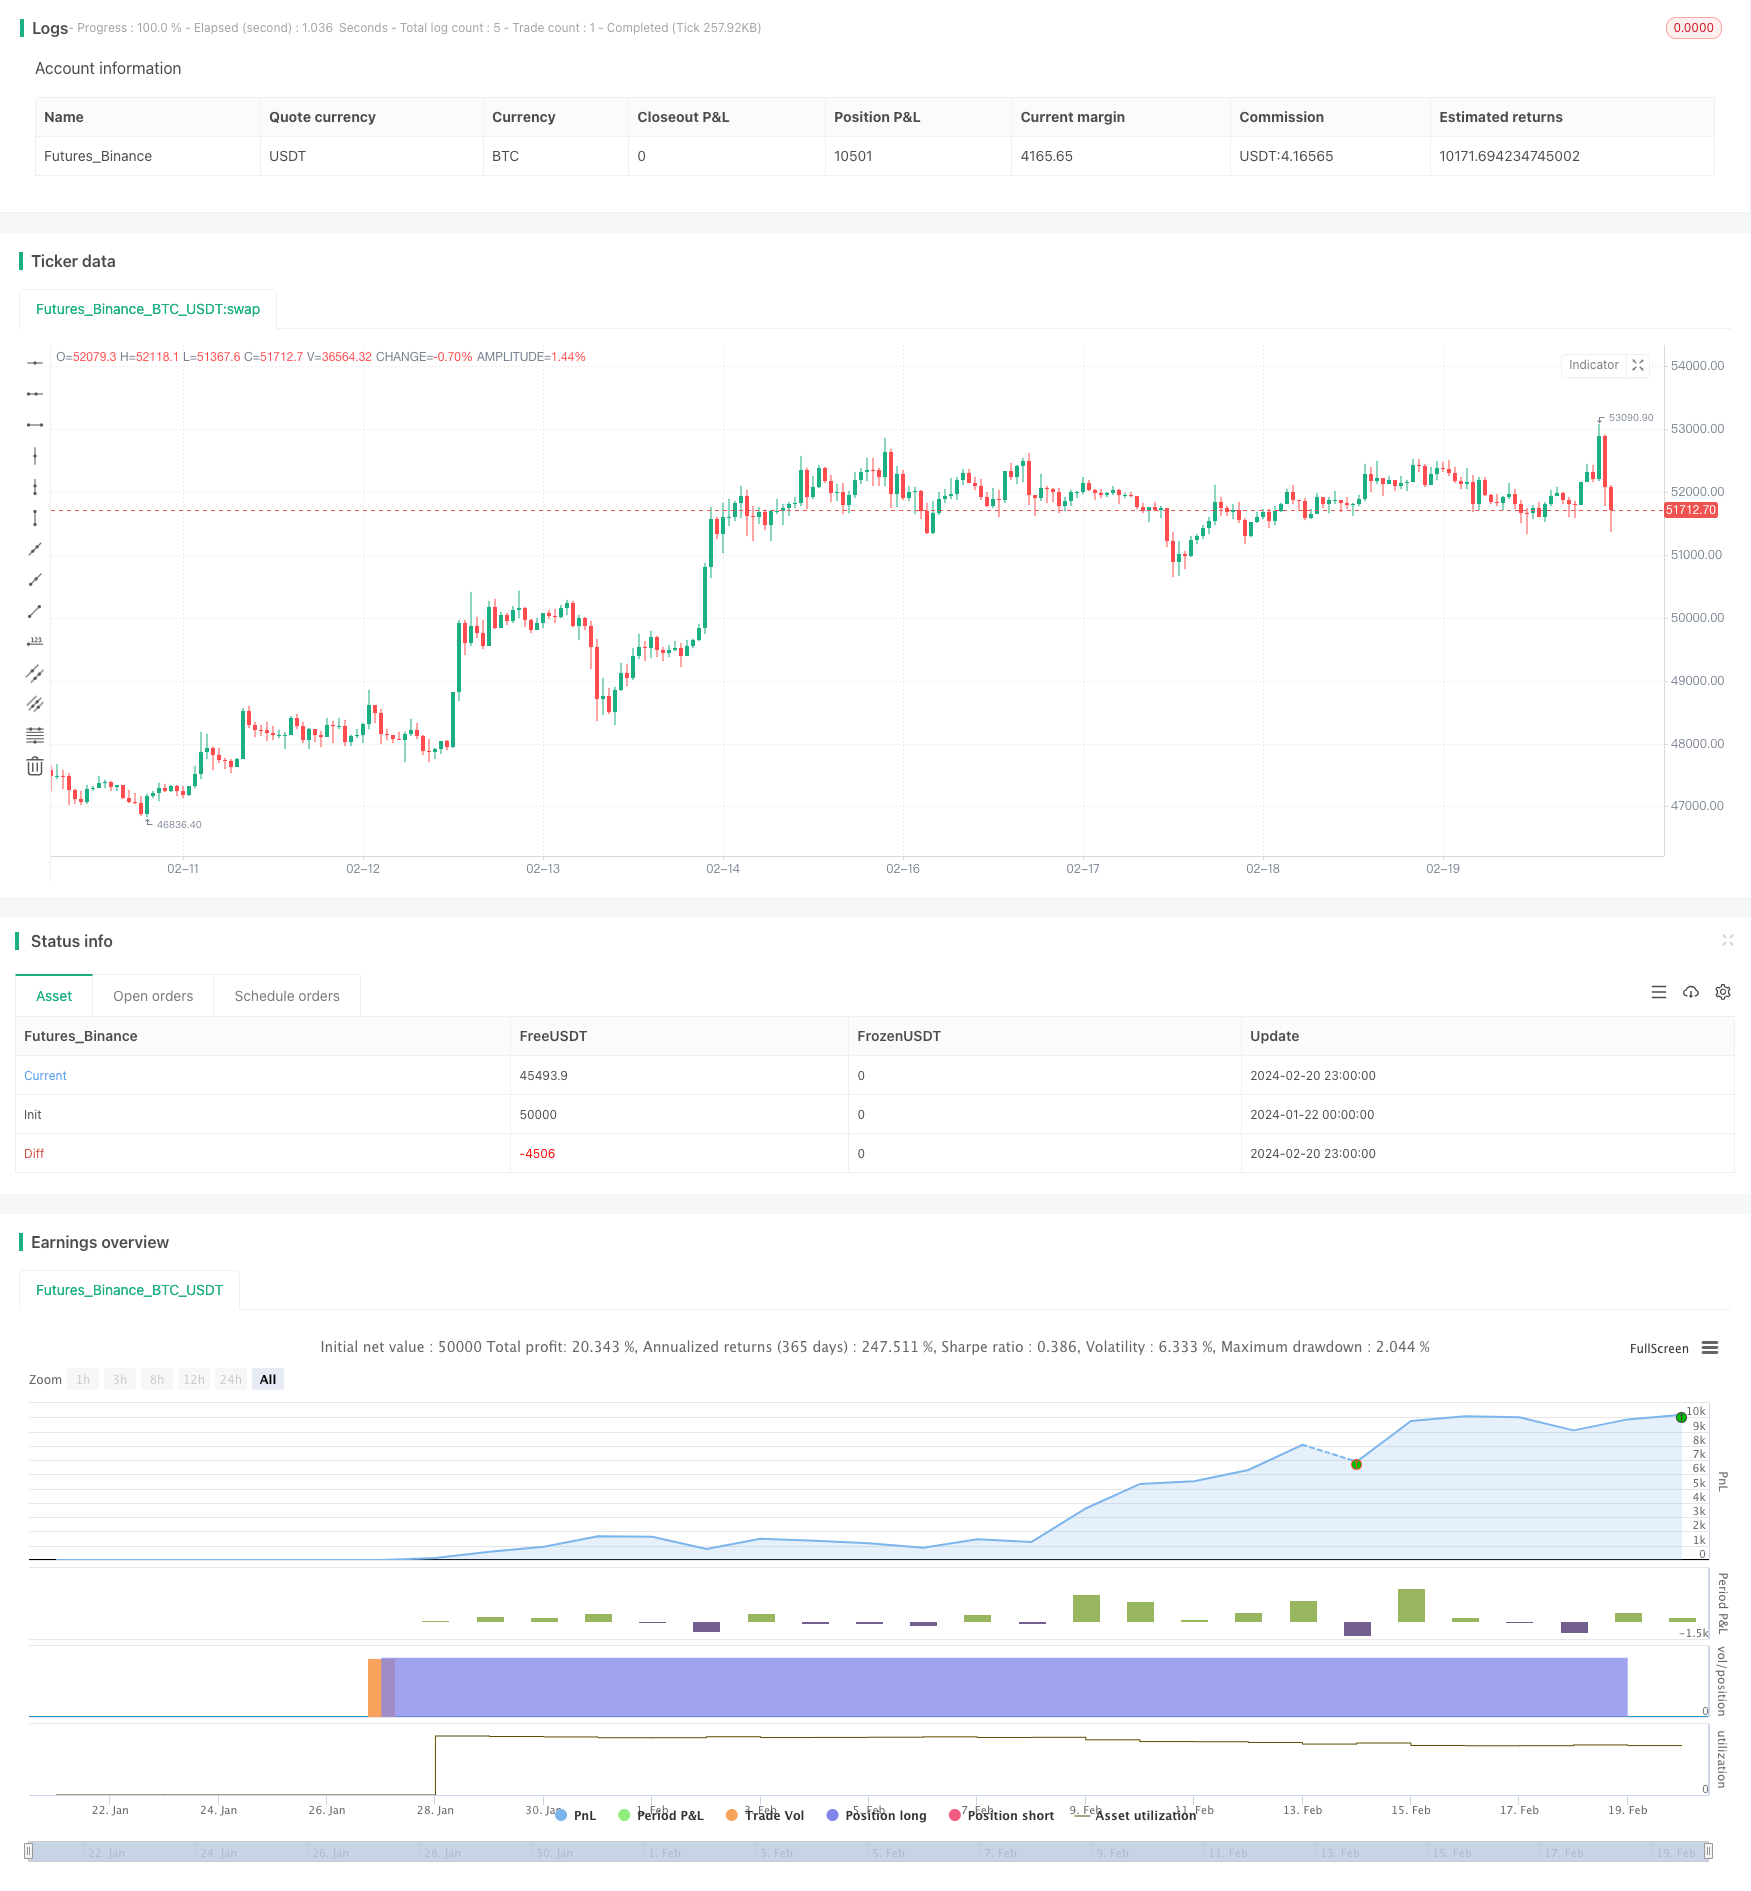
/*backtest
start: 2024-01-22 00:00:00
end: 2024-02-21 00:00:00
period: 1h
basePeriod: 15m
exchanges: [{"eid":"Futures_Binance","currency":"BTC_USDT"}]
*/

// This source code is subject to the terms of the Mozilla Public License 2.0 at https://mozilla.org/MPL/2.0/
// © SoftKill21
//@version=4
strategy("Crypto ZigZag RSI strategy 15min",overlay=true)
length =input(5, title="RSI Length")
overSold = input(25)
overBought= input(75)

p =close

vrsi = rsi(p, length)
var bool long = na
var bool short = na

long :=crossover(vrsi,overSold)
short := crossunder(vrsi,overBought)

var float last_open_long = na
var float last_open_short = na

last_open_long := long ? close : nz(last_open_long[1])
last_open_short := short ? close : nz(last_open_short[1])


entry_value =last_open_long
entry_value1=last_open_short

//
ZZPercent = input(1, title="Minimum % Change", type=input.float)
r1Level=entry_value
s1Level=entry_value1
trend = 0
trend := na(trend[1]) ? 1 : trend[1]
LL = 0.0
LL := na(LL[1]) ? s1Level : LL[1]
HH = 0.0
HH := na(HH[1]) ?r1Level : HH[1]

Pi = ZZPercent * 0.01
zigzag = float(na)

if trend > 0
    if r1Level >= HH
        HH := r1Level
        HH
    else
        if s1Level < HH * (1 - Pi)
            zigzag :=r1Level[1]
            trend := -1
            LL := s1Level
            LL
else

    if s1Level <= LL
        LL := s1Level
        LL
    else
        if r1Level > LL * (1 + Pi)
            zigzag := s1Level[1]
            trend := 1
            HH := s1Level
            HH


shortc=crossunder(trend,0)
longc=crossover(trend,0)


longa =input(true)
shorta=input(false)

if(longa)
    strategy.entry("long",1,when=longc)
    strategy.close("long",when=shortc)
if(shorta)
    strategy.entry("short",0,when=shortc)
    strategy.close("long",when=longc)
Detail
https://www.fmz.com/strategy/442536
Last Modified
2024-02-22 16:15:18