Name
基于RSI指标的短线交易策略RSI-5-Momentum-Trading-Strategy
Author
ChaoZhang
Strategy Description
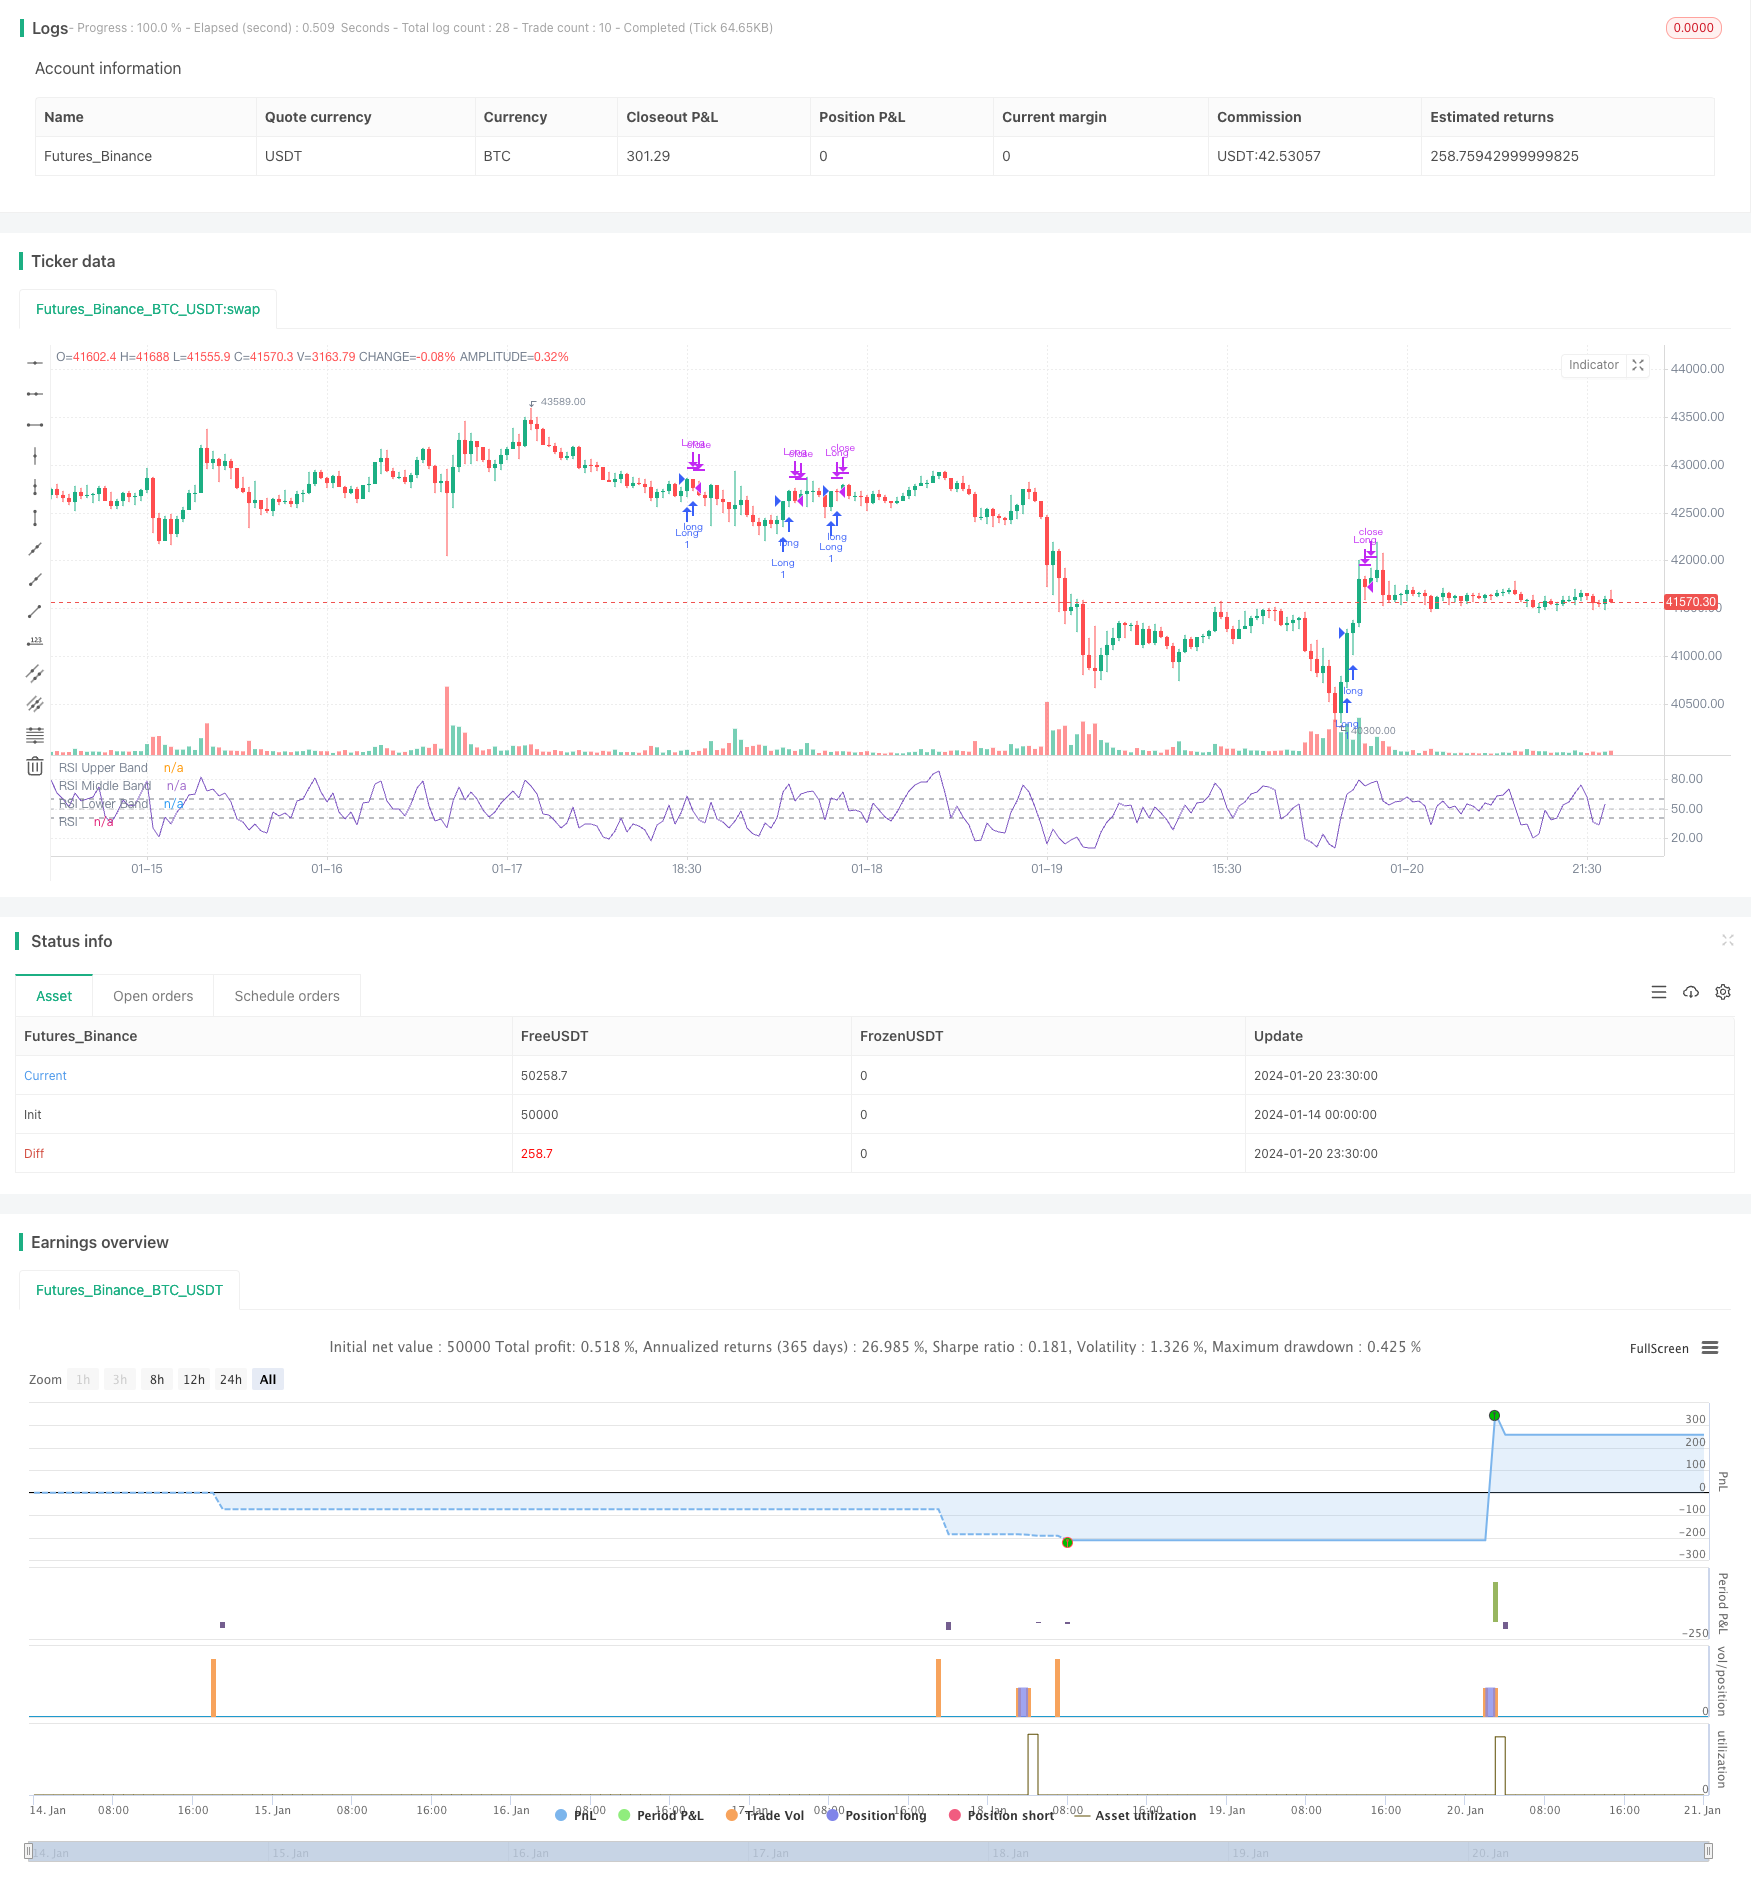
该策略是一种基于RSI(相对强弱指标)的短线交易策略。它利用RSI指标识别市场的潜在强弱状态,从而辅助交易决策。
该策略使用5周期的RSI指标来捕捉短线价格动量。它根据RSI曲线的高点和低点来判断入场和止损的时机。
进入多头头寸的条件是:前一根K线的RSI值低于50;当前K线的RSI值高于60。
平仓条件是:当RSI曲线出现更低的低点时,表示趋势转弱,此时平掉多头头寸。
- 使用RSI指标可以有效识别市场中价格的反转点。RSI高低点的组合拐点具有很强的指示作用。
- 5周期RSI能够捕捉到短线价格的快速变动,适合短线交易。
- 策略决策规则清晰简单,容易实施。
- RSI指标容易产生错误信号,导致止损。
- 短线操作容易增加交易频率和滑点成本。
- 实际交易中需要合理调整参数,如RSI周期数,高低点阈值等。
优化方法:
- 结合其他指标过滤信号,降低误差率。比如MACD,KD等。
- 适当放宽止损线,避免过于敏感。
- 调整RSI参数,寻找最优参数组合。
该策略利用RSI指标的高低点反转特征,设定了明确的多头进入和止损规则。简单实用的交易思路,但也存在一定的不稳定性。可以通过参数优化和指标组合来提高策略稳定性。
||
This is a short-term trading strategy based on the RSI (Relative Strength Index) indicator. It utilizes RSI to identify potential strength and weakness in the market, thus assisting trading decisions.
The strategy uses a 5-period RSI to capture short-term price momentum. It determines entry and stop loss levels based on peaks and troughs of the RSI curve.
Long entry conditions: previous candle's RSI below 50; current candle's RSI above 60.
Exit conditions: when the RSI curve makes lower lows, indicating weakening trend, close long positions.
- RSI effectively identifies reversal points in prices, as RSI peaks and troughs combinations have strong signaling effects.
- The 5-period RSI captures fast price fluctuations for short-term trading.
- The strategy rules are clear and simple to implement.
- RSI may generate false signals, causing unnecessary stop loss.
- High trading frequency from short-term trading can incur larger slippage costs.
- Parameters like RSI periods, threshold levels require fine tuning for actual trading.
Optimization:
- Adding filter indicators like MACD and KD to reduce errors.
- Relaxing stop loss levels to avoid oversensitivity.
- Adjusting RSI parameters to find optimal parameter combinations.
The strategy utilizes the reversal pattern of RSI peaks and troughs to set clear long entry and stop loss rules. The logic is simple and practical but has some instability. Strategy stability can be improved through parameter optimization and indicator combinations.
[/trans]
Strategy Arguments
| Argument | Default | Description |
|---|---|---|
| v_input_1 | 5 | RSI Length |
Source (PineScript)
/*backtest
start: 2024-01-14 00:00:00
end: 2024-01-21 00:00:00
period: 30m
basePeriod: 15m
exchanges: [{"eid":"Futures_Binance","currency":"BTC_USDT"}]
*/

//@version=5
strategy("*RSI 5 - Long only- Daily charts & above*", overlay = false)

// Define inputs
rsi_length = input(5, "RSI Length")

// Calculate indicators
rsi = ta.rsi(close, rsi_length)

// Entry conditions
long = rsi[1] < 50 and rsi > 60

// Exit conditions
longExit = rsi < rsi[1]


// Execute trade with adjusted position size
if (long)
    strategy.entry("Long", strategy.long)


if  (longExit)
	strategy.close("LongExit")


// Close long position if long exit condition is met
if (longExit)
    strategy.close("Long", comment="Long exit")

rsiPlot = plot(rsi, "RSI", color=#7E57C2)
rsiUpperBand = hline(60, "RSI Upper Band", color=#787B86)
midline = hline(50, "RSI Middle Band", color=color.new(#787B86, 50))
rsiLowerBand = hline(40, "RSI Lower Band", color=#787B86)
fill(rsiUpperBand, rsiLowerBand, color=color.rgb(126, 87, 194, 90), title="RSI Background Fill")
Detail
https://www.fmz.com/strategy/439598
Last Modified
2024-01-22 09:59:42