Name
基于RSI指标的Nifty交易策略Nifty-Trading-Strategy-Based-on-RSI-Indicator
Author
ChaoZhang
Strategy Description
本策略基于相对强弱指数(RSI)指标,设计了一个用于Nifty指数交易的量化投资策略。该策略利用RSI指标识别超买超卖机会,实现低买高卖,追求超额收益。
该策略设置2期RSI作为交易信号。当RSI上穿20时,做多;当RSI下穿70时,平仓。这样可以捕捉指数的短期调整机会。
具体原理是:当RSI低于20时,属于超卖状态,表示资产被低估,预示着即将反弹;当RSI上穿20时,做多;当RSI高于70时,属于超买状态,表示资产被高估,预示着即将回调;当RSI下穿70时,平仓。
这是一个利用指标识别短期超买超卖机会的量化策略。相比复杂的机器学习和统计套利策略,该策略优势主要体现在:
- 原理简单清晰,容易理解和验证
- 指标参数少,容易优化和调整
- 追求短期超额收益,符合穿越交易理念
- 可自定义交易时间段,适应不同期望
该策略主要存在以下风险:
- 无法应对长期趋势,容易错失大行情
- 过于依赖参数优化,可能存在过拟合风险
- 无止损机制,无法有效控制亏损
- 交易频繁,影响持仓时间,产生更多交易费用
为控制上述风险,可以从以下几个方面进行优化:
- 结合趋势等指标,识别长期行情
- 采用Walk Forward Analysis方法防止过拟合
- 设置止损点,及时止损
- 适当调整交易参数,控制交易频率
该策略主要可从以下几个方面进行优化:
- 优化RSI参数,寻找最优参数组合
- 增加止损机制,控制最大回撤
- 结合移动均线等指标,判断长期趋势
- 增加仓位管理模块,优化仓位分配
- 增加量化copyright功能,自动调整参数
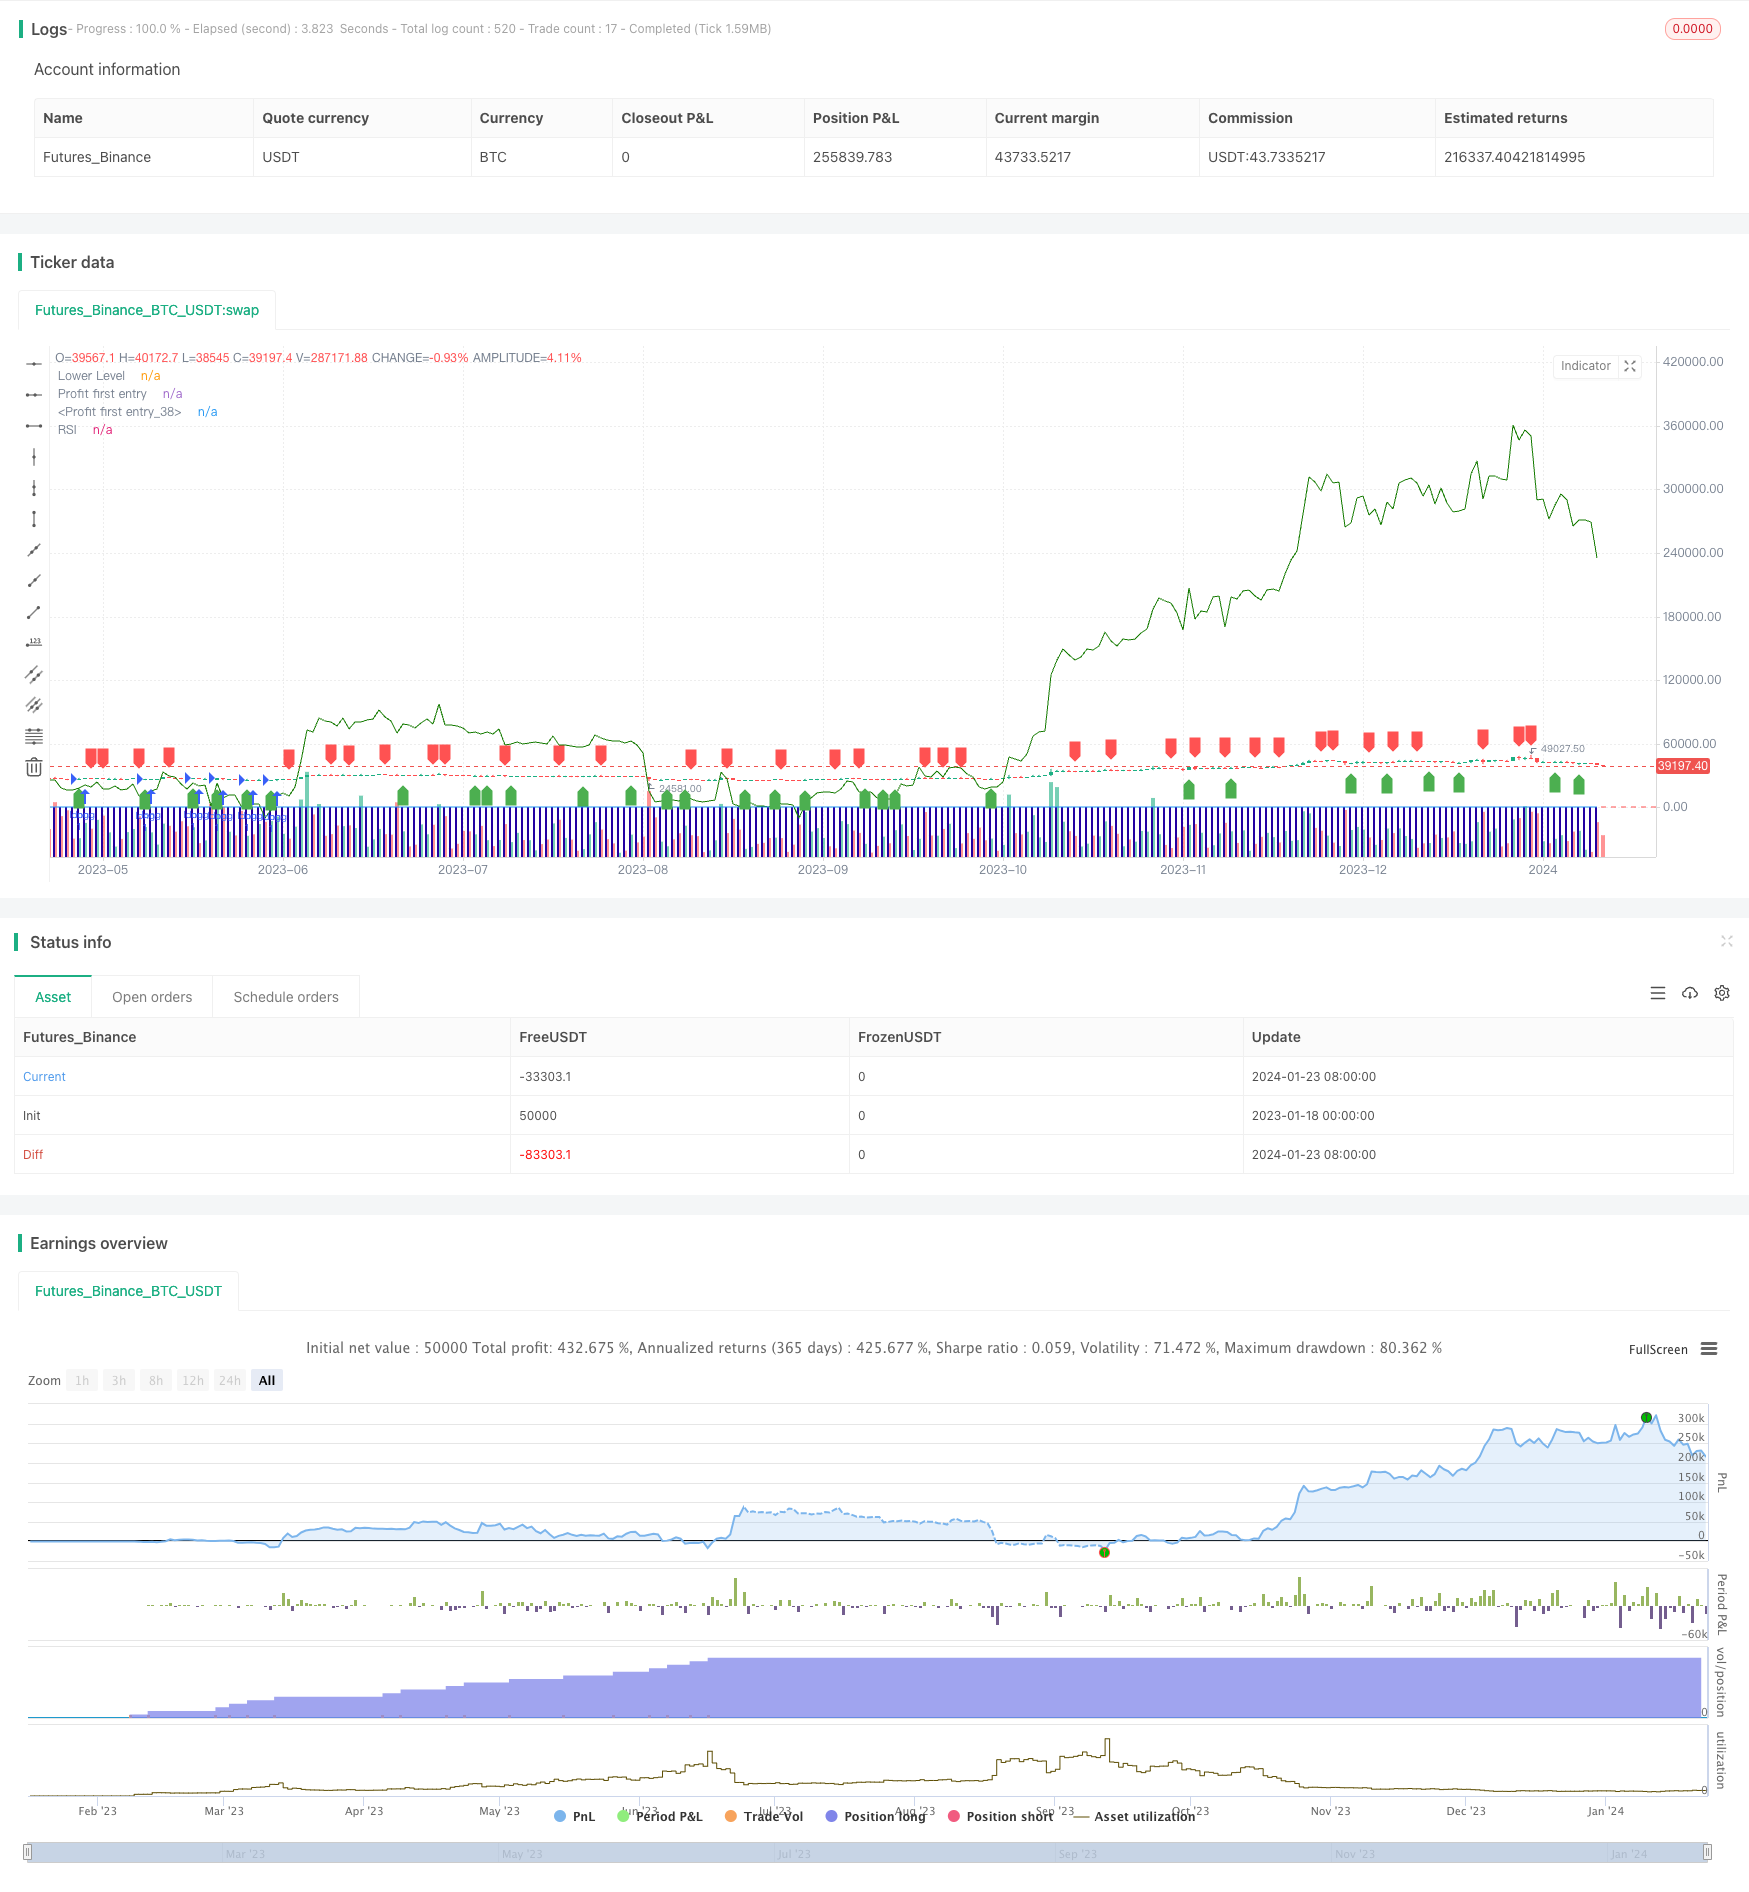
本策略基于RSI指标设计了一个短期交易策略,利用RSI指标的超买超卖信号实现低买高卖,追求超额收益。该策略原理简单,易于实现,但存在一定程度交易频繁,无法识别长期趋势等问题。未来可从优化RSI参数、增加止损机制、结合趋势判断等方面进行改进,使策略更稳定可靠。
||
This strategy designs a quantitative investment strategy for trading Nifty index based on the Relative Strength Index (RSI) indicator. It identifies overbought and oversold opportunities using RSI to implement low buying and high selling for excess returns.
The strategy sets 2-period RSI as trading signals. It goes long when RSI crosses above 20, and closes position when RSI crosses below 70. This captures the short-term adjustment opportunities of the index.
The logic is: when RSI is below 20, it indicates oversold status, implying the asset is underestimated and rebound is ahead. When RSI crosses above 20, go long. When RSI is above 70, it indicates overbought status, implying the asset is overvalued and callback is ahead. When RSI crosses below 70, close position.
As a strategy identifying short-term overbought/oversold opportunities with indicators, the main advantages are:
- The principle is simple and clear, easy to understand and validate
- Few indicator parameters, easy to optimize and adjust
- Pursuing short-term excess returns, aligns with scalping trading philosophy
- Customizable trading time period, adapts to different expectations
The main risks of this strategy includes:
- Incapable to capture long-term trends, likely to miss big moves
- Overly relying on parameter optimization, overfitting risk
- No stop loss mechanism to effectively control losses
- Frequent trading affects holding period, incurring more transaction costs
To control aforementioned risks, optimizations can be made in below aspects:
- Incorporate trend indicators to identify long-term moves
- Adopt Walk Forward Analysis to prevent overfitting
- Set stop loss points for timely stop loss
- Adjust trading parameters appropriately to control trade frequency
Main aspects for optimizing the strategy:
- Optimize RSI parameters to find optimum parameter combinations
- Add stop loss mechanism to limit maximum drawdown
- Incorporate moving averages etc. to judge long-term trend
- Add position sizing module to optimize position allocation
- Add quantitative copyright to automatically adjust parameters
This strategy designs a short-term trading strategy based on RSI indicator, capturing overbought/oversold signals for low buying and high selling. The strategy has simple principle and is easy to implement, but has certain degree of frequent trading, inability to identify long-term trends etc. Future improvements can be made on optimizing RSI parameters, adding stop loss, combining trend judgment etc., to make the strategy more stable and reliable.
[/trans]
Strategy Arguments
| Argument | Default | Description |
|---|---|---|
| v_input_1 | timestamp(01 Nov 2009 00:00 +0000) | (?Time Settings)stary Time |
| v_input_2 | timestamp(01 Nov 2023 00:00 +0000) | End Time |
| v_input_3 | timestamp(01 Dec 2018 00:00 +0000) | Start Time |
| v_input_4 | timestamp(30 Nov 2023 00:00 +0000) | End Time |
Source (PineScript)
/*backtest
start: 2023-01-18 00:00:00
end: 2024-01-24 00:00:00
period: 1d
basePeriod: 1h
exchanges: [{"eid":"Futures_Binance","currency":"BTC_USDT"}]
*/

//@version=4
strategy("RSI Strategy", overlay=true,pyramiding = 1000)
rsi_period = 2
rsi_lower = 20
rsi_upper = 70

rsi_value = rsi(close, rsi_period)
buy_signal = crossover(rsi_value, rsi_lower)
sell_signal = crossunder(rsi_value, rsi_upper)
current_date1 =  input(defval=timestamp("01 Nov 2009 00:00 +0000"), title="stary Time", group="Time Settings")

current_date =  input(defval=timestamp("01 Nov 2023 00:00 +0000"), title="End Time", group="Time Settings")
investment_amount = 100000.0
start_time = input(defval=timestamp("01 Dec 2018 00:00 +0000"), title="Start Time", group="Time Settings")
end_time = input(defval=timestamp("30 Nov 2023 00:00 +0000"), title="End Time", group="Time Settings")

in_time = time >= start_time and time <= end_time
// Variable to track accumulation.
var accumulation = 0.0
out_time = time >= end_time

if (buy_signal )
    strategy.entry("long",strategy.long,qty= 1)
    accumulation += 1
if (out_time)
    strategy.close(id="long")

plotshape(series=buy_signal, title="Buy Signal", location=location.belowbar, color=color.green, style=shape.labelup)
plotshape(series=sell_signal, title="Sell Signal", location=location.abovebar, color=color.red, style=shape.labeldown)

plot(rsi_value, title="RSI", color=color.blue)
hline(rsi_lower, title="Lower Level", color=color.red)


plot(strategy.opentrades, style=plot.style_columns,
     color=#2300a1, title="Profit first entry")
plot(strategy.openprofit, style=plot.style_line,
     color=#147a00, title="Profit first entry")
// plot(strategy.position_avg_price, style=plot.style_columns,
//      color=#ca0303, title="Profit first entry")
// log.info(strategy.position_size * strategy.position_avg_price)
Detail
https://www.fmz.com/strategy/439958
Last Modified
2024-01-25 12:23:39