Name
基于RSI的多头趋势追踪策略RSI-Trend-Tracking-Long-Only-Strategy
Author
ChaoZhang
Strategy Description
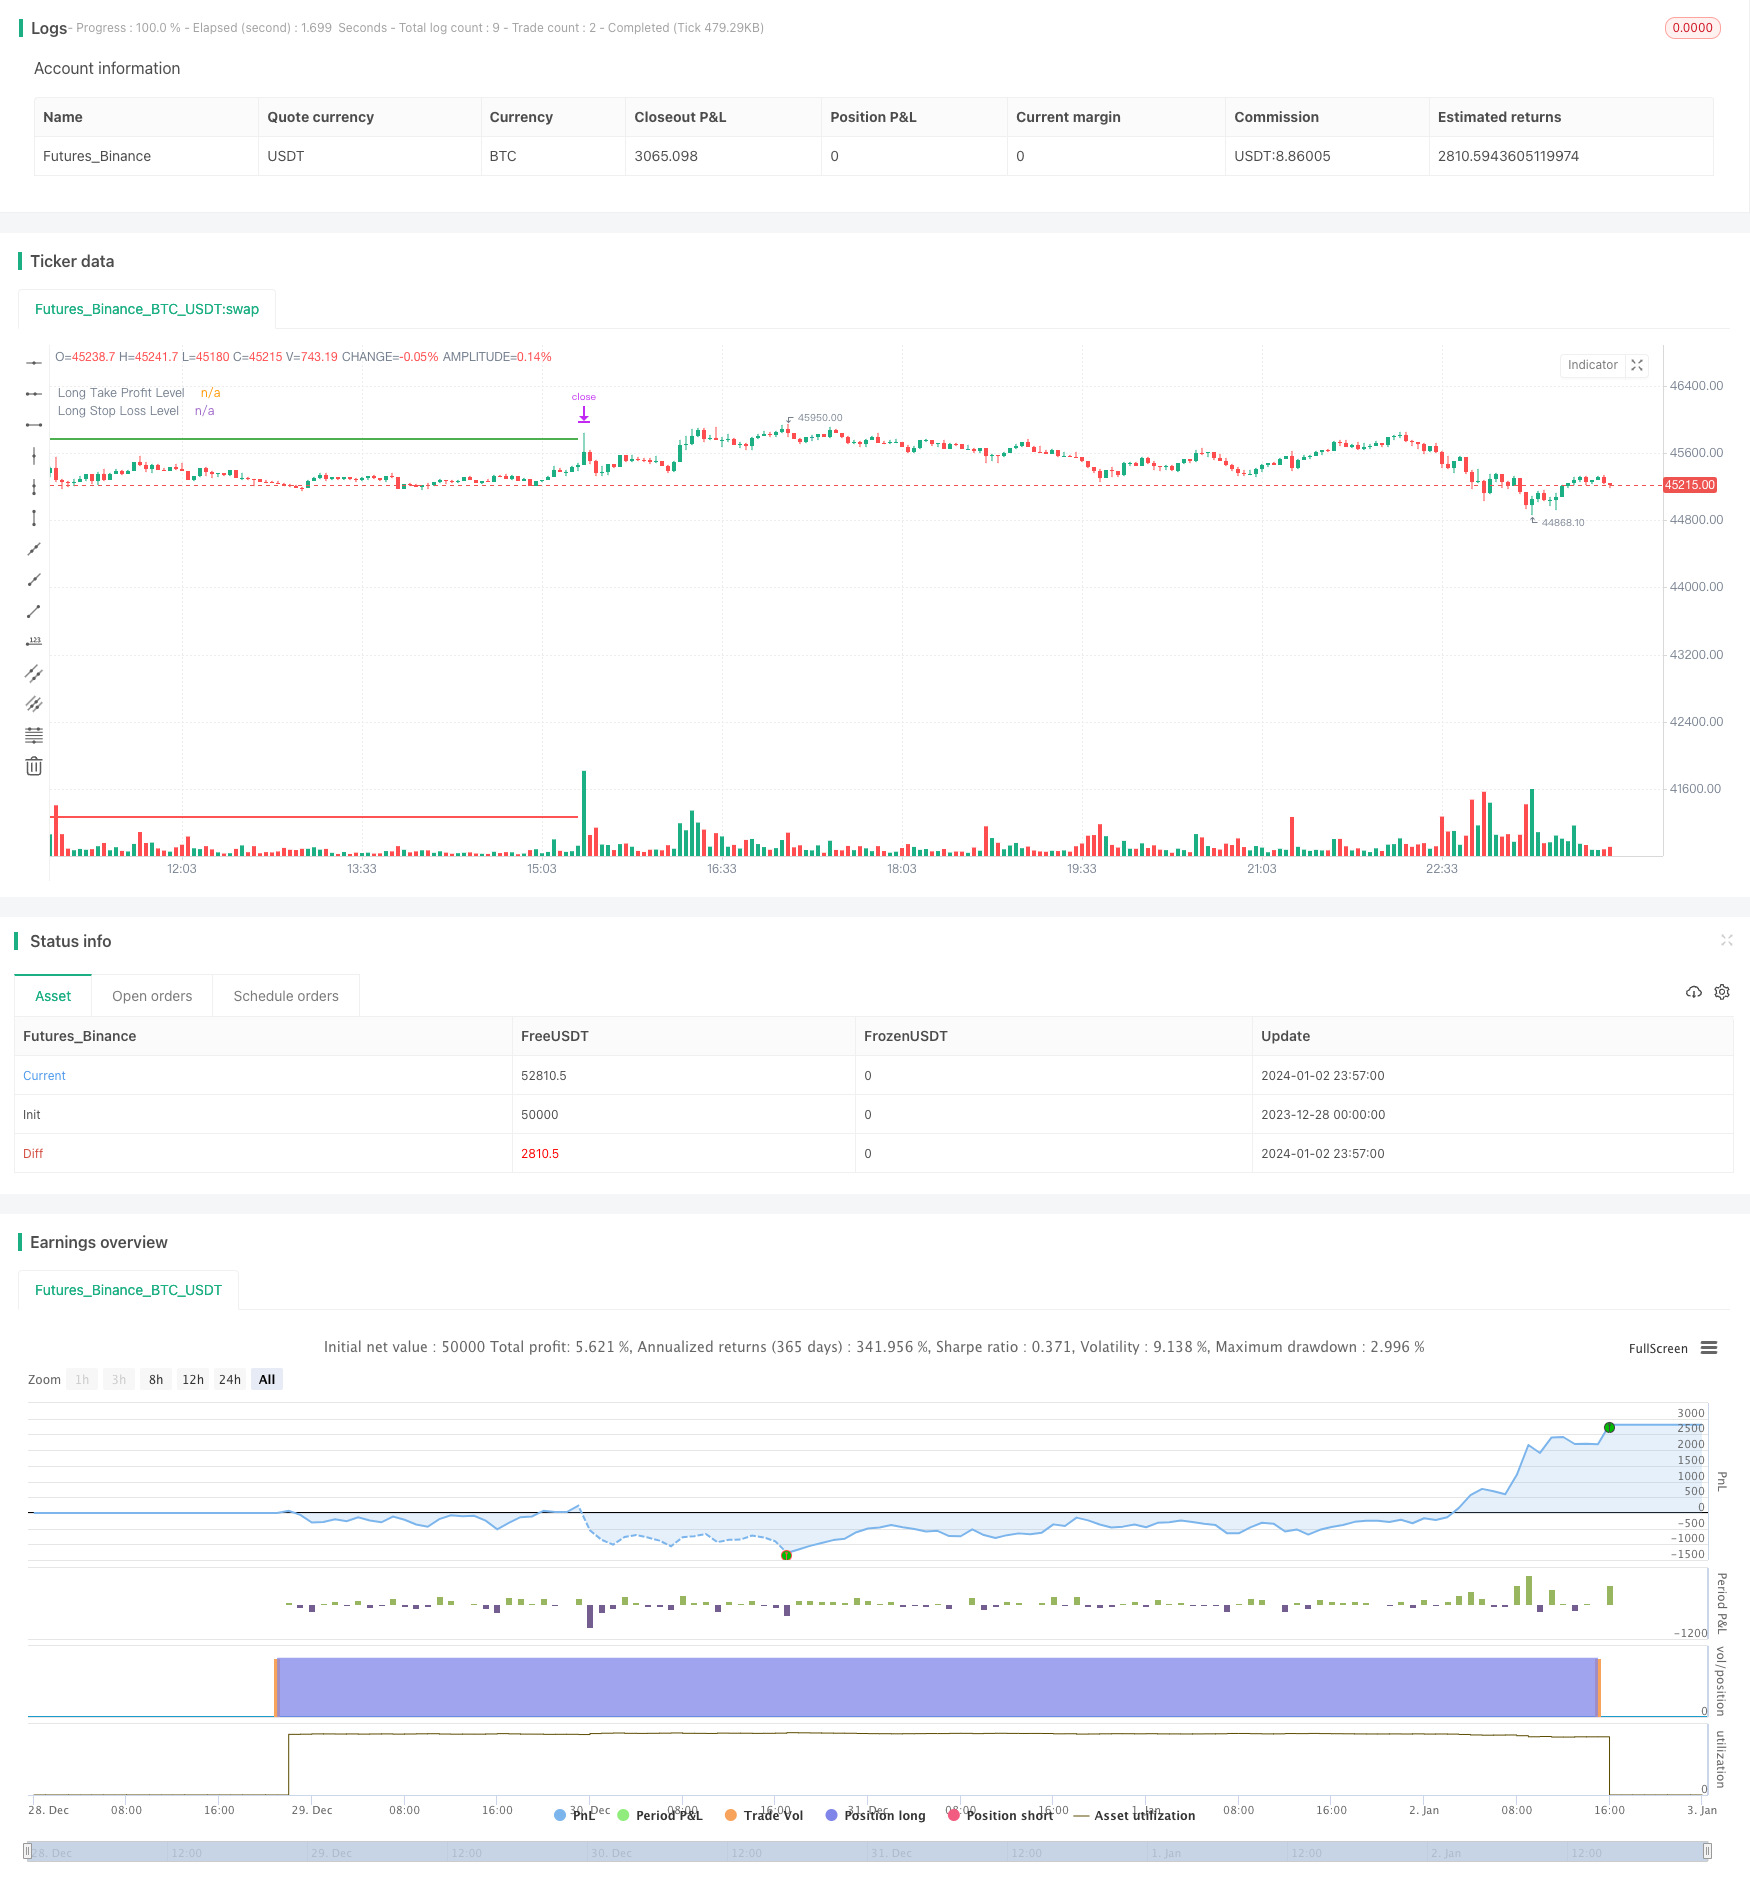
该策略基于RSI指标实现了一个只做多不做空的趋势追踪策略。当RSI指标达到超买水平时会进入做多方向,采用固定比例的止盈止损。策略简单直接,适用于多头行情。
该策略使用RSI指标判断入场时机。当RSI指标低于超卖水平25时,会进入做多方向。此后会根据入场价格设置固定比例的止盈和止损水平。具体来说,止盈水平为入场价格的7%以上,止损水平为入场价格的3.5%以下。
该策略只做多不做空,属于趋势追踪策略。它试图捕捉价格从超卖走出的上涨趋势。当RSI超卖时,代表价格可能处于短期的超跌状态,这时做多可以捕捉反弹。
该策略具有以下优势:
-
思路清晰,逻辑简单,容易理解和实现。
-
多空逻辑分明,只做多不做空,避免Regularity FD003风险。
-
做多信号来自RSI指标,可以有效判断超卖反弹机会。
-
采用固定止盈止损比例,可以控制单笔损失。
该策略也存在一些风险:
-
多头行情适用性较好,空头行情无法盈利。
-
没有考虑突破新高点入场的机会,可能错过部分行情。
-
固定比例止损无法根据市场波动度进行调整。
-
RSI参数设置不当可能导致交易频繁或信号不足。
该策略可以从以下几个方面进行优化:
-
增加空头策略,可以在空头行情中盈利。
-
考虑加入新的入场条件,如突破新高或形态信号,提高准确率。
-
RSI参数可以训练获得最优参数,降低误差率。
-
止损机制可以更加智能化,结合ATR指标根据市场波动度调整。
本策略整体思路清晰,使用RSI指标判断超卖机会,并追踪多头趋势。优点是简单可靠,思路直接,缺点是只适用于多头行情,优化空间较大。该策略可以作为多头追踪策略的雏形,后续可以引入更多条件和技术指标进行优化,使之成为一个可靠的正向波动跟踪系统。
||
This strategy implements a long only trend tracking strategy based on the RSI indicator. It goes long when RSI reaches oversold level and adopts fixed take profit and stop loss ratios. The strategy is simple and straightforward, suitable for bull market.
The strategy uses RSI indicator to determine entry signals. It goes long when RSI drops below the oversold level of 25. After entering, fixed take profit and stop loss levels are set based on entry price. Specifically, take profit level is 7% above entry price and stop loss level is 3.5% below entry price.
The strategy only goes long and does not go short. It is a trend tracking strategy. It aims to capture the upward trend after the price bounces back from oversold RSI levels. When RSI is oversold, it indicates the price may have short term overselling. Going long at this point can benefit from the rebound.
The advantages of this strategy are:
-
The logic is clear and simple, easy to understand and implement.
-
It only goes long, avoiding risks associated with regularity FD003.
-
Long signals come from RSI indicator, which effectively identifies oversold reversal opportunities.
-
Adopting fixed take profit/stop loss ratios controls single trade loss.
There are also some risks with this strategy:
-
It works better in bull market and cannot profit in bear market.
-
It misses opportunities to enter on new high breakouts.
-
Fixed stop loss ratio cannot adapt to changing market volatility.
-
Improper RSI parameter settings may lead to overtrading or insufficient signals.
The strategy can be improved from the following aspects:
-
Adding short side strategy to profit from bear market.
-
Adding new entry conditions like new high breakout or pattern signals to improve accuracy.
-
RSI parameters can be optimized through training to reduce errors.
-
Stop loss mechanism can become more intelligent, combining ATR to adjust based on volatility.
In summary, this strategy has clear logic to go long on oversold RSI levels and track bull trend. Pros are simplicity and straightforwardness while cons are only working for bull market and much room for improvement. It can serve as a baseline long side trend tracking strategy. More conditions, filters and indicators could be introduced to turn it into a reliable positive swing system.
[/trans]
Strategy Arguments
| Argument | Default | Description |
|---|---|---|
| v_input_1 | 14 | RSI Length |
| v_input_2 | 25 | Overbought Level |
| v_input_3 | 0.07 | Long Take Profit % |
| v_input_4 | 0.035 | Long Stop Loss % |
Source (PineScript)
/*backtest
start: 2023-12-28 00:00:00
end: 2024-01-03 00:00:00
period: 3m
basePeriod: 1m
exchanges: [{"eid":"Futures_Binance","currency":"BTC_USDT"}]
*/

//@version=5
strategy("RSI BENI strategy (Long Only)", overlay=true, shorttitle="RSI BENI Long")

length = input(14, title="RSI Length")
overSold = input(25, title="Overbought Level")
price = close
vrsi = ta.rsi(price, length)

// Plot Einstiege und Levels im Chart für überverkaufte Zonen
plotshape(series=strategy.position_avg_price > 0 and vrsi[1] <= overSold and vrsi > overSold,
         title="Long Entry",
         color=color.green,
         style=shape.triangleup,
         size=size.small,
         location=location.belowbar)

long_tp_inp = input(0.07, title='Long Take Profit %')
long_sl_inp = input(0.035, title='Long Stop Loss %')

long_take_level = strategy.position_avg_price * (1 + long_tp_inp)
long_stop_level = strategy.position_avg_price * (1 - long_sl_inp)

plot(long_take_level, color=color.green, title="Long Take Profit Level", linewidth=2)
plot(long_stop_level, color=color.red, title="Long Stop Loss Level", linewidth=2)

if (not na(vrsi))
    if vrsi < overSold
        // Long Entry
        strategy.entry("Long", strategy.long, comment="enter long")

        strategy.exit("Take Profit/Stop Loss", "Long", limit=long_take_level, stop=long_stop_level)
Detail
https://www.fmz.com/strategy/437800
Last Modified
2024-01-05 16:19:57