Name
基于SMA均线系统的趋势跟踪策略SMA-System-Trend-Following-Strategy
Author
ChaoZhang
Strategy Description
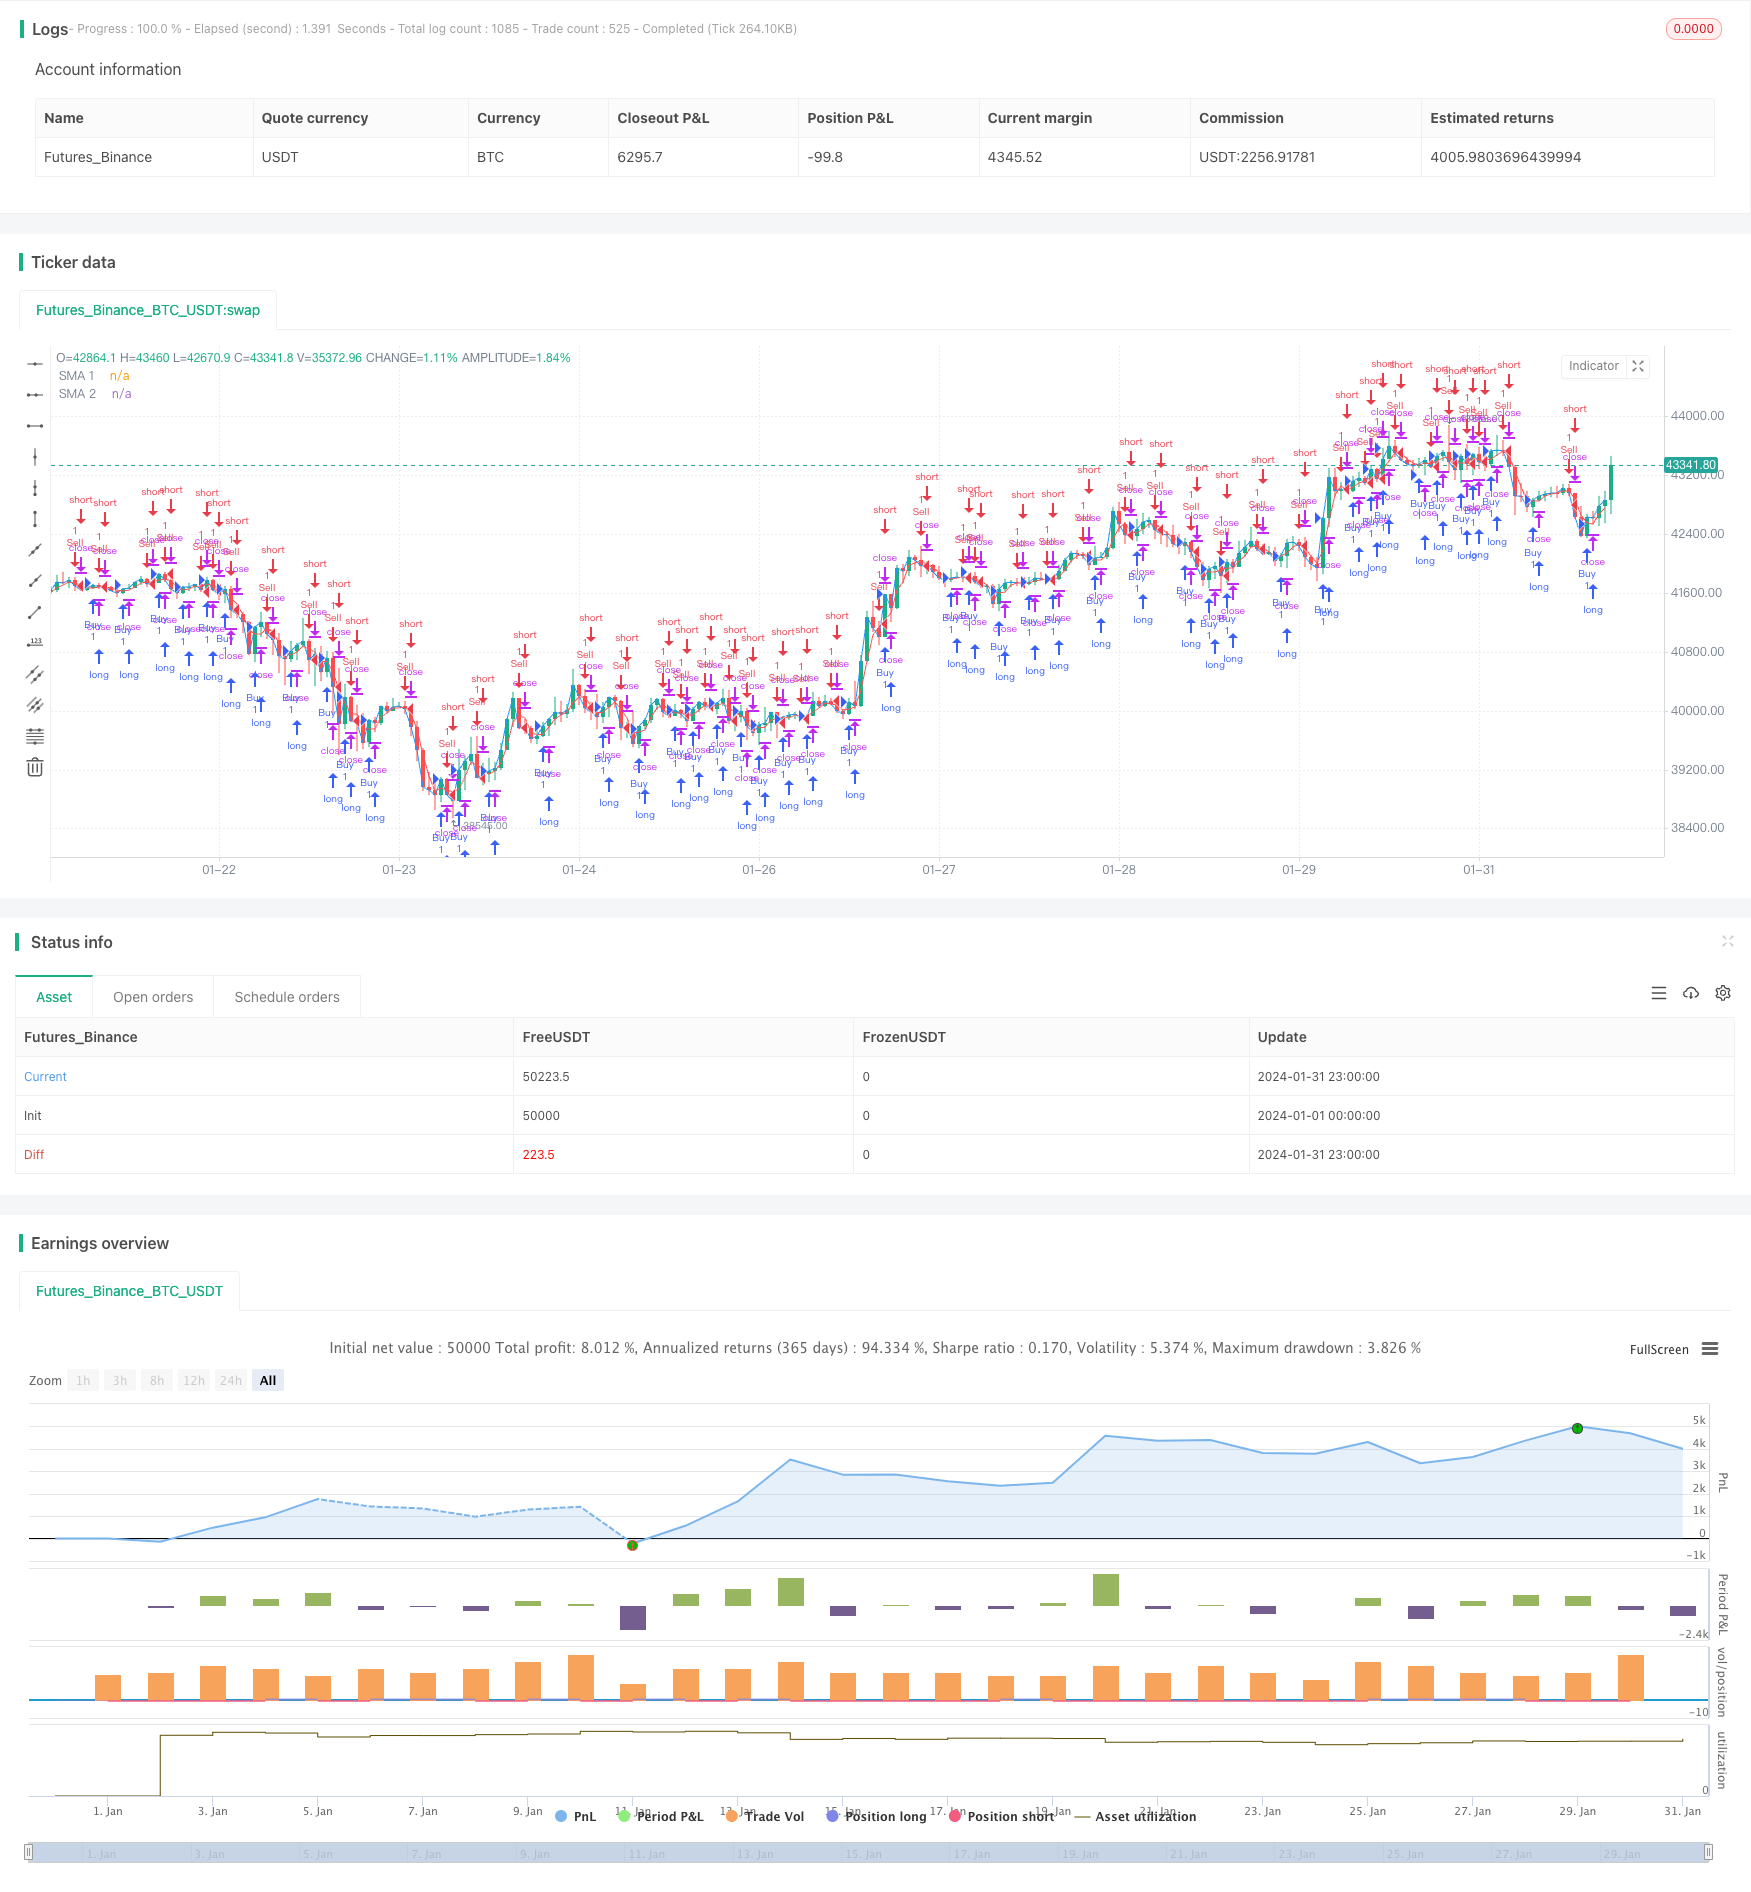
本策略名称为“基于SMA均线系统的趋势跟踪策略”,其主要思想是利用不同参数长度的SMA均线构建交易信号,在突破点进行入场,同时结合止损机制控制风险。
该策略使用两个SMA均线,即SMA1和SMA2。其中,SMA1长度为1,SMA2长度为3。策略通过计算这两个SMA均线,在SMA1上穿SMA2时生成买入信号,在SMA1下穿SMA2时生成卖出信号,从而捕捉价格趋势。
具体来说,策略通过ta.crossover和ta.crossunder函数判断SMA均线的突破关系,由此产生longCondition和shortCondition布尔变量。当longCondition为真时,生成买入信号;当shortCondition为真时,生成卖出信号。策略会在信号点进行入场,同时更新profitAccumulated和lastTradeProfit变量来跟踪累积收益。
为了风险控制,策略还设定了基于固定点数的止损机制。从入场点开始,如果价格达到设定的止损点,那么会触发止损单的平仓。
该策略最大的优势在于利用SMA均线的趋势跟踪功能,有效地捕捉价格趋势的变化。相比单一均线策略,双均线策略可以利用均线之间的交叉关系判断趋势方向,从而产生交易信号。此外,策略加入了止损机制,可以有效控制单笔损失。
该策略存在的主要风险在于均线策略容易产生虚假信号。当价格出现震荡时,SMA均线可能频繁交叉,导致不必要的交易信号。此时,如果没有效果止损,则可能产生较大亏损。
该策略可以从以下几个方面进行优化:
-
调整SMA参数,寻找最佳均线长度组合。可以通过遍历回测获得最优参数。
-
增加过滤条件,在均线交叉点附近设置价格突破条件,避免虚假信号。
-
可以测试不同类型的止损方式,如移动止损、挂单止损等。
-
增加Position Size控制,优化资金利用效率。
本策略总体来说是一个典型的趋势跟踪策略。它利用SMA均线的突破关系判断价格趋势方向,在趋势变化点进行入场。同时,策略带有固定止损功能来控制风险。该策略简单实用,容易理解,但仍需深入测试与优化,方能在实盘中稳定获利。
||
The strategy is named "SMA System Trend Following Strategy". The main idea is to construct trading signals based on the SMA lines with different parameter lengths and enter the market at breakpoint, with stop loss mechanism to control the risk.
The strategy uses two SMA lines, SMA1 and SMA2. SMA1 length is 1 and SMA2 length is 3. By calculating these two SMA lines, when SMA1 crosses above SMA2, a buy signal is generated. When SMA1 crosses below SMA2, a sell signal is generated. This aims to capture the trend of the price.
Specifically, the strategy judges the crossover relationship between the SMA lines through the ta.crossover and ta.crossunder functions, generating the longCondition and shortCondition boolean variables. When longCondition is true, a buy signal is generated. When shortCondition is true, a sell signal is generated. The strategy will enter the market at the signal point and update the profitAccumulated and lastTradeProfit variables to track accumulated profits.
For risk control, the strategy also sets a stop loss mechanism based on fixed points. If the price reaches the set stop loss point from the entry point, it will trigger the closing of the stop loss order.
The biggest advantage of this strategy is that it utilizes the trend tracking capability of SMA lines to effectively capture changes in price trends. Compared with single line strategies, double line strategies can use the crossover relationship between the lines to determine the trend direction and thus generate trading signals. In addition, the stop loss mechanism can effectively control single loss.
The main risk of this strategy is that the moving average strategy tends to generate false signals. When the price oscillates, the SMA line may frequently cross, resulting in unnecessary trading signals. At this point, large losses may occur without effective stop loss.
The strategy can be optimized in the following aspects:
-
Adjust SMA parameters to find the best combination of moving average lengths through backtesting.
-
Increase filtering conditions and set price breakthrough conditions near the moving average crossover point to avoid false signals.
-
Different types of stop loss methods can be tested, such as mobile stop loss, pending order stop loss, etc.
-
Add Position Size control to optimize capital utilization efficiency.
Overall, this is a typical trend following strategy. It uses the breakthrough relationship between SMA lines to determine the direction of the price trend and enter at the turning point of the trend. At the same time, the strategy has a fixed stop loss function to control risks. The strategy is simple, easy to understand, but still needs in-depth testing and optimization before making stable profits in real trading.
[/trans]
Strategy Arguments
| Argument | Default | Description |
|---|---|---|
| v_input_1 | true | SMA 1 Longitud |
| v_input_2 | 3 | SMA 2 Longitud |
| v_input_3 | 5000 | Stop Loss (en pips) |
Source (PineScript)
/*backtest
start: 2024-01-01 00:00:00
end: 2024-01-31 23:59:59
period: 1h
basePeriod: 15m
exchanges: [{"eid":"Futures_Binance","currency":"BTC_USDT"}]
*/

// This Pine Script™ code is subject to the terms of the Mozilla Public License 2.0 at https://mozilla.org/MPL/2.0/
// © cesarpieres72

//@version=5
strategy("Estrategia SMA y Ganancias Acumuladas con Stop Loss", shorttitle="SMA_Ganancias", overlay=true)

// Definir las variables de las medias móviles
sma1_length = input(1, title="SMA 1 Longitud")
sma2_length = input(3, title="SMA 2 Longitud")

// Calcular las medias móviles
sma1 = ta.sma(close, sma1_length)
sma2 = ta.sma(close, sma2_length)

// Condiciones para las señales de compra y venta
longCondition = ta.crossover(sma1, sma2)
shortCondition = ta.crossunder(sma1, sma2)

// Acumular las ganancias
var float profitAccumulated = 0.0
var float lastTradeProfit = na

if (longCondition)
    strategy.entry("Buy", strategy.long)
    lastTradeProfit := strategy.netprofit - (profitAccumulated + lastTradeProfit)
    profitAccumulated := strategy.netprofit

if (shortCondition)
    strategy.entry("Sell", strategy.short)
    lastTradeProfit := strategy.netprofit - (profitAccumulated + lastTradeProfit)
    profitAccumulated := strategy.netprofit

// Mostrar las señales en el gráfico
plot(sma1, color=color.blue, title="SMA 1")
plot(sma2, color=color.red, title="SMA 2")

// Añadir stop loss
stopLossPips = input(5000, title="Stop Loss (en pips)")
stopLossPrice = strategy.position_avg_price * (1 - stopLossPips * syminfo.mintick)
strategy.exit("SL", "Buy", stop=stopLossPrice)
Detail
https://www.fmz.com/strategy/442626
Last Modified
2024-02-23 12:29:51