Name
多周期EMA顺势突破交易策略Multiple-Timeframe-EMA-Trend-Following-Trading-Strategy
Author
ChaoZhang
Strategy Description
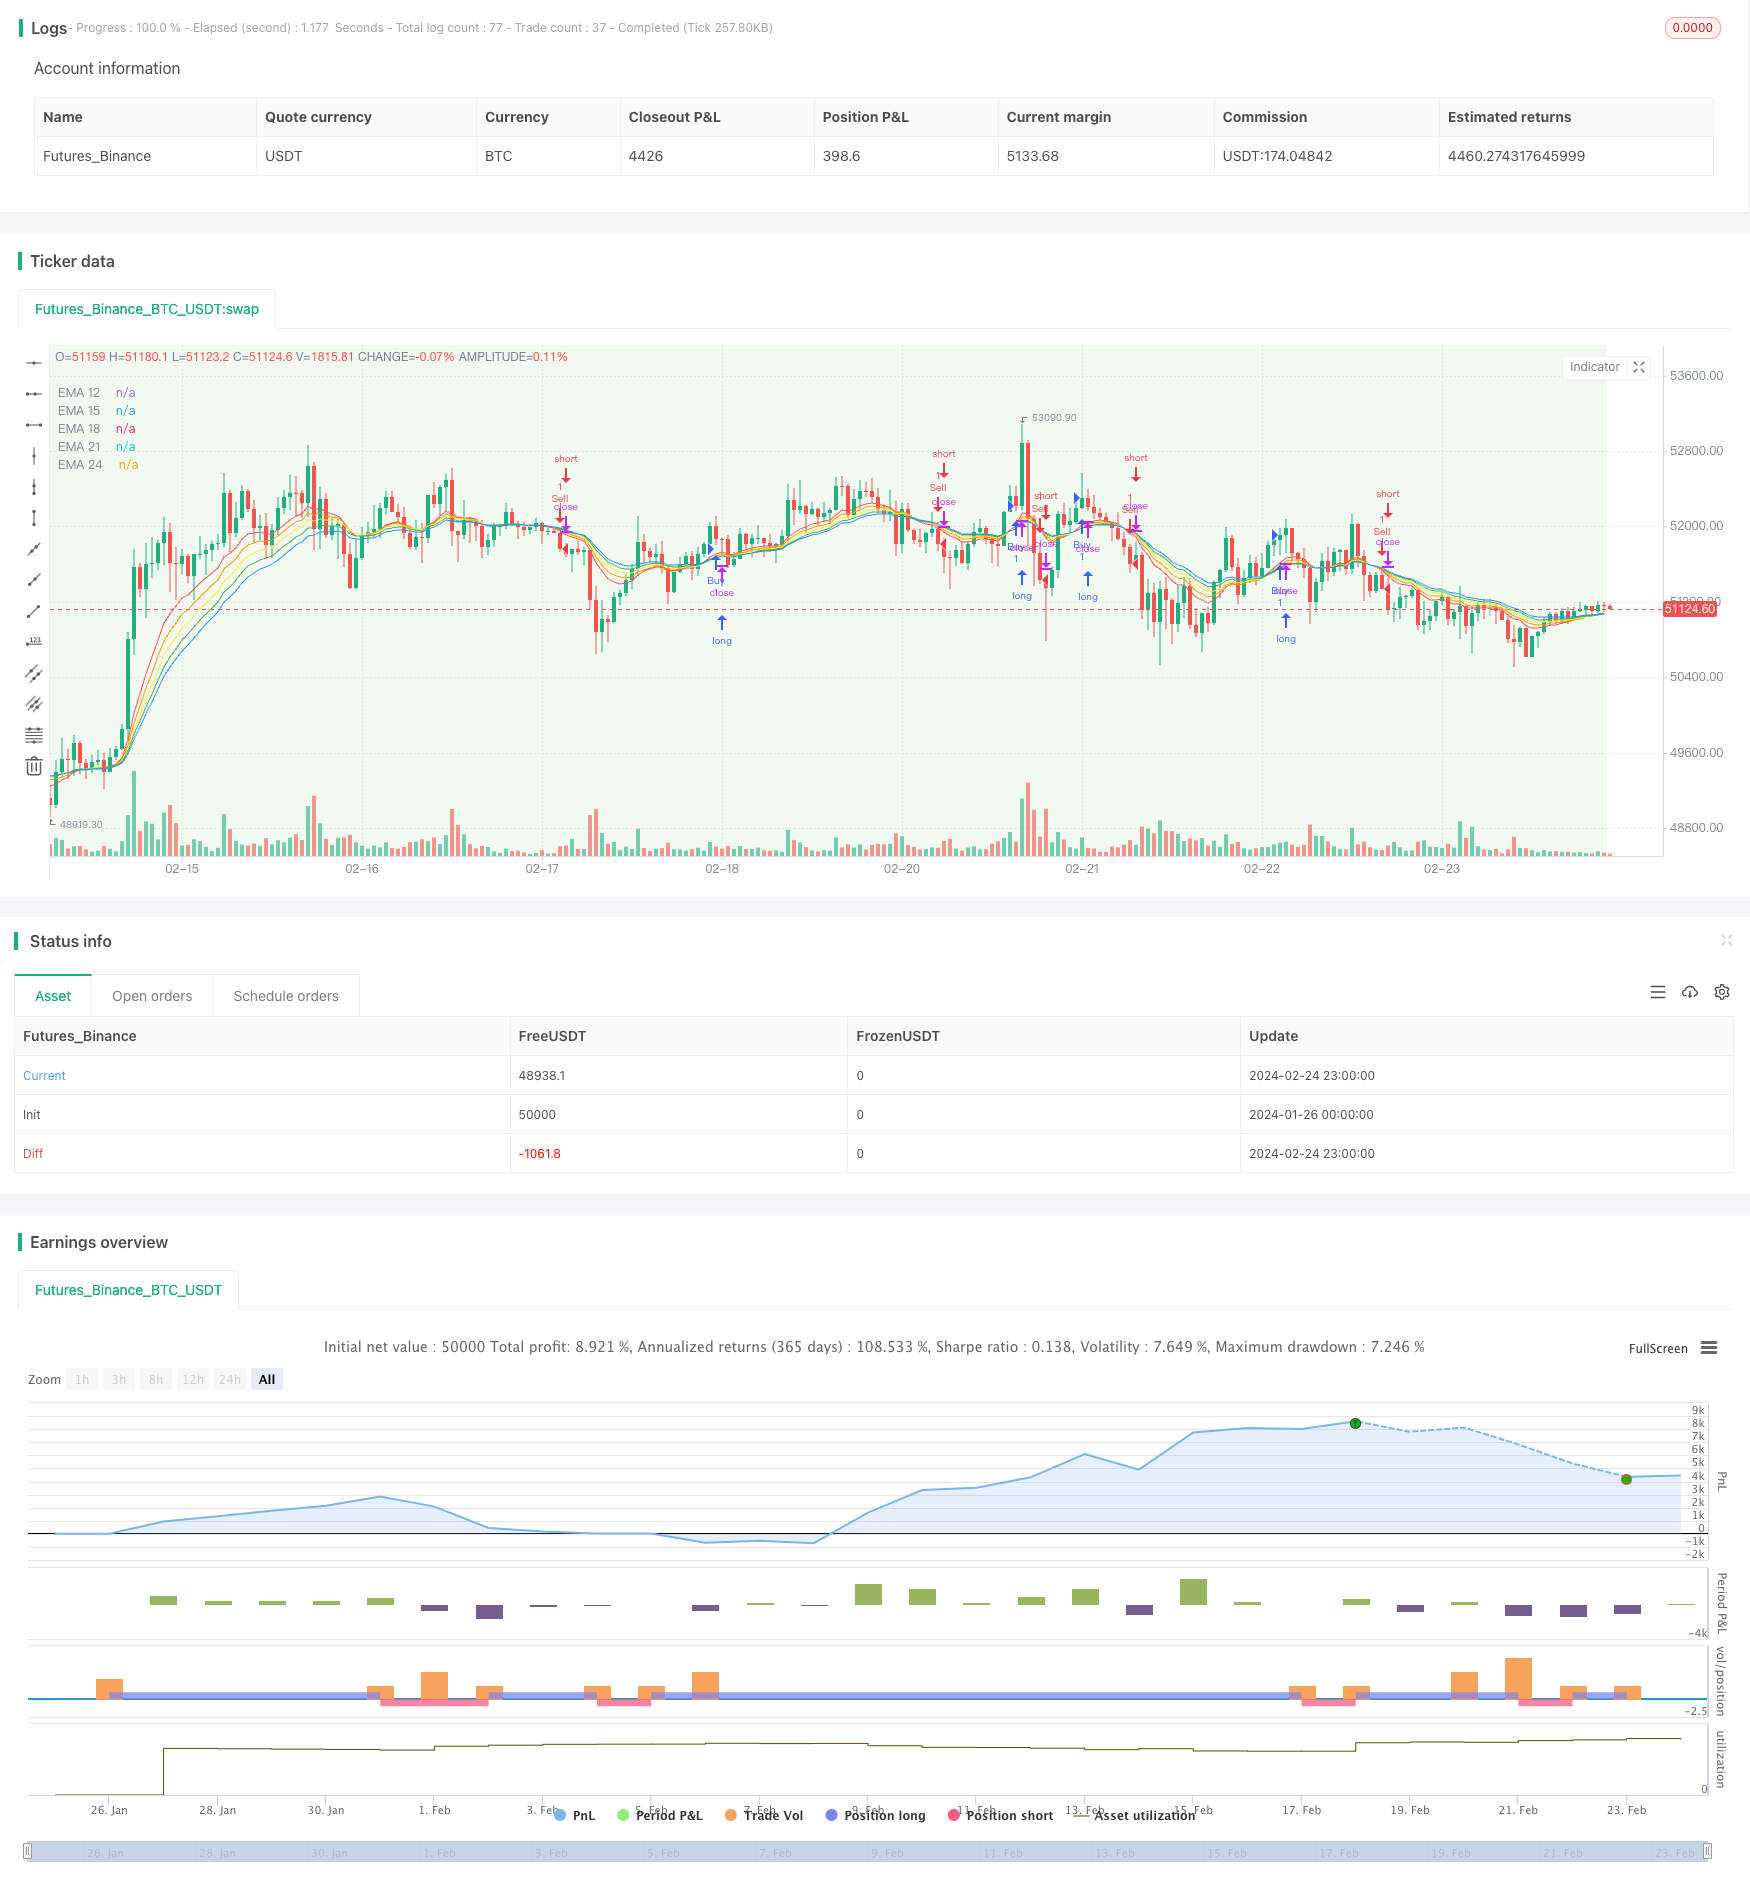
该策略是一种基于多周期指数移动平均线(EMA)的趋势跟踪和顺势突破交易策略。它同时结合了5个不同周期的EMA,具有较强的趋势识别能力,可以顺势捕捉中长线价格运动。
-
计算5个不同周期的EMA,具体为12周期、15周期、18周期、21周期和24周期的EMA。
-
EMA排序:EMA12 > EMA15 > EMA18 > EMA21 > EMA24 作为买入信号;EMA12 < EMA15 < EMA18 < EMA21 < EMA24 作为卖出信号。
-
只有在用户设定的起始日期之后,才会触发交易信号。
-
当触发买入信号时,执行长仓开仓操作;当触发卖出信号时,执行短仓开仓操作。
该策略通过组合多个EMA,形成一个趋势通道,利用通道内外轨的关系判断价格趋势方向。EMA周期设置比较接近,可以提高对突破信号的敏感性,同时也避免被短期市场噪音误导。此外,允许用户自定义策略的起始日期,可实现更大的灵活性。
-
使用多组EMA形成趋势通道,识别趋势的能力较强。
-
EMA周期设置接近,对趋势突破信号灵敏,可及时捕捉中长线趋势。
-
可自定义策略起始日期,使用灵活。
-
资金管理可定制,可控制单笔订单规模。
-
交易规则清晰简单,适合趋势跟踪。
-
EMA本质具有滞后性,可能错过短期剧烈波动。
-
突破交易容易被套,需要合理止损。
-
趋势反转时容易形成重大损失。
-
需要选择合适的股票品种,不适用于波动性过大的股票。
相应的风险控制和优化措施:
-
适当调整EMA参数,优化周期组合。
-
增加其他指标过滤,确定趋势方向。
-
合理设置止损点,控制单笔损失。
-
增加其他指标组合,例如MACD、KDJ等,提高策略效果。
-
添加交易量的条件判断,避免虚假突破。
-
优化EMA的周期参数,寻找最佳组合。
-
在特定时间段停止交易,规避市场波动期。
-
采用机器学习方法动态优化EMA周期和参数。
该策略总体而言是一个较为典型的趋势跟踪策略。它利用EMA的优点,通过组合多个EMA形成交易通道,当价格突破通道时产生交易信号。策略优点是交易规则简单清晰,容易跟踪中长线趋势;缺点是对短期市场噪音敏感,存在一定的滞后性。通过适当调整参数以及加入其他辅助工具的优化,可以提高策略稳定性和效果。它适合有一定交易经验的投资者使用。
||
This strategy is a trend following and breakout trading strategy based on multiple timeframe exponential moving averages (EMA). It combines 5 EMAs with different periods and has strong capabilities in trend identification to catch medium-to-long term price movements along the trend.
-
Calculate 5 EMAs with periods of 12, 15, 18, 21 and 24 respectively.
-
EMA ranking rule: EMA12 > EMA15 > EMA18 > EMA21 > EMA24 as buy signal; EMA12 < EMA15 < EMA18 < EMA21 < EMA24 as sell signal.
-
Trigger trading signals only after the user-defined start date.
-
Long entry when buy signal triggered; short entry when sell signal triggered.
The strategy forms a trend channel using multiple EMAs to determine the trend direction based on the relationship between the channel bands. The EMA periods are set close to be more sensitive to breakout signals, while also avoiding being misled by short-term market noise. Also, allowing users to customize the start date provides more flexibility.
-
Strong capabilities in trend identification using multiple EMAs as the trend channel.
-
Close EMA period setting makes it sensitive to trend breakout signals and able to catch mid-to-long term trends timely.
-
Customizable start date provides flexibility in use.
-
Customizable capital management to control per order size.
-
Clear and simple trading rules, suitable for trend following.
-
EMAs inherently have lagging effect, may miss short-term sharp price swings.
-
Breakout trading is prone to being trapped, requiring reasonable stop loss.
-
Potential huge loss when trend reverses.
-
Need to choose suitable products, not applicable to extremely volatile stocks.
Corresponding risk management and optimizations:
-
Fine tune EMA parameters, optimize period combination.
-
Add other indicators for trend direction validation.
-
Set proper stop loss to control per order loss.
-
Add other indicators like MACD, KDJ to improve strategy performance.
-
Add trading volume condition to avoid false breakout.
-
Optimize EMA periods to find the best combination.
-
Stop trading at specific time range to avoid market turbulence periods.
-
Use machine learning methods to dynamically optimize EMA periods and parameters.
In general, this is a typical trend following strategy. It capitalizes on the advantages of EMAs by forming a trading channel using multiple EMAs and generating trading signals when price breaks out of the channel. The pros are simple and clear trading rules which make it easy to follow mid-to-long term trends. The cons are sensitivity to short-term market noise and inherent lagging effect. Proper parameter tuning and optimizations like adding other assisting tools can improve the stability and performance. It suits investors with some trading experience.
[/trans]
Strategy Arguments
| Argument | Default | Description |
|---|---|---|
| v_input_1 | timestamp(2024-02-01) | Start Date |
Source (PineScript)
/*backtest
start: 2024-01-26 00:00:00
end: 2024-02-25 00:00:00
period: 1h
basePeriod: 15m
exchanges: [{"eid":"Futures_Binance","currency":"BTC_USDT"}]
*/

//@version=5
strategy(title="Scalping Strategy - EMA",
         shorttitle="EMA Scalp",
         overlay=true)

// User input for start date
startDateInput = input(title="Start Date", defval=timestamp("2024-02-01"))

// Calculate EMAs
ema_12 = ta.ema(close, 12)
ema_15 = ta.ema(close, 15)
ema_18 = ta.ema(close, 18)
ema_21 = ta.ema(close, 21)
ema_24 = ta.ema(close, 24)

// Plot EMAs
plot(ema_12, color=color.red, title="EMA 12")
plot(ema_15, color=color.orange, title="EMA 15")
plot(ema_18, color=color.yellow, title="EMA 18")
plot(ema_21, color=color.green, title="EMA 21")
plot(ema_24, color=color.blue, title="EMA 24")

// Define a start date for the strategy based on user input
isAfterStartDate = true

// Visualize the isAfterStartDate condition
bgcolor(isAfterStartDate ? color.new(color.green, 90) : na, title="After Start Date")

// Entry conditions
buy_condition = (ema_12 > ema_15) and (ema_15 > ema_18) and (ema_18 > ema_21) and (ema_21 > ema_24) and isAfterStartDate
sell_condition = (ema_12 < ema_15) and (ema_15 < ema_18) and (ema_18 < ema_21) and (ema_21 < ema_24) and isAfterStartDate

// Execute trades using conditional blocks
if (buy_condition)
    strategy.entry("Buy", strategy.long)

if (sell_condition)
    strategy.entry("Sell", strategy.short)
Detail
https://www.fmz.com/strategy/442864
Last Modified
2024-02-26 16:55:48