Name
多指标趋势追踪交易策略Trend-Following-Trading-Strategy-Based-on-Multiple-Indicators
Author
ChaoZhang
Strategy Description
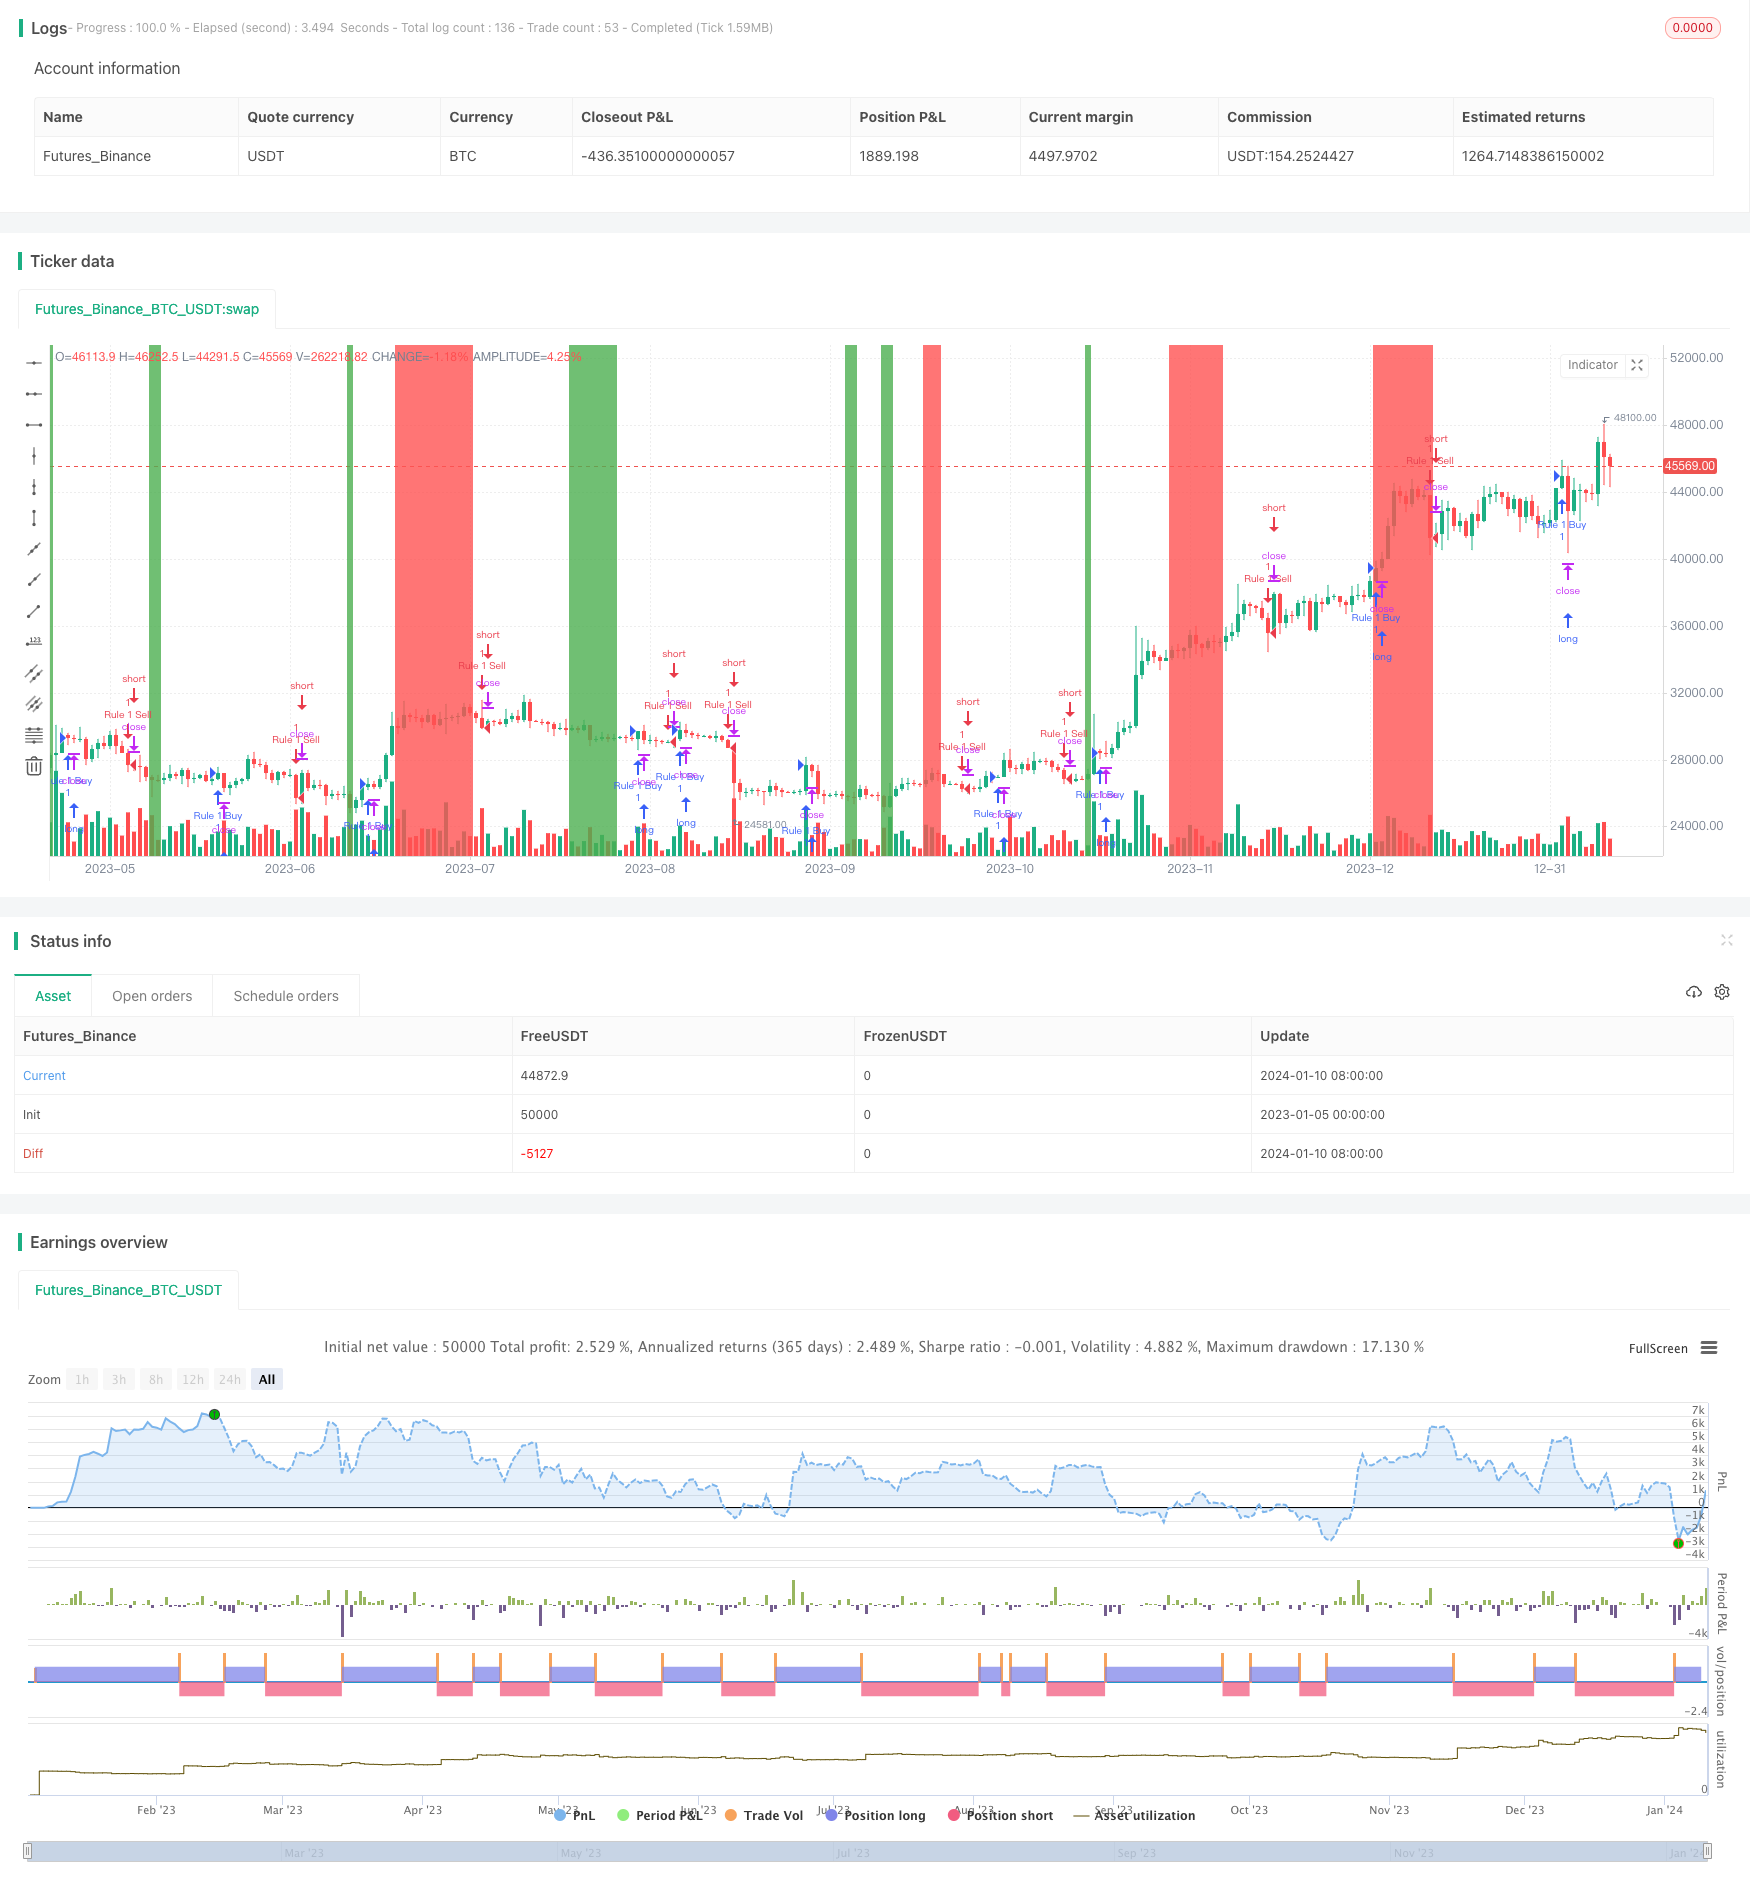
多指标趋势追踪交易策略是一种同时结合MACD、随机指标和SMA移动平均线的量化交易策略。该策略致力于识别市场的趋势方向,在趋势开始建立时及时进入市场,然后利用多种指标的组合信号判断何时退出市场。
该策略同时使用MACD、随机指标和SMA三种技术指标来判断市场的趋势方向和强弱。当MACD差值上穿0轴线、随机指标%K线上穿%D线且高于超买线、SMA快线上穿慢线时,买入信号被触发;当相反的情况发生时,识别到卖出信号。
通过组合多种指标,可以过滤假信号,识别真正的趋势开始和结束。同时,不同指标之间可以形成验证,降低错误交易的概率。
该策略最大的优势在于指标组合使用,可以有效过滤噪音,锁定真实趋势的开始和结束。相比单一使用MACD、随机指标或SMA等,识别效果要好很多。
另外,该策略对参数调节灵活,可以根据不同品种和周期进行调整,适应性强。
该策略主要的风险在于多指标组合增加了交易频率,可能带来过度交易的风险。此外,参数设置不当也会带来错误交易的风险。
为降低风险,应适当控制交易频率,选用长周期,并优化参数组合。必要时可以考虑止损来控制单笔损失。
该策略可以从以下几个方面进行优化:
- 测试不同商品和不同周期参数的效果
- 增加指标的权重和过滤条件,降低错误信号
- 结合止损来控制风险
- 进一步优化指标参数,提高盈利因子
多指标趋势追踪交易策略通过指标的组合验证提高了信号的准确性,能有效识别趋势的开始和结束。参数优化和风险控制是该策略成功的关键。总体来说,该策略回撤小、盈利空间大,是一种非常实用的量化交易策略。
||
The trend following trading strategy based on multiple indicators is a quantitative trading strategy that combines the MACD, Stochastic and SMA moving average. This strategy aims to identify the trend direction in the market and get in the market in a timely manner when a new trend begins. It then uses a combination of signals from multiple indicators to determine when to exit the market.
This strategy uses three technical indicators, MACD, Stochastic and SMA, to judge the strength and direction of the market trend. When the MACD line crosses above the signal line, the %K line of the Stochastic crosses above %D and is above the overbought level, and the fast SMA crosses above the slow SMA, a buy signal is triggered. When the opposite situations happen, a sell signal is identified.
By combining multiple indicators, fake signals can be filtered out and the real beginning and ending of a trend can be recognized. At the same time, different indicators can form verification and reduce the probability of erroneous trades.
The biggest advantage of this strategy is the combination of multiple indicators, which can effectively filter out market noise and lock in the real beginning and ending of trends. Compared with using a single MACD, Stochastic or SMA, the recognition effect is much better.
In addition, this strategy is flexible in parameter tuning and can be adjusted for different products and cycles, making it highly adaptable.
The main risk of this strategy is that the combination of multiple indicators increases the trading frequency and brings the risk of overtrading. In addition, improper parameter settings can also introduce the risk of erroneous trades.
To reduce risks, trading frequency should be appropriately controlled, longer cycles selected, and parameters optimized. When necessary, stop loss can be considered to control single trade loss.
The strategy can be optimized in the following aspects:
- Test the effects of different products and cycle parameters
- Increase indicator weighting and filtering conditions to reduce erroneous signals
- Incorporate stop loss to control risks
- Further optimize indicator parameters to improve profit factors
The trend following trading strategy based on multiple indicators improves signal accuracy through composite validation of indicators, and can effectively identify the beginning and ending of trends. Parameter optimization and risk control are the keys to the success of this strategy. In general, this strategy has small drawdowns and large profit potential, making it a very practical quantitative trading strategy.
[/trans]
Strategy Arguments
| Argument | Default | Description |
|---|---|---|
| v_input_1 | 8 | fastLength |
| v_input_2 | 17 | slowlength |
| v_input_3 | 9 | MACDLength |
| v_input_4 | 14 | stochasticLength |
| v_input_5 | 80 | stochasticOverBought |
| v_input_6 | 20 | stochasticOverSold |
| v_input_7 | 10 | emaSignal |
Source (PineScript)
/*backtest
start: 2023-01-05 00:00:00
end: 2024-01-11 00:00:00
period: 1d
basePeriod: 1h
exchanges: [{"eid":"Futures_Binance","currency":"BTC_USDT"}]
*/

//@version=3
strategy("Rule Number 1 Signals", overlay=true)

//Calculate MACD crossing or not
fastLength = input(8)
slowlength = input(17)
MACDLength = input(9)

MACD = ema(close, fastLength) - ema(close, slowlength)
aMACD = ema(MACD, MACDLength)
macdDelta = MACD - aMACD

//Calculate Stochastic Crossing

stochasticLength = input(14, minval=1)
stochasticOverBought = input(80)
stochasticOverSold = input(20)
emaSignal = input(10)
smoothK = 5
smoothD = 5

k = sma(stoch(close, high, low, stochasticLength), smoothK)
d = sma(k, smoothD)

//Crossovers and Over /Under
macdCrossOver = crossover(macdDelta, 0)
macdCrossUnder = crossunder(macdDelta, 0)
macdOver = macdDelta > 0
macdUnder = macdDelta < 0

stochasticCrossOver = crossover(k, d)
stochasticCrossUnder = crossunder(k, d)
stochasticOver = k > d
stochasticUnder = k < d

ema = ema(close, emaSignal)
smaCrossOver = crossover(close, ema)
smaCrossUnder = crossunder(close, ema)
smaOver = close > ema
smaUnder = close < ema

if ((macdCrossOver and stochasticOver and smaOver) or (macdOver and stochasticCrossOver and smaOver) or (macdOver and stochasticOver and smaCrossOver))
    strategy.entry("Rule 1 Buy", strategy.long, comment="Rule 1 Buy")
if ((macdCrossUnder and stochasticUnder and smaUnder) or (macdUnder and stochasticCrossUnder and smaUnder) or (macdUnder and stochasticUnder and smaCrossUnder))
    strategy.entry("Rule 1 Sell", strategy.short, comment="Rule 1 Sell")


//Plot the Oversold Study
bgcol = k < stochasticOverSold ? green : k > stochasticOverBought ? red : na
bgcolor(bgcol)
Detail
https://www.fmz.com/strategy/438460
Last Modified
2024-01-12 11:25:04