Name
多时间帧布林带加密货币策略Multi-timeframe-Bollinger-Bands-Crypto-Strategy
Author
ChaoZhang
Strategy Description
这个策略运用布林带指标,分析不同时间帧(1分钟、3分钟、5分钟和15分钟)的加密货币价格变动,寻找买入和卖出的机会。它作为加密货币市场情绪的基准,主要关注比特币的5分钟价格。当比特币价格突破布林带上轨时,认为情绪处于“看涨”状态;反之,当比特币价格跌破布林带下轨时,认为情绪转为“看跌”。策略会在不同币种的不同时间帧上观察布林带的上轨破裂或下轨突破的形态,这些形态通常表明市场情绪和趋势发生转变,因此是进行买入卖出操作的信号。
该策略同时在1分钟、3分钟、5分钟和15分钟的时间帧上计算布林带。布林带由n天(默认20天)的移动平均线及其标准差的若干倍(默认1.5倍)组成。移动平均线表示该币种在一定时间内的平均价格,标准差则反映价格波动的幅度。当价格接近或突破布林带上轨时,表示市场处于高位且波动加大,价格可能反转下跌;当价格接近或跌破布林带下轨时,表示市场处于低位且波动加大,价格可能反转上涨。
该策略运用布林带指标的这一特性,在不同时间帧(1分钟、3分钟、5分钟和15分钟)判断市场的最新进展。当3分钟或5分钟时间帧上的价格突破布林带上轨或下轨时,且1分钟和15分钟时间帧上也出现相关迹象时,该策略判断市场发出了最新买入卖出信号。此外,策略还会参考比特币的5分钟时间帧,判断整个加密货币市场的总体走势和市场情绪(多空氛围),作为参考信号。综合这些因素,策略决定是买入还是卖出。
在开仓后,策略还会设置止损止盈条件。如果持仓价格上涨或下跌了25%,则设置为止盈;如果价格相反方向上涨或下跌超过25%,则设置为止损。
-
该策略综合判断市场的短期和中期走势。1分钟和5分钟时间帧判断市场最新进展,15分钟时间帧判断中期趋势,能够有效避免被市场短期波动误导。
-
该策略同时关注布林带中轨、上轨和下轨的突破,避免错过买入卖出机会。
-
比特币作为市场基准和市场情绪晴雨表,能够提高决策的准确性。
-
设置了止盈止损条件,可以有效控制风险。
-
布林带突破形态具有一定的滞后性,可能错过最佳入场时机。
-
如果加密货币市场整体发生系统性风险像passwords等黑天鹅事件,该策略难以有效应对。
-
虽然设置了止盈止损,但突发事件导致超过止损幅度也会造成较大损失。
-
策略参数如时间长度、标准差倍数等设置不当,会导致交易信号质量下降。
对应的解决方法:
-
结合更多指标判断,确定最佳入场时机。
-
增加对市场系统性风险的评估。
-
适当缩小每次交易的仓位规模和止损幅度。
-
优化参数设定,进行回测验证。
-
增加更多时间帧判断,如30分钟或60分钟布林带指标。
-
根据不同币种的特点,选择更合适的布林带参数,提高指标效果。
-
增加交易量等指标判断。因为成交量能验证价格变动的可靠性。
-
结合Stoch RSI、MACD等其他指标,提高决策准确性。这些指标能够显著提高对市场实际走势的判断。
-
对比不同币种间的价格走势和相关性,选择最有操作空间的交易对象。
-
优化止盈止损策略,通过事后统计分析确定最优参数。
本策略是一种多时间帧布林带加密货币交易策略。它关注市场中短期和中期时间尺度上的价格变动,运用布林带指标判断市场的MULIT多空状态。同时它以比特币价格作为市场基准和参考信号,辅助判断整个加密货币市场的总体走势。该策略具有参考时间帧多样、止盈止损完善等优点,能够有效把握市场机会的同时控制风险,值得推荐。未来可通过进一步优化如新增指标组合、参数调整等手段,进一步提升策略收益率。
||
This strategy applies Bollinger Bands indicator across 1 minute, 3 minutes, 5 minutes and 15 minutes timeframes to analyze price movements of cryptocurrencies, in order to identify buying and selling opportunities. It uses the 5-minute prices of Bitcoin as a benchmark for the overall cryptocurrency market sentiment. When Bitcoin price breaks above the upper band, the market is considered to be bullish. When the price breaks below the lower band, the market is considered to be bearish. The strategy looks for upper or lower band breakouts across different cryptos and timeframes. These breakout patterns usually signify shifts in market sentiment and trends, thus providing entry and exit signals.
The strategy calculates Bollinger Bands simultaneously on the 1-minute, 3-minute, 5-minute and 15-minute timeframes. The Bollinger Bands consist of an n-day (default 20-day) moving average and a number of standard deviations (default 1.5x) above and below it. The moving average represents the average price of the crypto over a period of time and the standard deviation measures the volatility. When prices approach or break above the upper band, it indicates the market is overextended and volatility is expanding, signaling a potential reversal downwards. When prices approach or break below the lower band, it signals the market is oversold with expanding volatility and a potential upwards reversal.
Leveraging this feature of Bollinger Bands, the strategy judges the latest market developments across different time horizons - 1 minute, 3 minutes, 5 minutes and 15 minutes. When there is an upper or lower band breakout in the 3-minute or 5-minute timeframes, plus confirming signs in the 1-minute and 15-minute timeframes, the strategy determines a latest buy or sell signal is triggered. In addition, the strategy also refers to the 5-minute prices of Bitcoin to gauge the overall market trend and sentiment (bullish/bearish bias) in the entire crypto market. Based on these factors, the strategy decides whether to go long or short.
After entering trades, the strategy also sets profit taking and stop loss conditions. If the entry price rises or falls by 25%, take profit will be triggered. If the price moves more than 25% against the entry direction, stop loss will be triggered.
-
The strategy incorporates both short-term and mid-term market views - 1 minute and 5 minutes for latest updates, 15 minutes for mid-term trend, avoiding being misled by temporary market fluctuations.
-
The strategy monitors breakouts of the middle band, upper band and lower band, minimizing missed opportunities.
-
Bitcoin serves as a benchmark and barometer for overall market conditions and sentiments, enhancing decision accuracy.
-
Profit taking and stop loss mechanisms effectively control risks.
-
Bollinger Band breakouts have some lagging attributes and may miss best entry timing.
-
The strategy is vulnerable to market-wide systemic risks like passwords black swan events.
-
Despite profit taking and stop loss in place, losses can still exceed stop loss margin under extreme events.
-
Inappropriate parameter settings like time period, standard deviation multiplier can lead to poor signal quality.
Corresponding solutions:
-
Incorporate more indicators to determine optimal entry timing.
-
Enhance assessment of market-level systemic risks.
-
Reduce position sizing and stop loss margin for each trade.
-
Optimize parameter settings via backtesting.
-
Add more timeframes like 30-minute or 60-minute Bollinger Bands.
-
Select Bollinger Bands parameters more fitting to the characteristics of each crypto.
-
Incorporate trading volume for result verification, as trading volumes validate price movement reliability.
-
Combine other indicators like Stoch RSI, MACD to improve decision accuracy. These indicators can significantly enhance judging actual market movements.
-
Compare price movements and correlations between cryptos and pick the ones with most room to maneuver.
-
Optimize profit taking and stop loss mechanisms by statistical analysis of historical performance to determine optimal settings.
This is a multi-timeframe Bollinger Bands cryptocurrency trading strategy. It focuses on price developments across short-term and mid-term time horizons, leveraging Bollinger Bands to gauge the MULTI bullish/bearish status of the market. Meanwhile, it uses Bitcoin's price levels as benchmarks and references to help determine the overall trend in the broader cryptocurrency market. With its versatility in incorporating multiple timeframes, plus robust profit taking and stop loss mechanisms, this strategy can effectively capitalize opportunities and control risks. Going forward, its performance can be further enhanced by optimizations like integrating more indicators and fine-tuning parameters via backtesting.
[/trans]
Strategy Arguments
| Argument | Default | Description |
|---|---|---|
| v_input_int_1 | 20 | length |
| v_input_string_1 | 0 | Basis MA Type: SMA |
| v_input_1_close | 0 | Source: close |
| v_input_float_1 | 1.5 | StdDev |
| v_input_int_2 | false | Offset |
Source (PineScript)
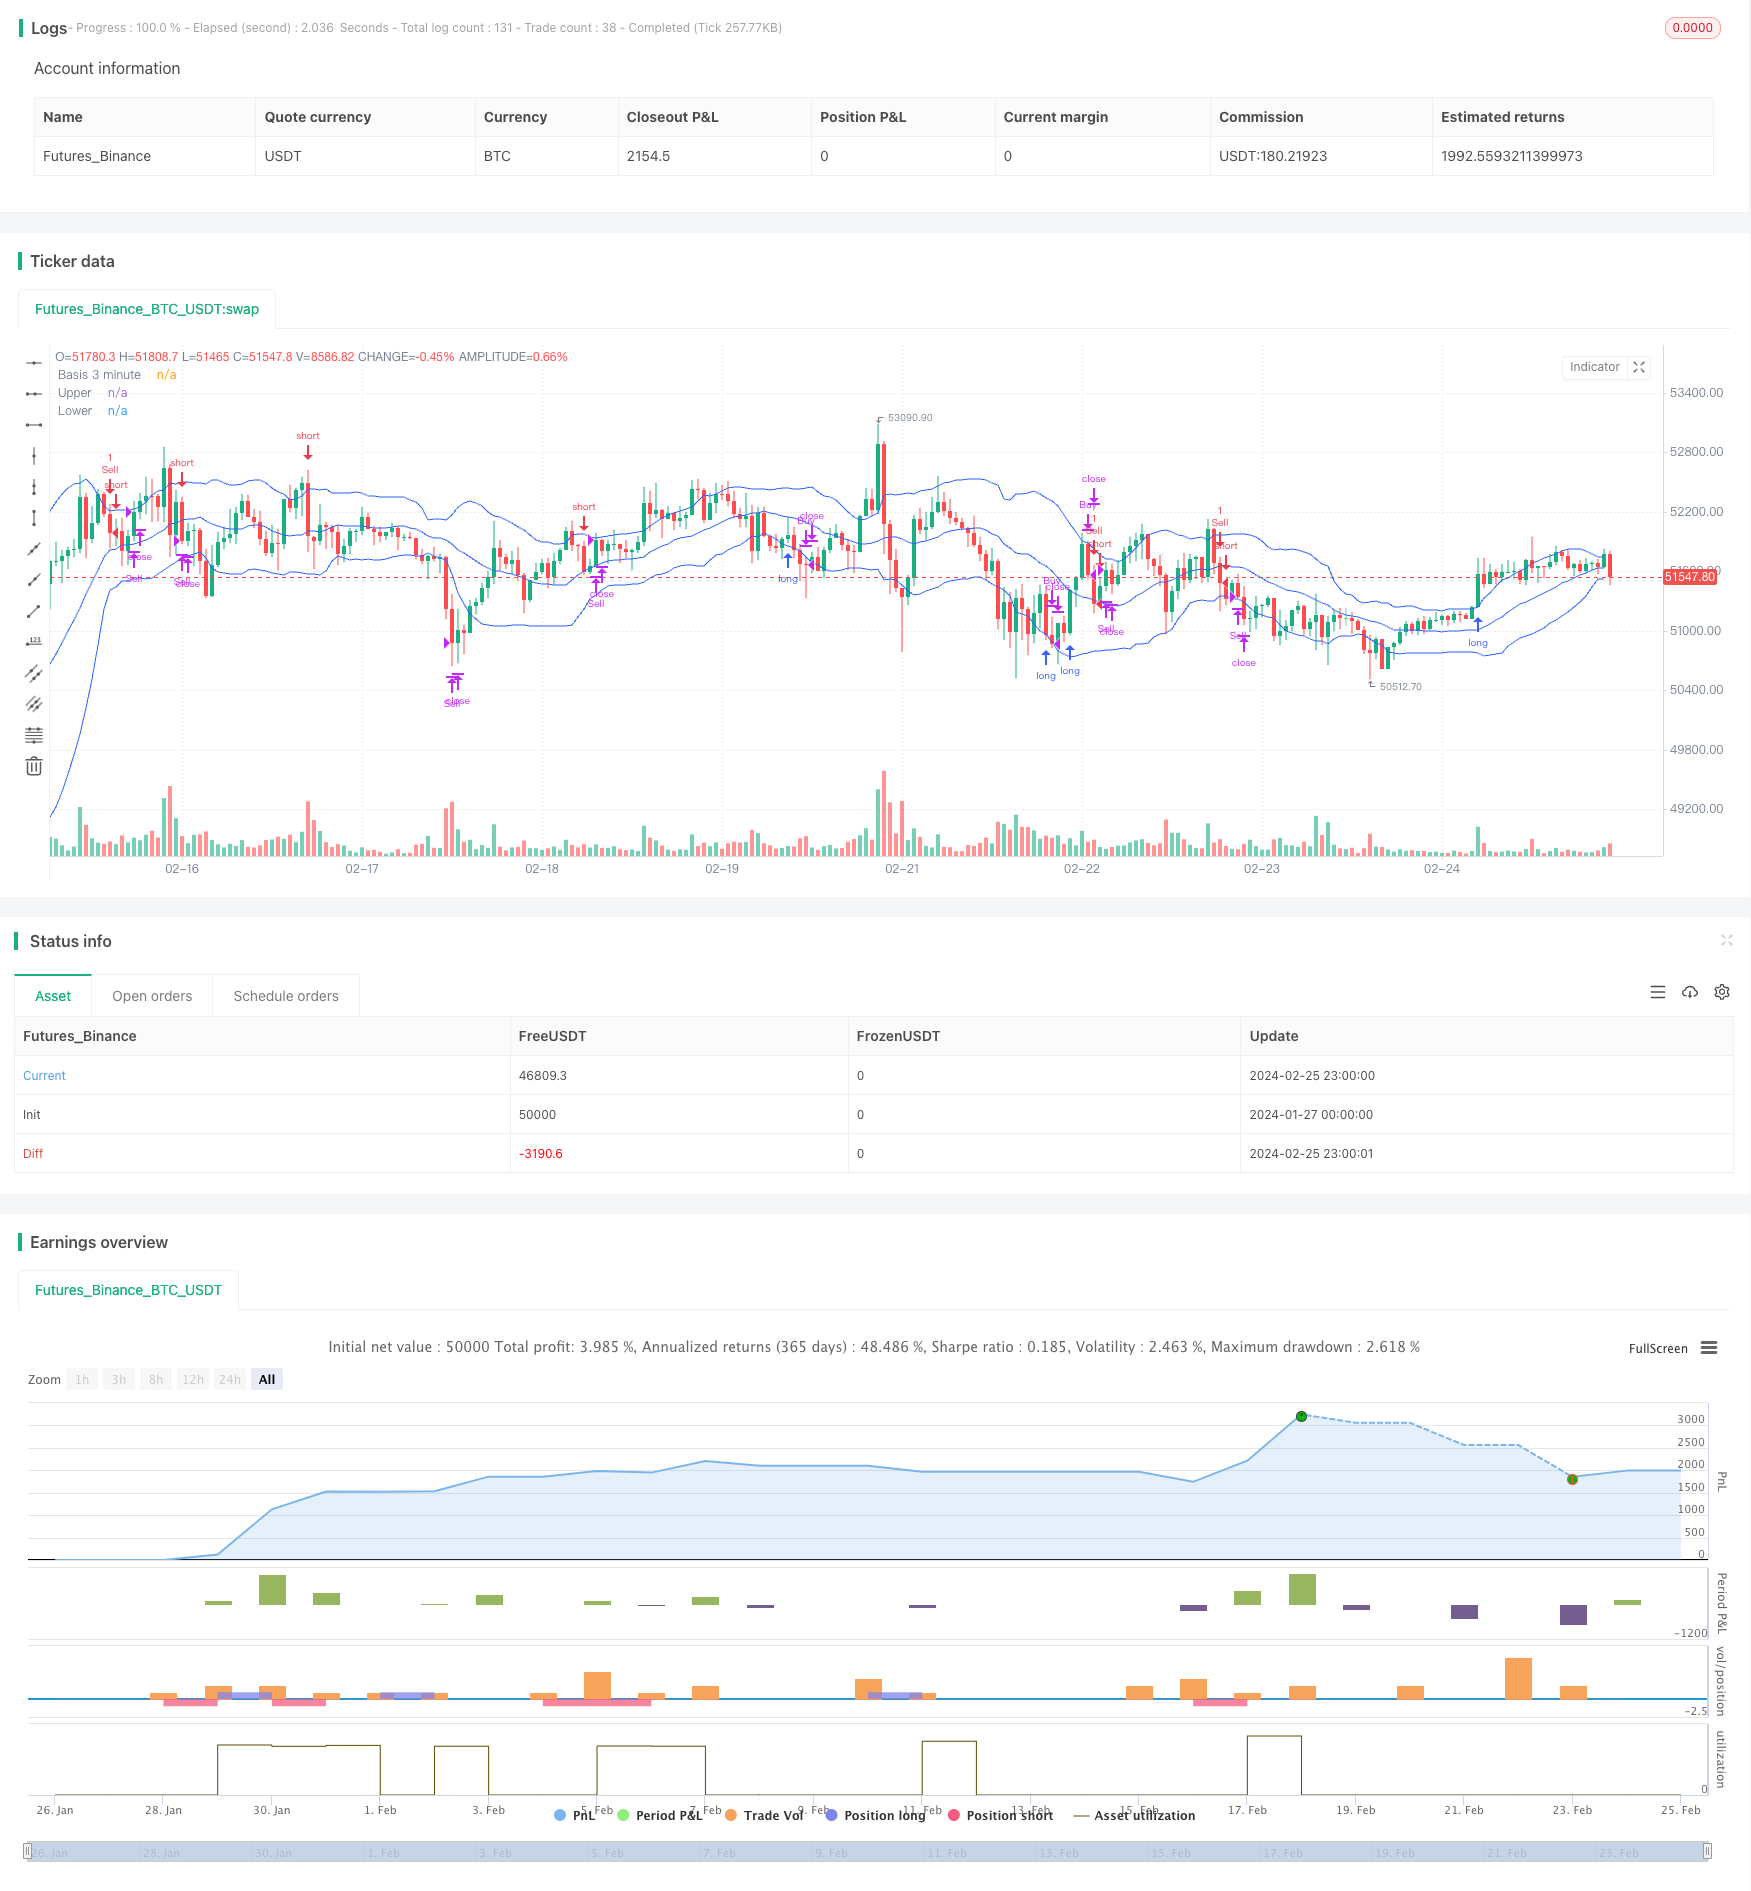
/*backtest
start: 2024-01-27 00:00:00
end: 2024-02-26 00:00:00
period: 1h
basePeriod: 15m
exchanges: [{"eid":"Futures_Binance","currency":"BTC_USDT"}]
*/

//@version=5
strategy(shorttitle="Crypto BB", title="Multi-Interval Bollinger Band Crypto Strategy", overlay=true)
length = input.int(20, minval=1)
maType = input.string("SMA", "Basis MA Type", options = ["SMA", "EMA", "SMMA (RMA)", "WMA", "VWMA"])
src = input(close, title="Source")
mult = input.float(1.5, minval=0.001, maxval=50, title="StdDev")

interval1m = request.security(syminfo.tickerid, '1', src)
interval3m = request.security(syminfo.tickerid, '3', src)
interval5m = request.security(syminfo.tickerid, '5', src)
interval15m = request.security(syminfo.tickerid, '5', src)
btcinterval5m = request.security("BTC_USDT:swap", "5", src)
bitcoinSignal = 'flat'

var entryPrice = 0.000

ma(source, length, _type) =>
    switch _type
        "SMA" => ta.sma(source, length)
        "EMA" => ta.ema(source, length)
        "SMMA (RMA)" => ta.rma(source, length)
        "WMA" => ta.wma(source, length)
        "VWMA" => ta.vwma(source, length)

bitcoinBasis = ma(btcinterval5m, length, maType)
bitcoinDev = ta.stdev(btcinterval5m, length)
bitcoinUpper = bitcoinBasis + bitcoinDev
bitcoinLower = bitcoinBasis - bitcoinDev

basis1m = ma(interval1m, length, maType)
basis3m = ma(interval3m, length, maType)
basis5m = ma(interval5m, length, maType)
basis15m = ma(interval5m, length, maType)
dev1m = mult * ta.stdev(interval1m, length)
dev3m = mult * ta.stdev(interval3m, length)
dev5m = mult * ta.stdev(interval5m, length)
upper1m = basis1m + dev1m
lower1m = basis1m - dev1m
upper3m = basis3m + dev3m
lower3m = basis3m - dev3m
upper5m = basis5m + dev5m
lower5m = basis5m - dev5m
offset = input.int(0, "Offset", minval = -500, maxval = 500)
plot(basis3m, "Basis 3 minute", color=#2962FF, offset = offset)
p3upper = plot(upper3m, "Upper", color=#2962FF, offset = offset)
p3lower = plot(lower3m, "Lower", color=#2962FF, offset = offset)

//Exit protocols
if strategy.opentrades != 0 and strategy.opentrades.entry_id(0) == 'Buy'
    entryPrice := strategy.opentrades.entry_price(0)
    if ((interval1m - entryPrice)/entryPrice) * 30 > .25
        strategy.close('Buy', comment='Take Profit on Buy')
    if ((interval1m - entryPrice)/entryPrice) * 30 < -.25
        strategy.close('Buy', comment='Stop Loss on Buy')

if strategy.opentrades != 0 and strategy.opentrades.entry_id(0) == 'Sell'
    entryPrice := strategy.opentrades.entry_price(0)
    if ((entryPrice - interval1m)/entryPrice) * 30 > .25
        strategy.close('Sell', comment='Take Profit on Sell')
    if ((entryPrice - interval1m)/entryPrice) * 30 < -.25
        strategy.close('Sell', comment='Stop Loss on Sell')

//Bitcoin Analysis
if (btcinterval5m < bitcoinUpper and btcinterval5m[1] > bitcoinUpper[1] and btcinterval5m[2] < bitcoinUpper[2] and btcinterval5m[3] < bitcoinUpper[3])
    bitcoinSignal := 'Bear'
if (btcinterval5m > bitcoinUpper and btcinterval5m[1] < bitcoinUpper[1] and btcinterval5m[2] > bitcoinUpper[2] and btcinterval5m[3] > bitcoinUpper[3])
    bitcoinSignal := 'Bull'

//Short protocols
if (interval3m < basis3m and interval3m[1] > basis3m[1] and interval3m[2] < basis3m[2] and interval3m[3] < basis3m[3]) or
 (interval5m < basis5m and interval5m[1] > basis5m[1] and interval5m[2] < basis5m[2] and interval5m[3] < basis5m[3])
  and strategy.opentrades.entry_id(0) != 'Sell'
   and src < basis1m and src < basis15m
    if strategy.opentrades.entry_id(0) == 'Buy'
        strategy.close('Buy', 'Basis Band Bearish Reversal')
    //strategy.order('Sell', strategy.short, comment = 'Basis band fractal rejection', stop = (upper1m + basis1m)/2)

if (interval3m < upper3m and interval3m[1] > upper3m[1] and interval3m[2] < upper3m[2] and interval3m[3] < upper3m[3]) or
 (interval5m < upper5m and interval5m[1] > upper5m[1] and interval5m[2] < upper5m[2] and interval5m[3] < upper5m[3])
  and strategy.opentrades.entry_id(0) != 'Sell' and bitcoinSignal == 'Bear' and src < upper1m  and src < basis15m
    if strategy.opentrades.entry_id(0) == 'Buy'
        strategy.close('Buy', 'Bearish Trend Reversal')
    strategy.order('Sell', strategy.short, comment = 'Upper band fractal rejection', stop = (upper1m + basis1m)/2)

if (interval3m > basis3m and interval3m[1] < basis3m[1] and interval3m[2] > basis3m[2] and interval3m[3] > basis3m[3]) or
 (interval5m > basis5m and interval5m[1] < basis5m[1] and interval5m[2] > basis5m[2] and interval5m[3] > basis5m[3]) and strategy.opentrades.entry_id(0) != 'Buy'
  and src > basis1m  and src > basis15m
    if strategy.opentrades.entry_id(0) == 'Sell'
        strategy.close('Sell', 'Basis Band Bullish Reversal')
    //strategy.order('Buy', strategy.long, comment = 'Basis band fractal rejection', stop = (lower1m + basis1m)/2)

if (interval3m > lower3m and interval3m[1] < lower3m[1] and interval3m[2] > lower3m[2] and interval3m[3] > lower3m[3]) or
 (interval5m > lower5m and interval5m[1] < lower5m[1] and interval5m[2] > lower5m[2] and interval5m[3] > basis5m[3]) and strategy.opentrades.entry_id(0) != 'Buy'
  and src > lower1m  and src > basis15m and bitcoinSignal == 'Bull'
    if strategy.opentrades.entry_id(0) == 'Sell'
        strategy.close('Sell', 'Bullish Trend Reversal')
    strategy.order('Buy', strategy.long, comment = 'Lower band fractal rejection', stop = (lower1m + basis1m)/2)
Detail
https://www.fmz.com/strategy/442925
Last Modified
2024-02-27 14:13:39