Name
多时间框架跟踪止损策略Multi-Timeframe-Trailing-Stop-Loss-Strategy
Author
ChaoZhang
Strategy Description
本策略是我之前发布的简单跟踪止损策略的多时间框架版本。之前的策略只使用基本的跟踪止损来进入仓位。它效果很好,所以我尝试对它进行了一些改进。我想如果在不同的时间框架上使用相同的ATR跟踪止损,并将它们合并成一个信号,会发生什么。
在该策略中,您可以仅使用ATR止损,并选择另外3个更高时间框架,以及当前时间框架。这些时间框架上的跟踪止损将在图表上绘制。如果所有4个时间框架都发出多头信号,则入场做多。当至少有2个时间框架不同意多头信号时,平掉多头仓位。对于做空也是相同的逻辑。
该策略的核心在于跟踪止损和趋势跟随。跟踪止损用于设置止损位,根据ATR值计算,可以有效避免止损被突破。趋势跟随则通过观察不同时间框架上的趋势方向来决定入场。
具体来说,策略首先在不同时间框架上计算ATR值,并设置止损距离。然后判断价格突破止损位时发出做多或做空信号。如果多个时间框架上的信号一致,那么就入场。此后继续跟踪该方向的止损位。如果一定比例的时间框架信号发生反转,则平仓。
通过结合不同周期的趋势判断,可以有效过滤假突破。同时跟踪止损可以锁定利润,有效控制风险。
- 使用多时间框架判断,可有效过滤噪音,识别趋势方向
- ATR跟踪止损方式可以动态调整止损距离,降低被套利概率
- 结合趋势跟随和止损管理,既可以Following Trend又可以及时止损
- 参数较少,容易理解和调优
- ATR止损如果参数设置不当,可能过于靠近或远离价格,容易被突破或止损距离过大
- 多时间框架组合如果参数设置不当,可能无法有效发挥作用或者判断错误
- 需要同时配置好止损参数和时间框架参数,否则可能无法达到最佳效果
解决方法:
- 反复测试不同的参数组合和品种,找到最佳参数
- 优化时间框架的比例和数量,确保可以提供可靠的趋势判断
- 调整ATR止损的倍数,在止损不被突破和距离不太大之间找到平衡
策略可以从以下方面进行优化:
- 增加或减少时间框架的数量,找到判断最佳趋势的框架组合
- 测试不同的ATR倍数,确定最佳的止损距离
- 添加再入场机制,在趋势持续时建立更多头寸
- 结合其他指标过滤入场时机,例如量价指标等
- 针对不同品种参数进行优化
本策略通过多时间框架ATR跟踪止损的方式,实现了趋势跟随和风险控制的有机结合。相比单一止损,它可以更加清晰地判断趋势方向;相比单时间框架,它过滤了很多噪音。止损参数和时间框架的合理配置是实现最佳效果的关键。该策略适用于能容忍一定回撤的投资者,可以获得较稳定的投资回报。它还有进一步的优化空间和拓展性,是非常有前途的一个策略思路。
||
This strategy is a multi-timeframe version of my previous simple trailing stop loss strategy. The previous strategy only used basic trailing stop loss to enter positions. It worked pretty well so I tried to improve it. I thought what would happen if I use the same ATR trailing stop loss on different timeframes and combine them into one signal.
In this strategy you can only use ATR stops and choose 3 other higher timeframes in addition to your current timeframe. The trailing stop loss from all these timeframes will be plotted on the chart. Enter long position if all 4 timeframes agree on long signal. Close long positions when at least 2 timeframes disagree on long signal. The logic for short positions is the same.
The core of this strategy lies in trailing stop loss and trend following. Trailing stop loss is used to set stop loss level based on ATR value, which can effectively avoid stop loss from being hit. Trend following determines entry based on observing trend direction across different timeframes.
Specifically, the strategy first calculates ATR value on different timeframes and sets stop loss distance. It then generates long/short signals when price breaks through the stop loss level. If signals from multiple timeframes agree, position will be taken. After that, keep tracking the stop loss level per trend direction. If signals from a certain percentage of timeframes reverse, close position.
By combining trend judgment across different periods, fake breakouts can be filtered out effectively. At the same time, trailing stop locks in profits and controls risk.
- Using multiple timeframes helps filter out noise and identify trend direction
- ATR trailing stop adjusts stop distance dynamically, lowering probability of being stopped out
- Combining trend following and stop loss management, you can follow the trend and stop out in time
- Few parameters, easy to understand and optimize
- ATR stop may be too close or too far if parameters not set properly, prone to being hit or stop distance too big
- Multiple timeframes combination may not work effectively or judge wrongly if parameters not set properly
- Need to configure both stop loss and timeframe parameters properly, otherwise may not achieve best results
Solutions:
- Test different parameter sets and products to find optimum
- Optimize ratio and number of timeframes to ensure reliable trend judgment
- Adjust ATR multiplier to balance between not being hit and proper distance
The strategy can be optimized in the following aspects:
- Add/reduce number of timeframes to find best combinations for trend judgment
- Test different ATR multipliers to determine optimum stop distance
- Add re-entry mechanism to build more positions as trend persists
- Incorporate other filters on entry signals e.g. volume indicators etc
- Parameter tuning for different products
This strategy combines trend following and risk control via multi-timeframe ATR trailing stops. Compared to single stop, it identifies trend direction more clearly; compared to single timeframe, it filters out lots of noise. Proper configuration on stop parameters and timeframes is key to achieve best results. It suits investors who can tolerate certain drawdowns and provides steady returns. There is also further room of enhancement and expansibility. It's a very promising strategy idea.
[/trans]
Strategy Arguments
| Argument | Default | Description |
|---|---|---|
| v_input_1 | 14 | ATR Length |
| v_input_2 | 2 | ATR Mult |
| v_input_3 | 120 | TF2 |
| v_input_4 | 180 | TF3 |
| v_input_5 | 240 | TF4 |
| v_input_6 | true | From Day |
| v_input_7 | true | From Month |
| v_input_8 | 2016 | From Year |
| v_input_9 | true | To Day |
| v_input_10 | true | To Month |
| v_input_11 | 2100 | To Year |
Source (PineScript)
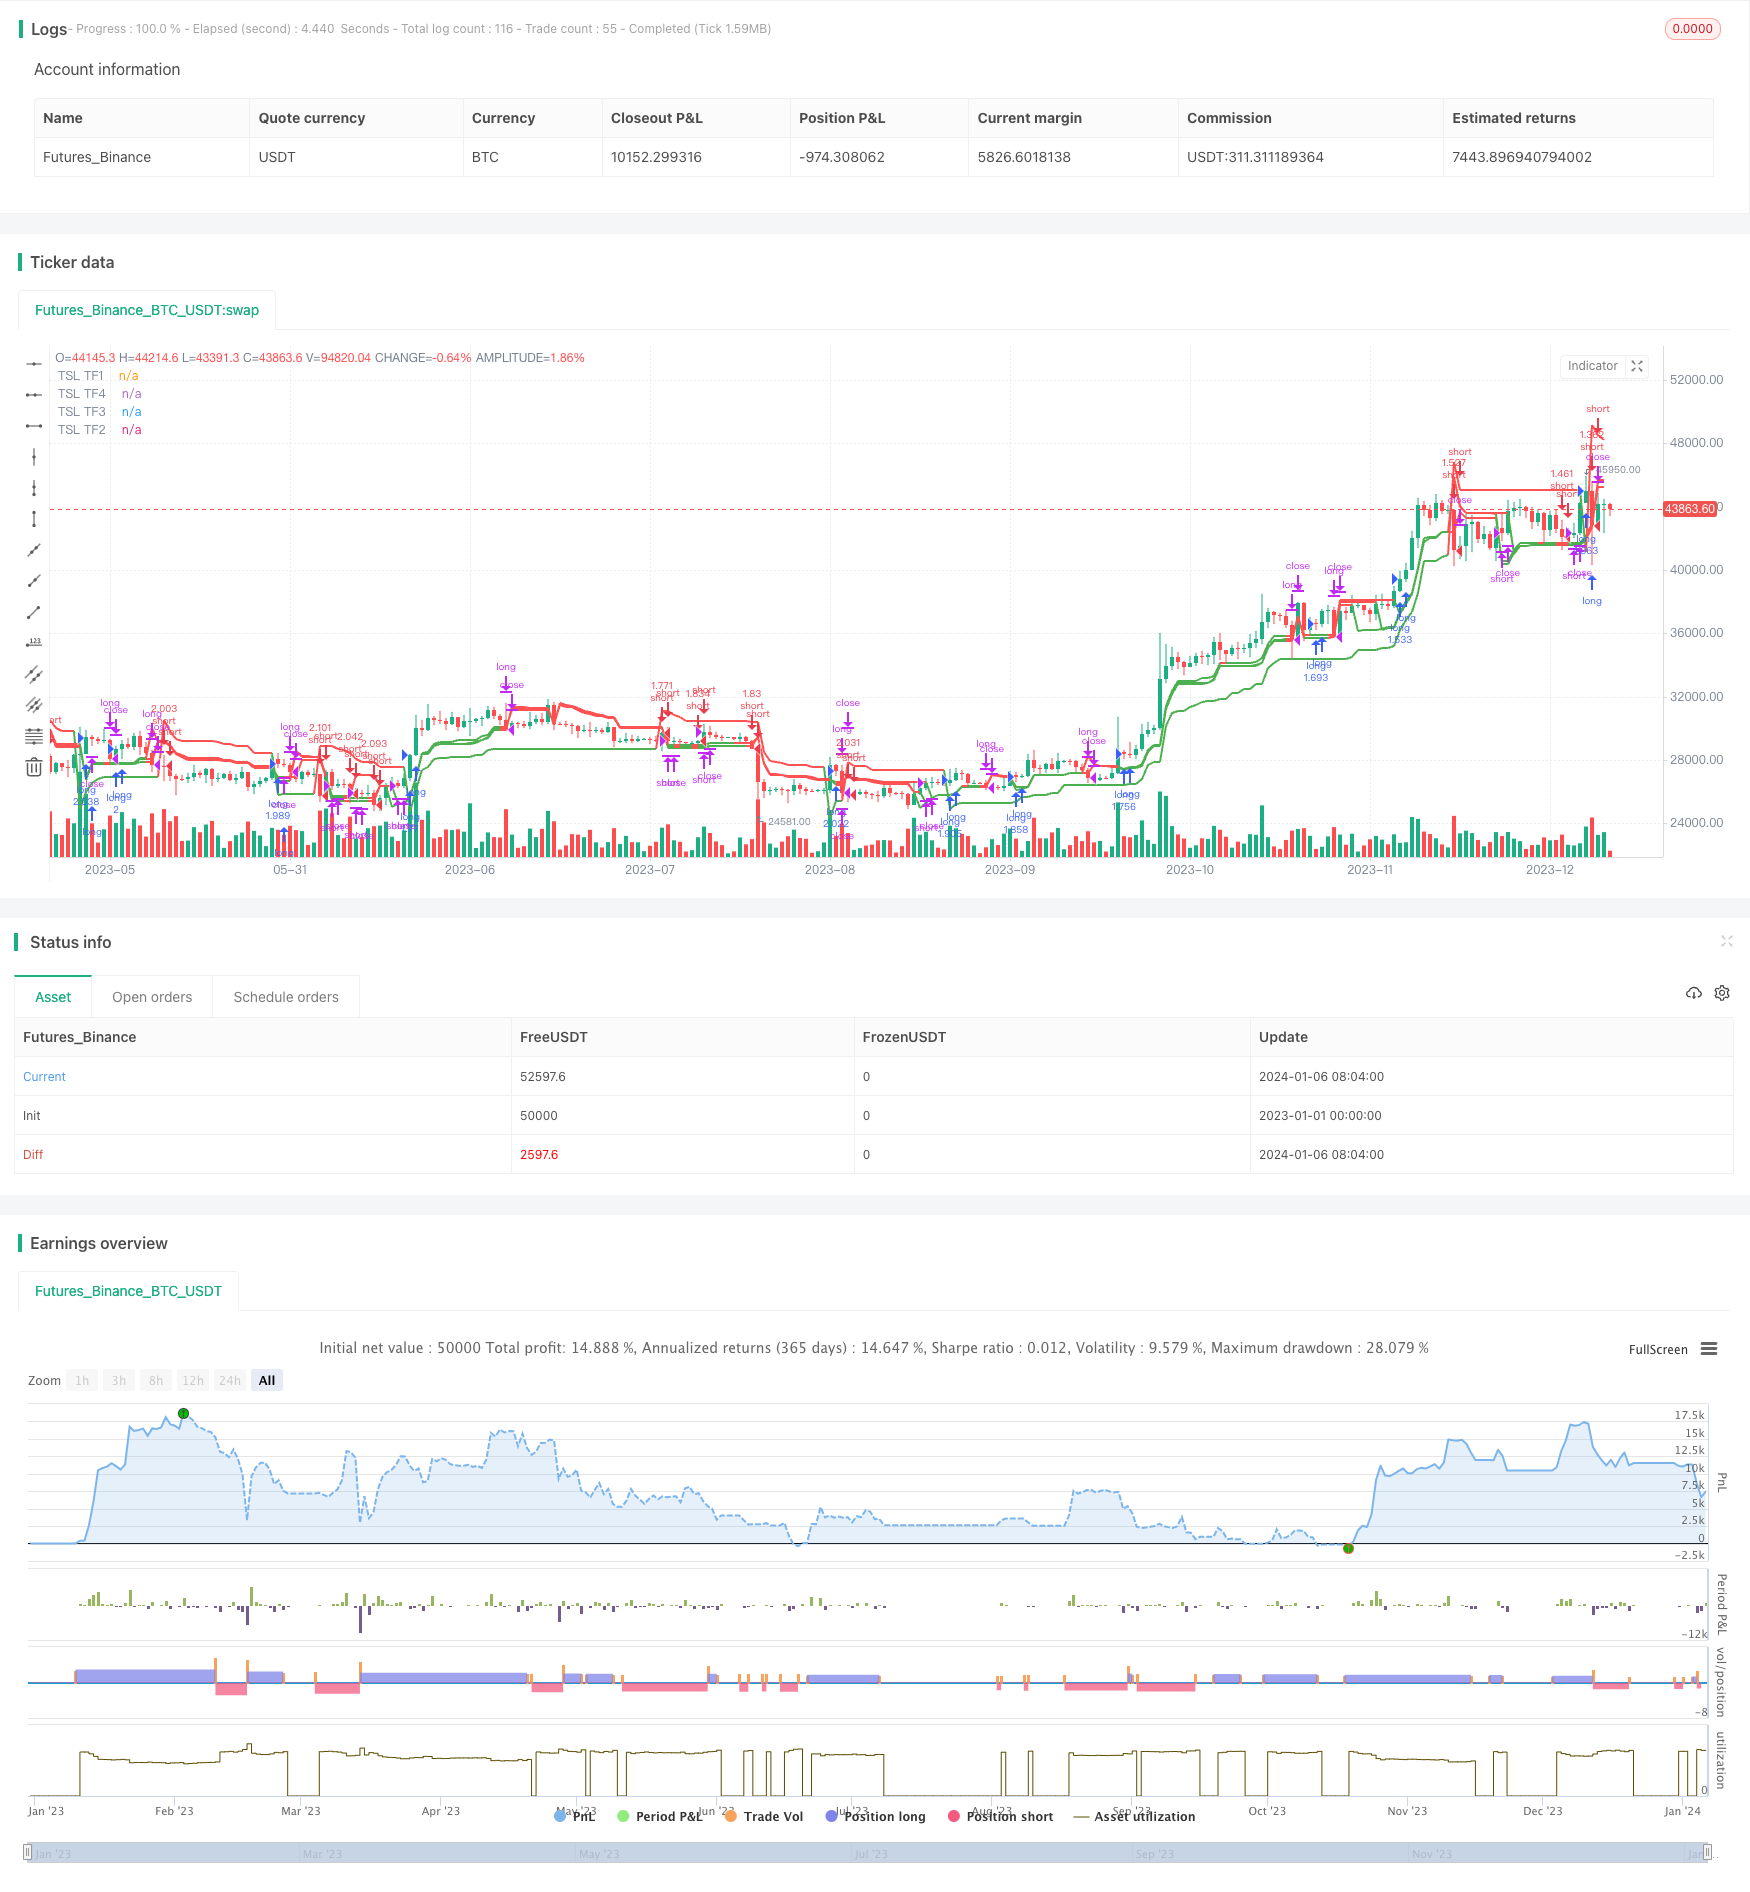
/*backtest
start: 2023-01-01 00:00:00
end: 2024-01-07 00:00:00
period: 1d
basePeriod: 1h
exchanges: [{"eid":"Futures_Binance","currency":"BTC_USDT"}]
*/

//@version=4
strategy(title="MTF Trailing SL Strategy [QuantNomad]", shorttitle = "MTF TrailingSL [QN]", overlay = true, default_qty_type = strategy.percent_of_equity, default_qty_value = 100)

////////////
// Inputs //

atr_length = input(14,    title = "ATR Length")
atr_mult   = input(2,     title = "ATR Mult",    type = input.float)

tf2 = input('120', title = "TF2", type = input.string)
tf3 = input('180', title = "TF3", type = input.string)
tf4 = input('240', title = "TF4", type = input.string)

// BACKTESTING RANGE
// From Date Inputs
fromDay   = input(defval = 1,    title = "From Day",   minval = 1, maxval = 31)
fromMonth = input(defval = 1,    title = "From Month", minval = 1, maxval = 12)
fromYear  = input(defval = 2016, title = "From Year",  minval = 1970)

// To Date Inputs
toDay   = input(defval = 1,    title = "To Day",   minval = 1, maxval = 31)
toMonth = input(defval = 1,    title = "To Month", minval = 1, maxval = 12)
toYear  = input(defval = 2100, title = "To Year",  minval = 1970)

// Calculate start/end date and time condition
startDate  = timestamp(fromYear, fromMonth, fromDay, 00, 00)
finishDate = timestamp(toYear,   toMonth,   toDay,   00, 00)

time_cond = time >= startDate and time <= finishDate

//////////////////
// CALCULATIONS //


tsl() =>
    // SL values
    sl_val = atr_mult * atr(atr_length)

    // Init Variables
    pos         = 0
    trailing_sl = 0.0

    // Signals
    long_signal  = nz(pos[1]) !=  1 and high > nz(trailing_sl[1])
    short_signal = nz(pos[1]) != -1 and low  < nz(trailing_sl[1])

    // Calculate SL
    trailing_sl := short_signal     ? high + sl_val :
                   long_signal      ? low  - sl_val :
                   nz(pos[1]) ==  1 ? max(low  - sl_val, nz(trailing_sl[1])) :
                   nz(pos[1]) == -1 ? min(high + sl_val, nz(trailing_sl[1])) :
                   nz(trailing_sl[1])

    // Position var
    pos := long_signal  ? 1 : short_signal ? -1 : nz(pos[1])
    trailing_sl


trailing_sl1 = tsl()
trailing_sl2 = security(syminfo.tickerid, tf2, tsl())
trailing_sl3 = security(syminfo.tickerid, tf3, tsl())
trailing_sl4 = security(syminfo.tickerid, tf4, tsl())

pos1 = 0
pos1 := low <= trailing_sl1 ? -1 : high >= trailing_sl1 ? 1 : nz(pos1[1])

pos2 = 0
pos2 := low <= trailing_sl2 ? -1 : high >= trailing_sl2 ? 1 : nz(pos2[1])

pos3 = 0
pos3 := low <= trailing_sl3 ? -1 : high >= trailing_sl3 ? 1 : nz(pos3[1])

pos4 = 0
pos4 := low <= trailing_sl4 ? -1 : high >= trailing_sl4 ? 1 : nz(pos4[1])

total_pos = pos1 + pos2 + pos3 + pos4

//////////////
// PLOTINGS //

plot(trailing_sl1, linewidth = 2 , color = pos1 == 1 ? color.green : color.red, title = "TSL TF1")
plot(trailing_sl2, linewidth = 2 , color = pos2 == 1 ? color.green : color.red, title = "TSL TF2", transp = 25)
plot(trailing_sl3, linewidth = 2 , color = pos3 == 1 ? color.green : color.red, title = "TSL TF3", transp = 50)
plot(trailing_sl4, linewidth = 2 , color = pos4 == 1 ? color.green : color.red, title = "TSL TF4", transp = 75)

//////////////
// STRATEGY //

//strategy.entry("long",  true,  stop = trailing_sl1)
//strategy.entry("short", false, stop = trailing_sl1)

strategy.entry("long",    true, when = total_pos ==  4)
strategy.entry("short",  false, when = total_pos == -4)

strategy.close("long",  when = total_pos <= 0)
strategy.close("short", when = total_pos >= 0)
Detail
https://www.fmz.com/strategy/438020
Last Modified
2024-01-08 11:24:24