Name
多重交叉海龟与加权移动平均线与MACD与TSI组合策略Multiple-Crossovers-Turtle-and-Weighted-Moving-Average-and-MACD-and-TSI-Combination-Strategy
Author
ChaoZhang
Strategy Description
这是一个利用多重技术指标进行交易信号判断的策略。它整合了海龟交易法则的双重均线交叉系统、加权移动平均线、MACD和TSI四种主流技术指标,形成多重确认的交易策略。这种组合可以有效过滤假信号,提高稳定性。
该策略的核心原理是多重技术指标的交叉组合。包括以下几个方面:
-
利用海龟交易法则的双重均线交叉产生交易信号。分别计算7日和14日的双重Hull移动平均线,当短期均线上穿长期均线时看涨,下穿时看跌。
-
计算1日的加权移动平均线,作为重要的长期趋势判断指标。
-
计算MACD指标并判断其与信号线的金叉死叉。MACD大于信号线时看涨,小于时看跌。
-
计算TSI指标并判断其是否高于超买线或低于超卖线。TSI高于超买线时看跌,低于超卖线时看涨。
在入场时,要同时满足以下多个条件:
- 7日线上穿14日线
- 1日加权移动平均线若在下方,则仅做多;若在上方,则仅做空
- MACD上穿信号线
- TSI较超卖线高(做多)或较超买线低(做空)
这样可以有效避免单一技术指标产生的假信号,提高稳定性。
这种多重指标交叉组合策略有以下几个优势:
-
多重确认,有效过滤假信号,避免失误交易。
-
技术指标覆盖短中长期,可以捕捉不同级别的交易机会。
-
海龟交易法则经得起实战检验,容易实现稳定盈利。
-
MACD指标对短期行情变化敏感,可以提高策略的实时性。
-
TSI指标比较平滑,可以有效识别超买超卖情况。
-
移动平均线作为重要的长期趋势指标,防止逆势交易。
综上,这种策略集多个指标优点于一体,既稳定又灵活,盈利空间大,是非常出色的量化策略。
这种策略也存在一定的风险,主要集中在以下几个方面:
-
多重指标增加了策略复杂度,参数设置和优化难度较大。
-
指标之间可能出现分歧,从而影响策略稳定性。
-
技术指标发出假信号的概率无法完全消除。
-
错过短期行情反转的机会,无法捕捉快速反转带来的套利空间。
对应地,可以从以下几个方面进一步优化:
-
寻找指标参数的最优组合,提高指标间的协同性。
-
增加止损机制,控制单次损失。
-
结合更多不同类型、不同周期的指标,进一步提高稳定性。
-
适当保留部分资金,利用反转技巧进行套利。
这种策略可以从以下几个方面进行进一步优化:
- 参数优化。可以对指标的参数如周期长度、线数、超买超卖区间等进行优化,找到最佳参数组合。
2.增加止损机制。适当设置移动止损或CLASSES等止损方式,控制亏损。
-
增加更多指标。可以添加KD,OBV,波动率等其他指标,形成更多维度的交叉验证。
-
结合机器学习。将多种技术指标作为输入,运用神经网络等进行信号判断和参数优化。
-
适当保留资金进行对冲。持有一定的反向头寸,利用反转获利。
本策略通过海龟交易法则、移动平均线、MACD和TSI四种技术指标的组合运用,构建了一个稳定性高、灵活性强、实战效果好的量化策略。它兼顾了短中长期行情的捕捉,多重指标交叉验证有效减少了假信号的概率。通过进一步的参数优化、止损机制的增加以及模型的优化,可以获得更好的策略效果。本策略值得实盘验证与应用。
||
This is a strategy that utilizes multiple technical indicators for trading signal judgment. It integrates the dual moving average crossover system of the Turtle Trading Rules, the Weighted Moving Average, MACD and TSI, four mainstream technical indicators, to form a multi-confirmed trading strategy. This combination can effectively filter false signals and improve stability.
The core principle of this strategy is the combination of multiple technical indicators. It includes the following aspects:
-
Use the dual moving average crossover of the Turtle Trading Rules to generate trading signals. Calculate the 7-day and 14-day dual Hull moving averages. When the short term moving average crosses above the long term moving average, it is bullish, and when it crosses below, it is bearish.
-
Calculate the 1-day weighted moving average as an important long-term trend indicator.
-
Calculate the MACD indicator and judge its golden cross and dead cross with the signal line. When MACD is greater than the signal line, it is bullish. When less than, it is bearish.
-
Calculate the TSI indicator and determine if it is above the overbought line or below the oversold line. When the TSI is above the overbought line, it is bearish. When below the oversold line, it is bullish.
When entering the market, the following multiple conditions must be met simultaneously:
- 7-day line crosses above 14-day line
- If the 1-day weighted moving average is below, go long only; if above, go short only
- MACD crosses above signal line
- TSI is higher than oversold line (go long) or lower than overbought line (go short)
This can effectively avoid false signals generated by a single technical indicator and improve stability.
This multi-indicator crossover combination strategy has the following advantages:
-
Multiple confirmations effectively filter false signals and avoid erroneous trades.
-
The technical indicators cover short, medium and long terms, which can capture trading opportunities at different levels.
-
The Turtle Trading Rules have been battle tested and can easily achieve stable profits.
-
The MACD indicator is sensitive to short-term market changes, which can improve the real-time performance of the strategy.
-
The TSI indicator is relatively smooth and can effectively identify overbought and oversold situations.
-
Moving averages as an important long-term trend indicator prevent trading against the trend.
In summary, this strategy combines the advantages of multiple indicators and is both stable and flexible with large profit potential. It is an excellent quantitative strategy.
This strategy also has some risks, mainly in the following areas:
-
Multiple indicators increase the complexity of the strategy and make parameter settings and optimization more difficult.
-
Divergence may occur between indicators, affecting strategy stability.
-
The probability of false signals from technical indicators cannot be completely eliminated.
-
Missing opportunities for short-term market reversals fails to capture arbitrage space from rapid reversals.
Correspondingly, further optimizations can be made in the following areas:
-
Find the optimal combination of indicator parameters to improve coordination between indicators.
-
Increase stop loss mechanisms to control single loss.
-
Incorporate more different types and cycles of indicators to further improve stability.
-
Reserve some funds appropriately using reversal techniques for arbitrage.
This strategy can be further optimized in the following aspects:
-
Parameter optimization. Optimize parameters such as cycle length, number of lines, overbought and oversold intervals, etc. to find the best parameter combination.
-
Increase stop loss mechanisms. Set appropriate moving stop loss or CLASSES and other stop loss methods to control losses.
-
Increase more indicators. Adding indicators like KD, OBV, volatility etc. to form cross-validation in more dimensions.
-
Combine machine learning. Take various technical indicators as input and use neural networks for signal judgment and parameter optimization.
-
Reserve some funds for hedging. Hold certain reverse positions to profit from reversals.
This strategy combines the Turtle Trading Rules, moving average, MACD and TSI technical indicators to build a high stability, high flexibility and battle tested quantitative strategy. It captures both short, medium and long term market moves. Multiple indicator cross validation effectively reduces the probability of false signals. Further optimizations on parameters, stop loss mechanisms and models can achieve better strategy performance. This strategy is worth live trading verification and application.
[/trans]
Strategy Arguments
| Argument | Default | Description |
|---|---|---|
| v_input_1 | 7 | Double HullMA 1 |
| v_input_2 | 14 | Double HullMA 2 |
| v_input_3 | true | VWMA |
| v_input_4 | 7 | MacD fastLength |
| v_input_5 | 14 | MacD slowlength |
| v_input_6 | 3 | MacD Length |
| v_input_7 | 5 | TSI Long Length |
| v_input_8 | 3 | TSI Short Length |
| v_input_9 | 2 | TSI Signal Length |
| v_input_10 | 4 | TSI Upper Line |
| v_input_11 | -4 | TSI Lower Line |
Source (PineScript)
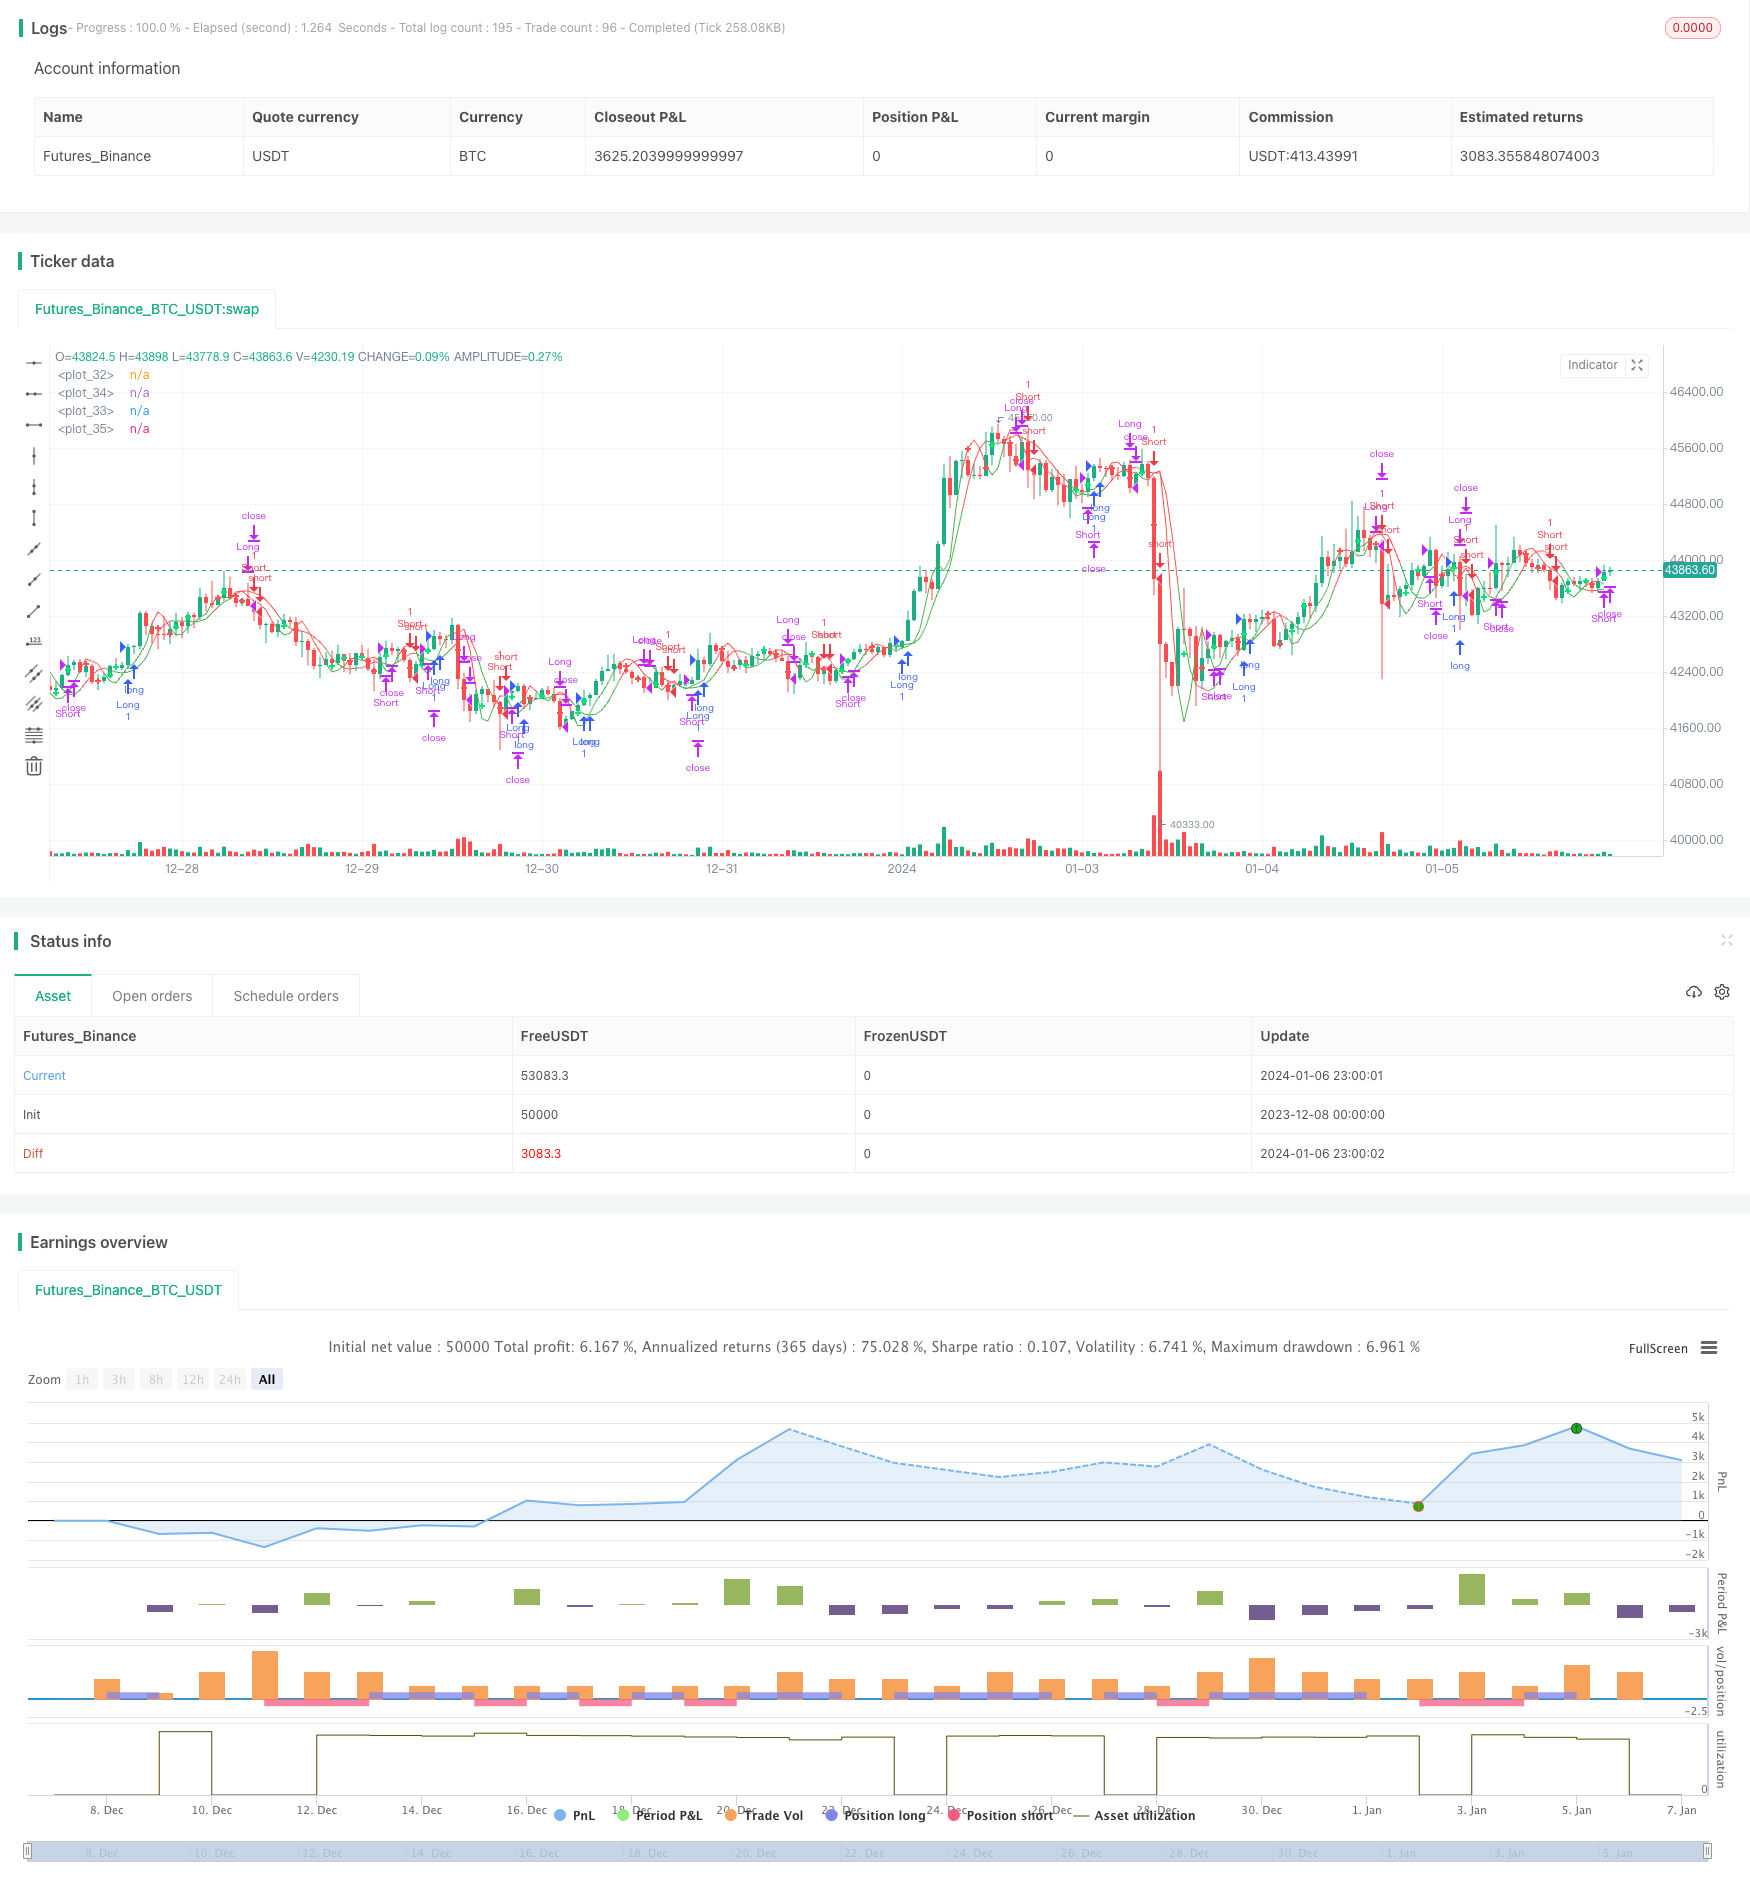
/*backtest
start: 2023-12-08 00:00:00
end: 2024-01-07 00:00:00
period: 1h
basePeriod: 15m
exchanges: [{"eid":"Futures_Binance","currency":"BTC_USDT"}]
*/

//@version=2
//                                                    Quad-HullMA-cross & VWMA & MacD & TSI combination  <<<<< by SeaSide420 >>>>>>
strategy("MultiCross", overlay=true)
keh=input(title="Double HullMA 1",defval=7, minval=1)
teh=input(title="Double HullMA 2",defval=14, minval=1)
meh=input(title="VWMA",defval=1, minval=1)
meh1=vwma(close,round(meh))
n2ma=2*wma(close,round(keh/2))
nma=wma(close,keh)
diff=n2ma-nma,sqn=round(sqrt(keh))
n2ma1=2*wma(close[2],round(keh/2))
nma1=wma(close[2],keh)
diff1=n2ma1-nma1,sqn1=round(sqrt(keh))
n1=wma(diff,sqn)
n2=wma(diff1,sqn)
b=n1>n2?lime:red
c=n1>n2?green:red
n2ma3=2*wma(close,round(teh/2))
nma2=wma(close,teh)
diff2=n2ma3-nma2,sqn2=round(sqrt(teh))
n2ma4=2*wma(close[2],round(teh/2))
nma3=wma(close[2],teh)
diff3=n2ma4-nma3,sqn3=round(sqrt(teh))
n3=wma(diff2,sqn2)
n4=wma(diff3,sqn3)
fastLength = input(title="MacD fastLength", defval=7)
slowlength = input(title="MacD slowlength", defval=14)
MACDLength = input(title="MacD Length", defval=3)
MACD = ema(close, fastLength) - ema(close, slowlength)
aMACD = ema(MACD, MACDLength)
delta = MACD - aMACD
a1=plot(n1,color=c),a2=plot(n2,color=c)
plot(cross(n1, n2) ? n1 : na, style = cross, color=b, linewidth = 3)
a3=plot(n3,color=c),a4=plot(n4,color=c)
plot(cross(n3, n4) ? n1 : na, style = cross, color=b, linewidth = 3)
//a5=plot(meh1,color=c)
long = input(title="TSI Long Length",  defval=5)
short = input(title="TSI Short Length",  defval=3)
signal = input(title="TSI Signal Length",  defval=2)
linebuy = input(title="TSI Upper Line",  defval=4)
linesell = input(title="TSI Lower Line",  defval=-4)
price = close
double_smooth(src, long, short) =>
    fist_smooth = ema(src, long)
    ema(fist_smooth, short)
pc = change(price)
double_smoothed_pc = double_smooth(pc, long, short)
double_smoothed_abs_pc = double_smooth(abs(pc), long, short)
tsi_value = 100 * (double_smoothed_pc / double_smoothed_abs_pc)
closelong = n1<n2 and n3<n4 and n1>meh1
if (closelong)
    strategy.close("Long")
closeshort = n1>n2 and n3>n4 and n1<meh1
if (closeshort)
    strategy.close("Short")
longCondition = strategy.opentrades<1 and n1>n2 and MACD>aMACD and n1<meh1 and n3>n4 and ema(tsi_value, signal)>linesell
if (longCondition)
    strategy.entry("Long",strategy.long)
shortCondition = strategy.opentrades<1  and n1<n2 and MACD<aMACD and n1>meh1 and n3<n4 and ema(tsi_value, signal)<linebuy
if (shortCondition)
    strategy.entry("Short",strategy.short)
Detail
https://www.fmz.com/strategy/438033
Last Modified
2024-01-08 14:19:02