Name
多重技术指标配合的趋势追踪型量化策略Quantitative-Trend-Tracking-Strategy-Based-on-Multiple-Technical-Indicators
Author
ChaoZhang
Strategy Description
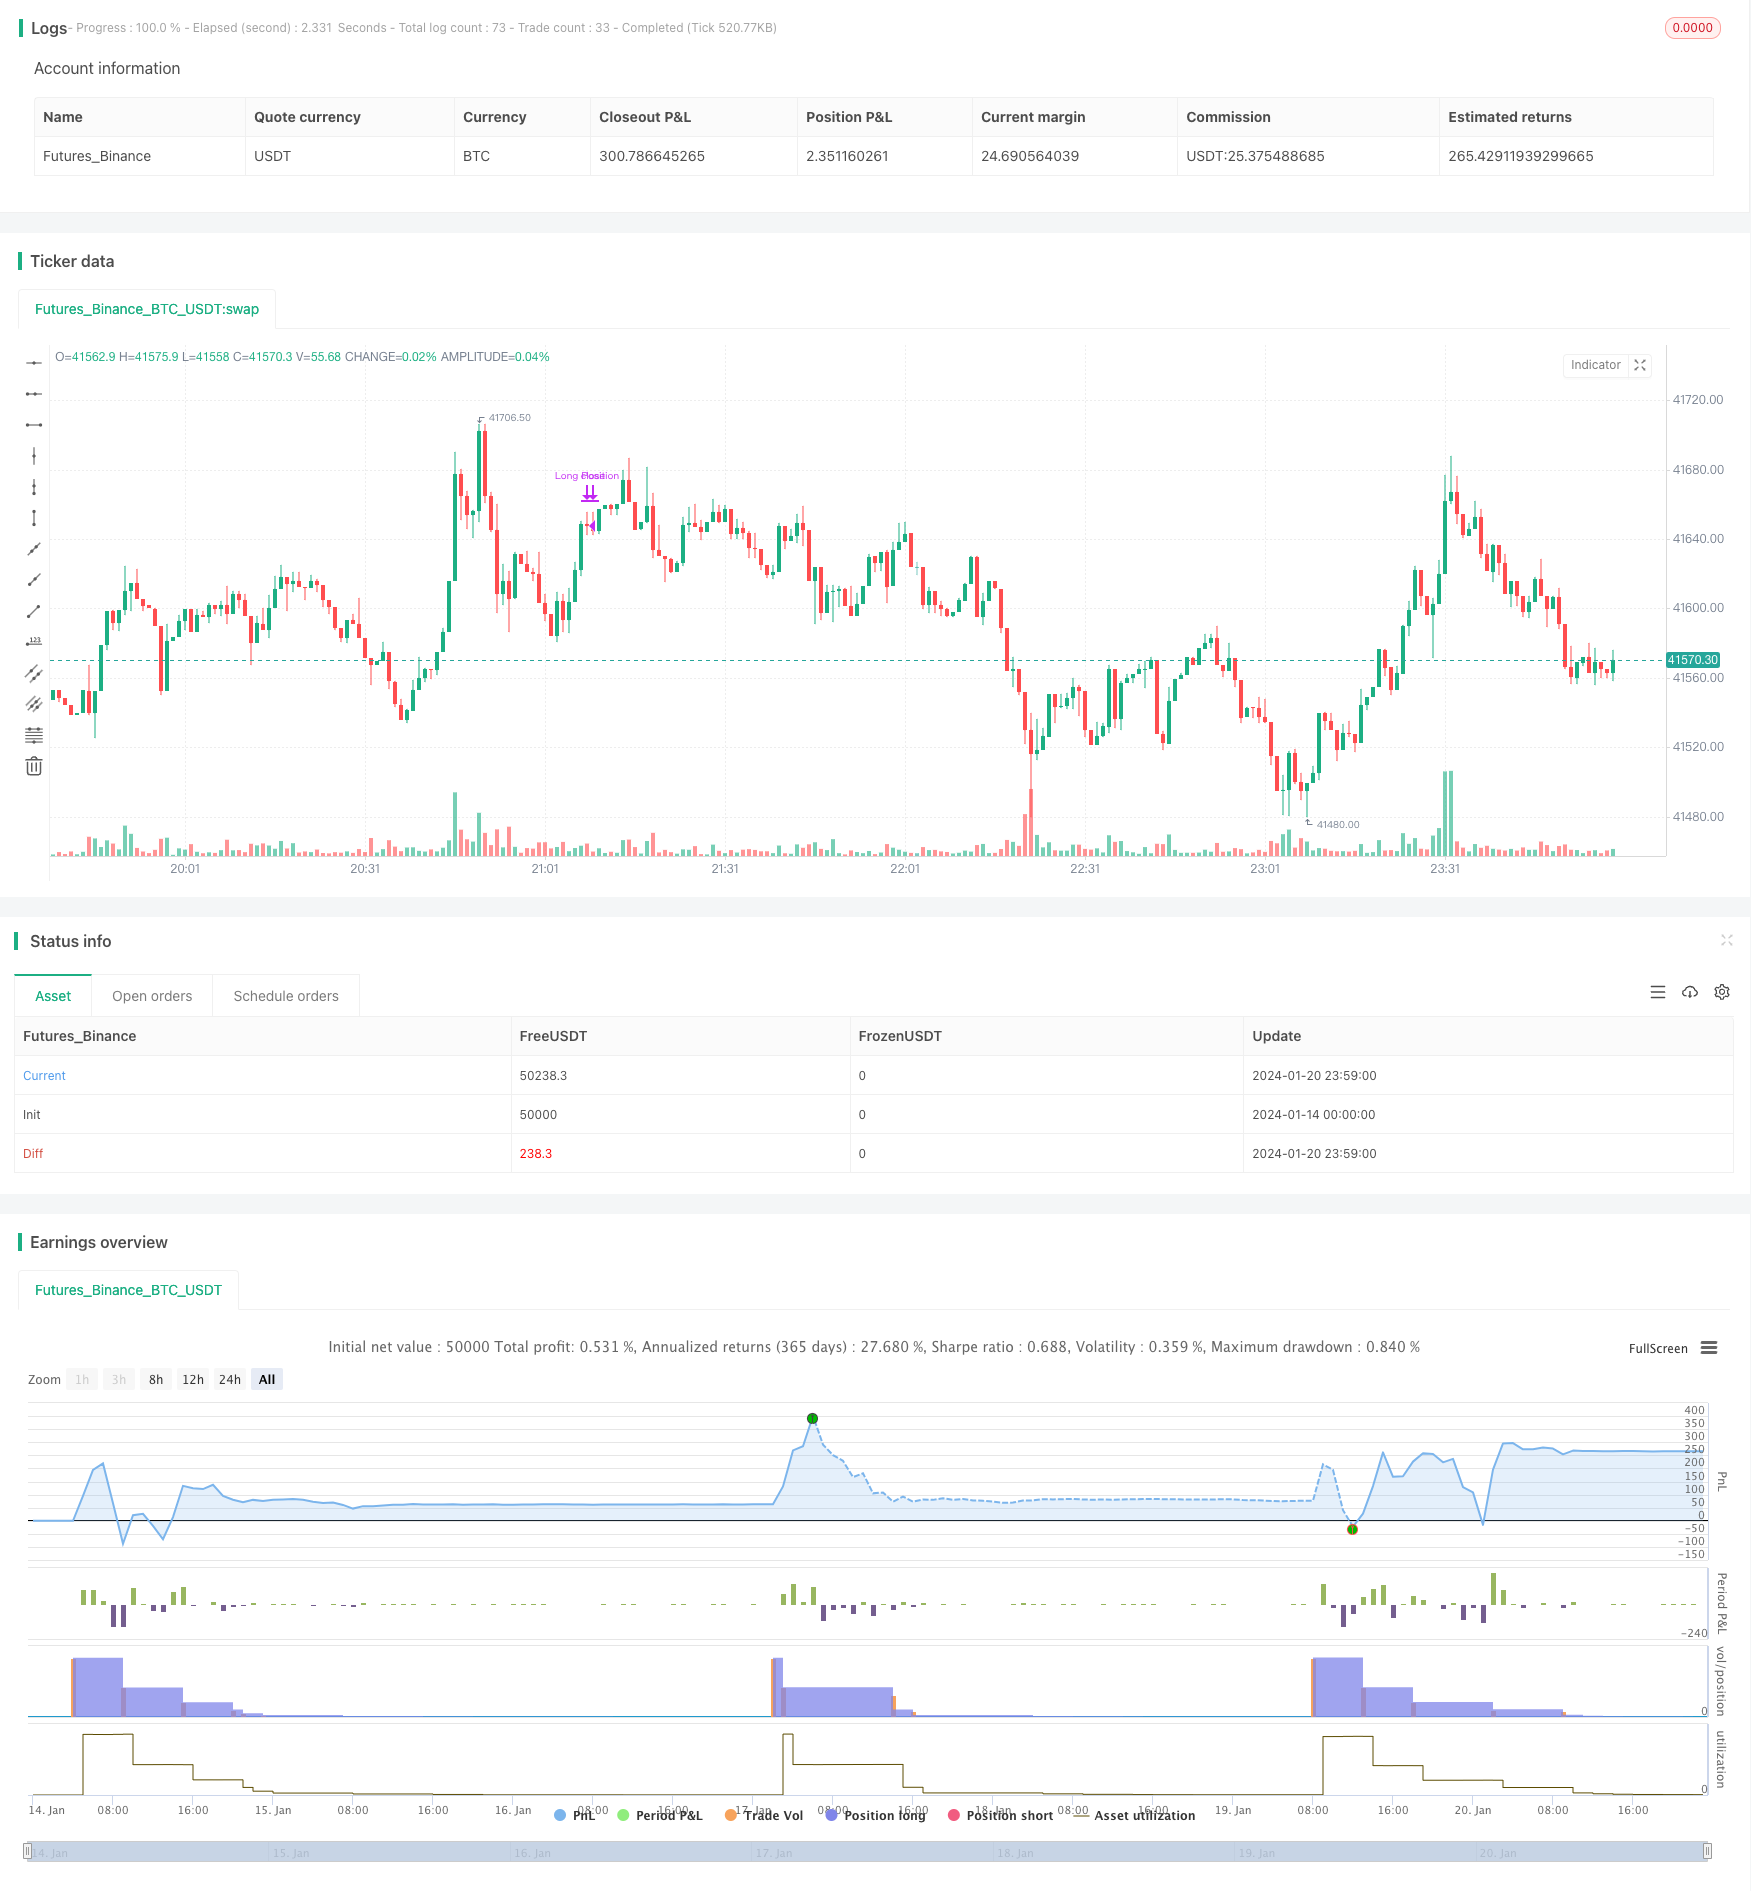
该策略通过结合布林带、随机振荡器和相对强弱指数等多重技术指标,设定买入信号和卖出信号,实现对加密货币等资产的长线追踪操作。策略名称定为“多因子加密货币量化策略”。
策略首先设置布林带、随机振荡器和RSI等指标的计算参数。然后定义买入信号条件为:收盘价低于布林带下轨,K线低于20且高于D线,RSI低于30。当同时满足这三个条件时,进行 longing。定义部分卖出信号为:K线高于70且前一周期低于70(金叉死叉),且存在RSI背离。当满足这两个条件时,平仓50%。
该策略结合多重指标判断市场状况,避免单一指标造成的误判。布林带判断是否处于超跌,随机振荡器判断是否处于超卖,RSI判断是否处于超oversold。多重指标共同作用,可以有效识别市场低谷,精确做多。此外,策略还利用RSI背离来判断潜在趋势反转,防止止损过晚。所以,该策略可以较好地把握低买高卖的机会。
该策略依赖参数优化,如果参数设置不当,将无法正确识别低谷和高峰。此外,指标之间可能存在错误组合的情况。例如布林带识别超跌,但其他指标并未达到相应条件的情况。这些情况都可能导致不必要的亏损。最后,策略并没有考虑最大回撤和仓位管理问题,这也是需要优化的方向。
-
对指标参数进行测试和优化,找到最佳参数组合。
-
增加最大回撤控制,当达到阈值时暂停交易。
-
加入仓位管理模块,根据市场情况动态调整仓位。初期仓位较小,后期可加大仓位。
-
添加止损策略。当市场方向判断错误时,设定合理止损点,控制单笔损失。
该策略整体思路清晰,通过多重指标判断,对低谷高峰的抓取能力较强。但部分参数和模块还有优化空间,适当调整后,可以成为一个稳定收益的量化策略。
||
This strategy combines multiple technical indicators such as Bollinger Bands, Stochastic Oscillator, and Relative Strength Index to set buy and sell signals for long-term trend tracking operations on crypto assets. The strategy is named "Multi-factor Crypto Quantitative Strategy".
The strategy first sets the calculation parameters for indicators like Bollinger Bands, Stochastic Oscillator, and RSI. The buy signal is defined as: close below the Bollinger Lower Band, K line below 20 and above D line, RSI below 30. When all three conditions are met at the same time, go long. The sell signal is partially defined as: K line above 70 and below 70 in the previous period (golden cross dead cross), and there is RSI divergence. When these two conditions are met, close 50% of the position.
This strategy combines multiple indicators to judge the market condition and avoids misjudgment caused by a single indicator. Bollinger Bands to judge whether it is oversold, Stochastic Oscillator to judge whether it is oversold, and RSI to judge whether it is overoversold. The combined effects of multiple indicators can effectively identify market bottoms for accurate long. In addition, the strategy also uses RSI divergence to judge potential trend reversals to avoid late stop loss. Therefore, this strategy can better seize low buy high sell opportunities.
This strategy relies on parameter optimization. If the parameters are set improperly, it will fail to correctly identify bottoms and peaks. In addition, there may be incorrect combinations between indicators. For example, Bollinger Bands identify oversold, but other indicators do not reach the corresponding conditions. All these situations can lead to unnecessary losses. Finally, the strategy does not consider the maximum drawdown and position management, which also needs optimization.
-
Test and optimize indicator parameters to find the best parameter combination.
-
Add maximum drawdown control to pause trading when reaching the threshold.
-
Add a position management module to dynamically adjust positions based on market conditions. The initial position is smaller and can be increased later.
-
Add a stop loss strategy. When the market direction is incorrectly determined, set a reasonable stop loss point to control single loss.
The overall idea of this strategy is clear. Through the judgment of multiple indicators, it has a strong ability to capture bottoms and peaks. But some parameters and modules still have room for optimization. With proper adjustments, it can become a stable profit quantitative strategy.
[/trans]
Source (PineScript)
/*backtest
start: 2024-01-14 00:00:00
end: 2024-01-21 00:00:00
period: 1m
basePeriod: 1m
exchanges: [{"eid":"Futures_Binance","currency":"BTC_USDT"}]
*/

//@version=5
strategy("Stratégie d'Entrée et de Sortie Longue", overlay=true)

// Paramètres des indicateurs
longueurBollinger = 20
stdDevBollinger = 2
longueurStochastic = 14
smoothK = 3
smoothD = 3
longueurRSI = 14

// Bollinger Bands
basis = ta.sma(close, longueurBollinger)
dev = ta.stdev(close, longueurBollinger)
lowerBand = basis - stdDevBollinger * dev

// Stochastic Oscillator
k = ta.sma(ta.stoch(close, high, low, longueurStochastic), smoothK)
d = ta.sma(k, smoothD)

// RSI
rsi = ta.rsi(close, longueurRSI)

// Logique des autres indicateurs (à compléter)

// Conditions d'entrée (à définir)
conditionBollinger = close < lowerBand
conditionStochastic = k < 20 and k > d
conditionRSI = rsi < 30
// Autres conditions (Braid Filter, VolumeBIS, Price Density...)

conditionEntree = conditionBollinger and conditionStochastic and conditionRSI // et autres conditions

// Exécution du trade (entrée)
if (conditionEntree)
    strategy.entry("Long Position", strategy.long)

// Conditions de sortie
stochCrossOver70 = k > 70 and k[1] <= 70

// Simplification de la détection de divergence baissière
// (Cette méthode est basique et devrait être raffinée pour une analyse précise)
highsRising = high > high[1]
lowsRising = low > low[1]
rsiFalling = rsi < rsi[1]
divergenceBearish = highsRising and lowsRising and rsiFalling

// Clôturer la moitié de la position
if (stochCrossOver70 and divergenceBearish)
    strategy.close("Long Position", qty_percent = 50)
Detail
https://www.fmz.com/strategy/439607
Last Modified
2024-01-22 10:40:01