Name
布林带与日内强度指数均值回归策略Bollinger-Band-Mean-Reversion-Strategy-with-Intraday-Intensity-Index
Author
ChaoZhang
Strategy Description
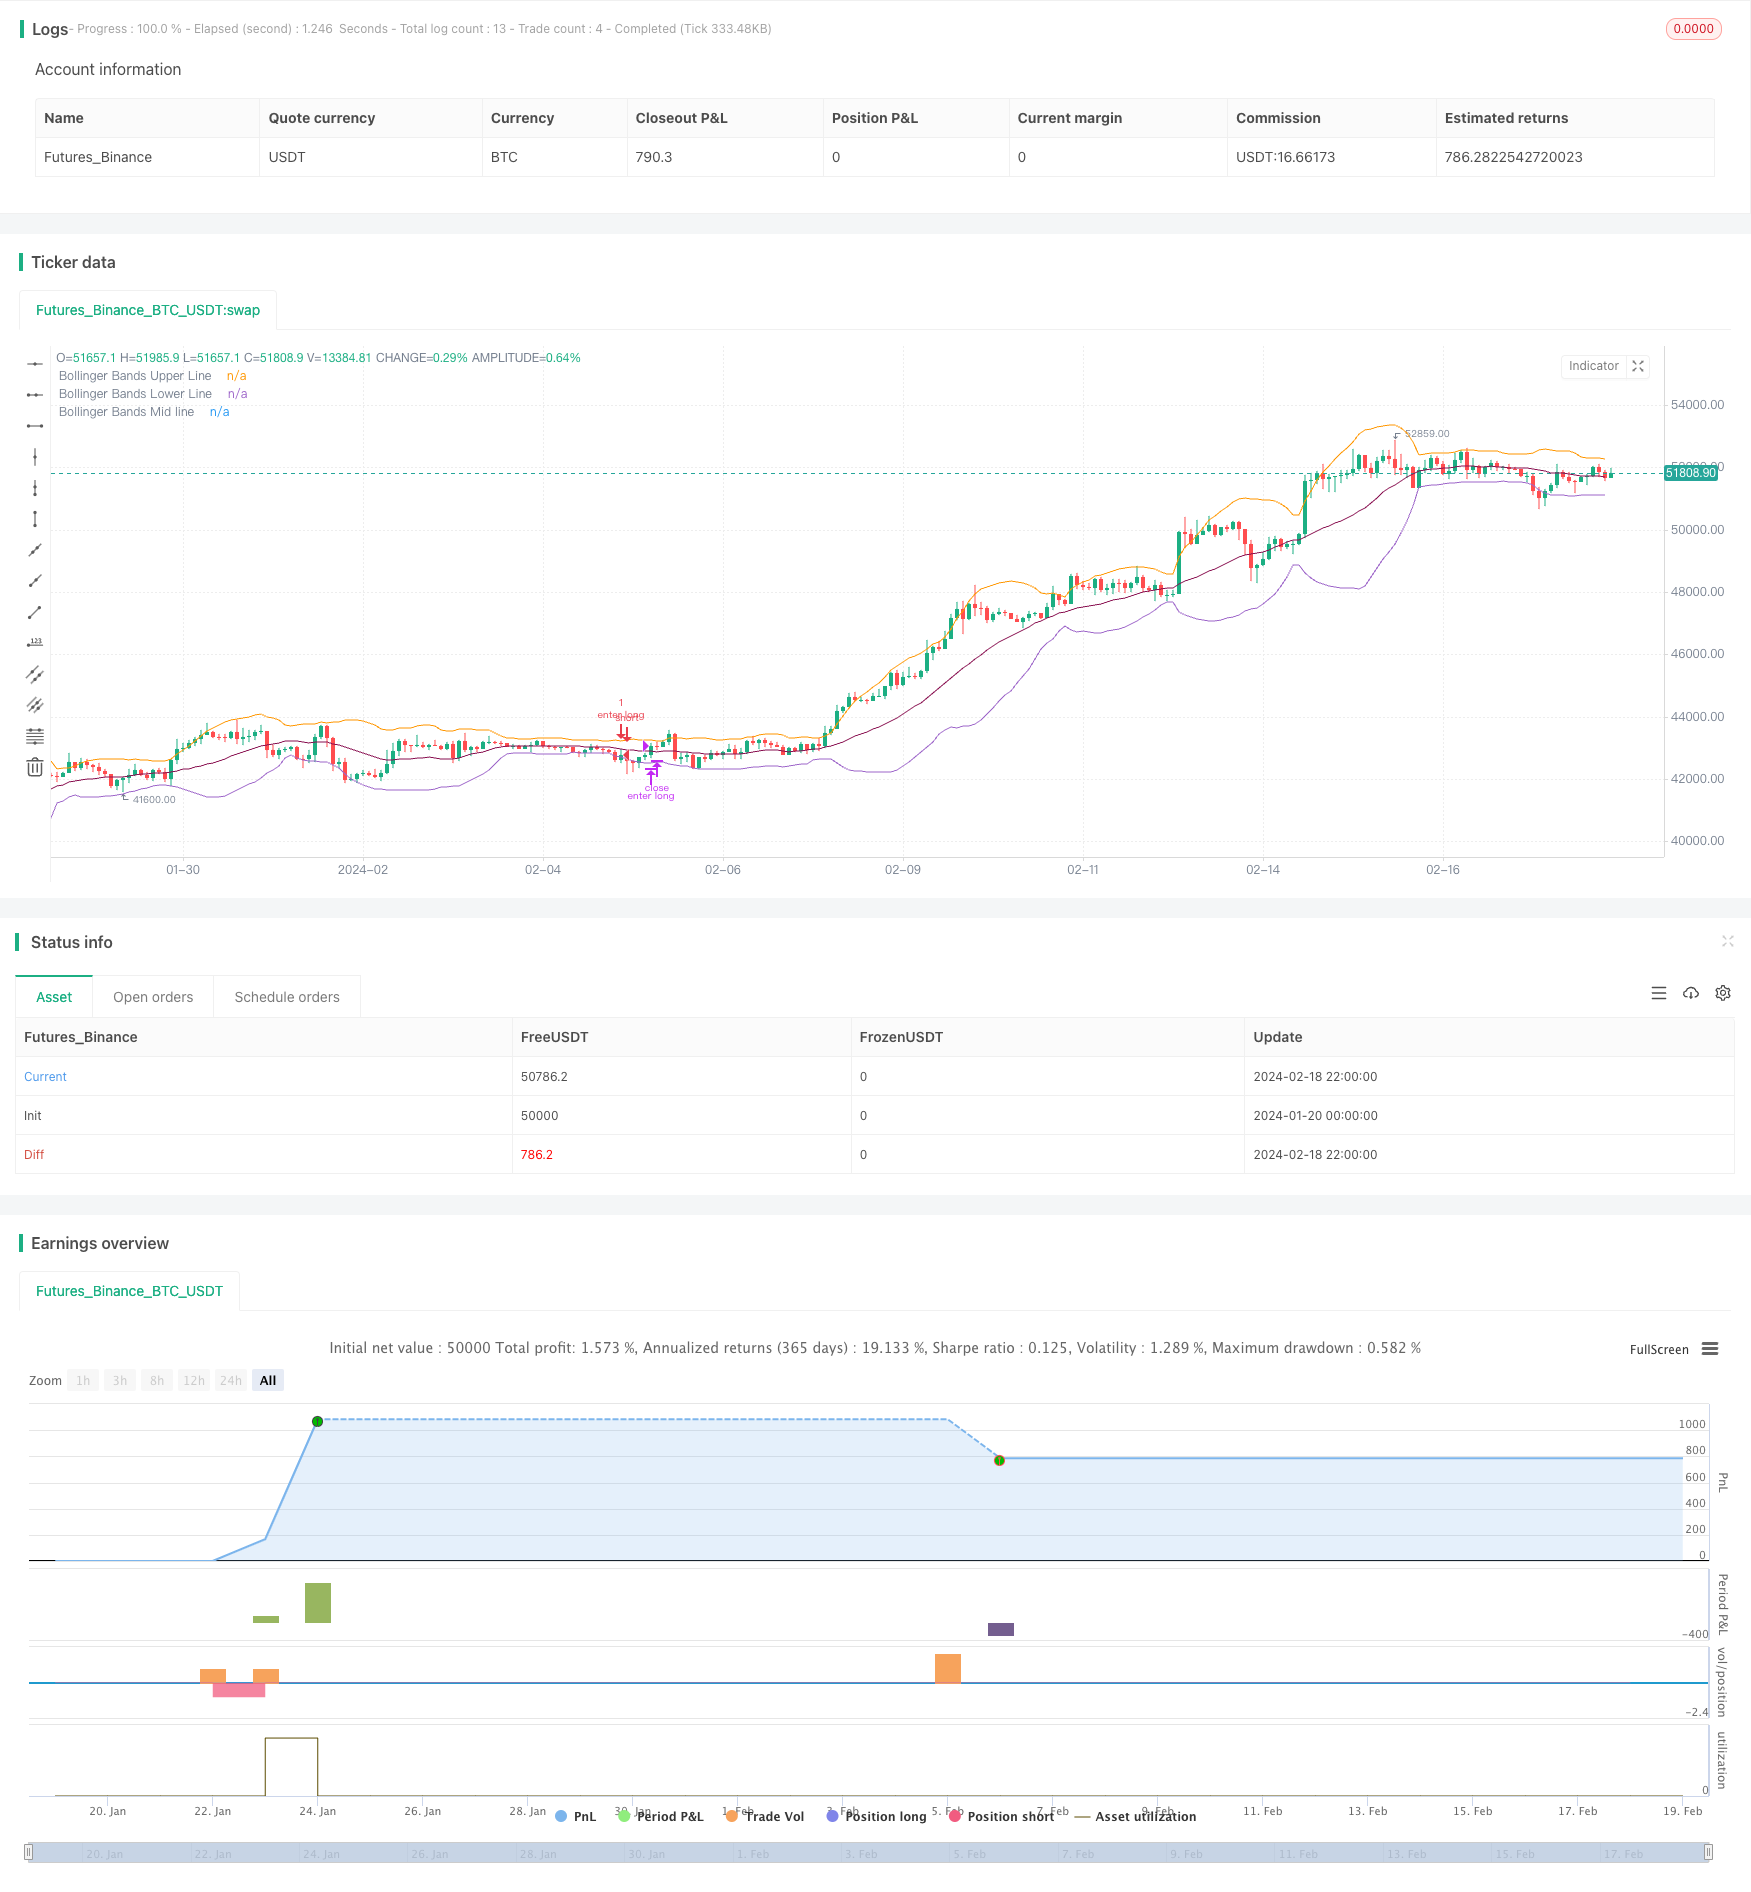
本策略是一个基于布林带和日内强度指数的均值回归策略。它利用价格突破布林带上下轨,结合交易量指标日内强度指数判断进场时机。具有策略优势包括:利用价格平均回归特性获利,结合量能指标过滤信号。但也存在回撤大,获利时间长等风险。
该策略首先计算布林带的中轨、上轨和下轨。中轨为收盘价的简单移动平均线或指数移动平均线。上下轨则通过计算标准差,在中轨上下加减标准差的两倍构建。当价格突破下轨时看做均值回归的机会,采取多仓。当价格突破上轨时,看做价格过度偏离均值,采取空仓。
作为辅助判断指标,策略引入了日内强度指数。该指标结合了价格信息和成交量信息。当指数为正值时表示买入力量增强,作为多仓信号。当指数为负值时,表示卖出力量增强,作为空仓信号。
在开仓方面,策略同时需要价格突破布林带上下轨,和日内强度指数的判断指标。在止损方面,策略采取时间止损,如果超过一定周期后未获利,选择止损退出。
该策略最大的优势在于,利用价格的平均回归特性来获利。当价格出现较大偏离后,依据统计规律,价格向均值中轴回归的概率较大,这为策略的运作提供了理论基础。
另一个优势在于,策略加入了成交量指标–日内强度指数,来过滤价格信号。成交量能证明价格信号的有效性。这避免了在一些价格剧烈震荡而成交量不足的情况下,产生错误信号。
尽管该策略依赖价格平均回归这一概率事件来获利,但市场价格的随机游走也可能导致止损被触发,从而亏损。这是均值回归策略普遍面临的风险。
另一个主要风险在于,价格向均值回归本身是一个时间周期较长的过程。对投资者而言,资金可能会被套牢一段时间。这种时间风险可能导致投资者失去其他更佳投资机会。
该策略可以从以下几个方面进行优化:
-
优化布林带参数,调整周期,标准差指标来适应不同市场的波动环境
-
尝试其他型的移动平均线,如线性加权移动平均线来提高平滑性
-
尝试其他型的成交量指标,寻找更好的量价确认信号
-
加入止损止盈策略,控制单个订单的最大损失
本策略整体是一个典型的均值回归策略。依赖概率事件来获利,但风险也同样明显。通过参数调整,指标优化都可能获得更佳结果。但对投资者而言,正确把握这个策略的属性也是关键。
||
This strategy is a mean reversion strategy based on Bollinger Bands and Intraday Intensity Index. It utilizes the price breakouts of Bollinger Bands upper and lower band, combined with the volume indicator Intraday Intensity Index to determine the entry timing. The advantages of this strategy include: gaining profits from the mean reversion of prices, and filtering signals with volume indicators. However, it also has risks like large drawdowns and long profit time.
The strategy first calculates the middle band, upper band and lower band of Bollinger Bands. The middle band is the simple moving average or exponential moving average of the closing price. The upper and lower bands are constructed by adding/subtracting two standard deviations on the middle band. When price breaks through the lower band, it is considered an opportunity for mean reversion, taking long position. When price breaks through upper band, it is considered over-deviation from mean, taking short position.
As an assisted indicator for judgement, the strategy introduces Intraday Intensity Index. This indicator combines both price and volume information. When the index is positive, it indicates the buying power is strengthening, giving long signal. When the index is negative, it indicates selling power is strengthening, giving short signal.
For opening positions, the strategy requires both price breakout of Bollinger Bands band and the Intraday Intensity Index indicator judgement. For stop loss, the strategy adopts time based stop loss. If no profits after certain periods, the strategy chooses to cut loss and exit.
The biggest advantage of this strategy is utilizing the mean reversion of prices to profit. When prices have large deviations from mean, according to statistical laws, the probability prices revert back to mean is relatively large. This provides the theoretical basis for the strategy's operations.
Another advantage is the introduction of volume indicator - Intraday Intensity Index, to filter price signals. Trading volumes can prove the validity of price signals. This avoids the wrong signals generated in some violent price fluctuations with low volumes.
Although this strategy relies on the probability event of price mean reversions, the random walk of market prices can still trigger stop loss, leading to losses. This is a common risk faced by mean reversion strategies.
Another major risk is that the process of prices reverting to mean itself is a relatively long cycle. For investors, capital may be held for some period of time. Such time risk may cause investors to miss other better investment opportunities.
The strategy can be optimized in the following aspects:
-
Optimize Bollinger Bands parameters, adjust cycle and deviation metrics to adapt to volatility of different markets
-
Try other types of moving averages, like weighted moving average to increase smoothness
-
Try other types of volume indicators, searching for better volume-price confirmation signals
-
Add stop loss/profit taking strategies, control max loss per order
In conclusion, this strategy is a typical mean reversion strategy. It profits on probability events, but the risks are obvious as well. Better results may be obtained through adjustments of parameters and optimizations of indicators. But for investors, recognizing the attributes correctly of this strategy is also the key.
[/trans]
Strategy Arguments
| Argument | Default | Description |
|---|---|---|
| v_input_1 | 20 | Bollinger Bands length |
| v_input_2 | 0 | Bollinger Bands MA type: SMA |
| v_input_3_close | 0 | source: close |
| v_input_4 | 10 | Time-based stop length |
| v_input_5 | 2 | Bollinger Bands Standard Deviation |
| v_input_6 | true | with Intraday Intensity Index? |
| v_input_7 | 21 | Intraday Intensity Index length |
Source (PineScript)
/*backtest
start: 2024-01-20 00:00:00
end: 2024-02-19 00:00:00
period: 2h
basePeriod: 15m
exchanges: [{"eid":"Futures_Binance","currency":"BTC_USDT"}]
*/

//@version=4
// This source code is subject to the terms of the Mozilla Public License 2.0 at https://mozilla.org/MPL/2.0/

// Bollinger Bands Strategy with Intraday Intensity Index
// by SparkyFlary

//For Educational Purposes
//Results can differ on different markets and can fail at any time. Profit is not guaranteed.
strategy(title="Bollinger Bands Strategy with Intraday Intensity Index", shorttitle="Bollinger Bands Strategy", overlay=true)

BBlength = input(20, title="Bollinger Bands length")
BBmaType = input("SMA", title="Bollinger Bands MA type", type=input.string, options=["SMA", "EMA"])
BBprice = input(close, title="source")
timeStop = input(10, title="Time-based stop length")
BBmult = input(2.0, title="Bollinger Bands Standard Deviation")
withIII = input(true, title="with Intraday Intensity Index?")
IIIlength = input(21, title="Intraday Intensity Index length")

//function for choosing moving averages
f_ma(type, src, len) =>
    float result = 0
    if type == "SMA"
        result := sma(src, len)
    if type == "EMA"
        result := ema(src, len)
    result

//Intraday Intensity Index
k1 = (2 * close - high - low) * volume
k2 = high != low ? high - low : 1
i = k1 / k2
iSum = sum(i, IIIlength)

//Bollinger Bands
BBbasis = f_ma(BBmaType, BBprice, BBlength)
BBdev = BBmult * stdev(BBprice, BBlength)
BBupper = BBbasis + BBdev
BBlower = BBbasis - BBdev

plot(BBupper, title="Bollinger Bands Upper Line")
plot(BBlower, title="Bollinger Bands Lower Line")
plot(BBbasis, title="Bollinger Bands Mid line", color=color.maroon)

//Strategy
buy = close[1]<BBlower[1] and close>BBlower and (withIII ? iSum>0 : 1)
sell = close>BBbasis or buy[timeStop] or (strategy.openprofit>0 and buy==0 and buy[1]==0 and buy[2]==0 and buy[3]==0)
short = close[1]>BBupper[1] and close<BBupper and (withIII ? iSum<0 : 1)
cover = close<BBbasis or short[timeStop] or (strategy.openprofit>0 and short==0 and short[1]==0 and short[2]==0 and short[3]==0)

strategy.entry(id="enter long", long=true, when=buy)
strategy.close(id="enter long", comment="exit long", when=sell)
strategy.entry(id="enter short", long=false, when=short)
strategy.close(id="enter short", comment="exit short", when=cover)
Detail
https://www.fmz.com/strategy/442246
Last Modified
2024-02-20 15:07:59