Name
布林带RSIEMA双重交易策略Bollinger-Bands-RSI-EMA-Double-Trading-Strategy
Author
ChaoZhang
Strategy Description
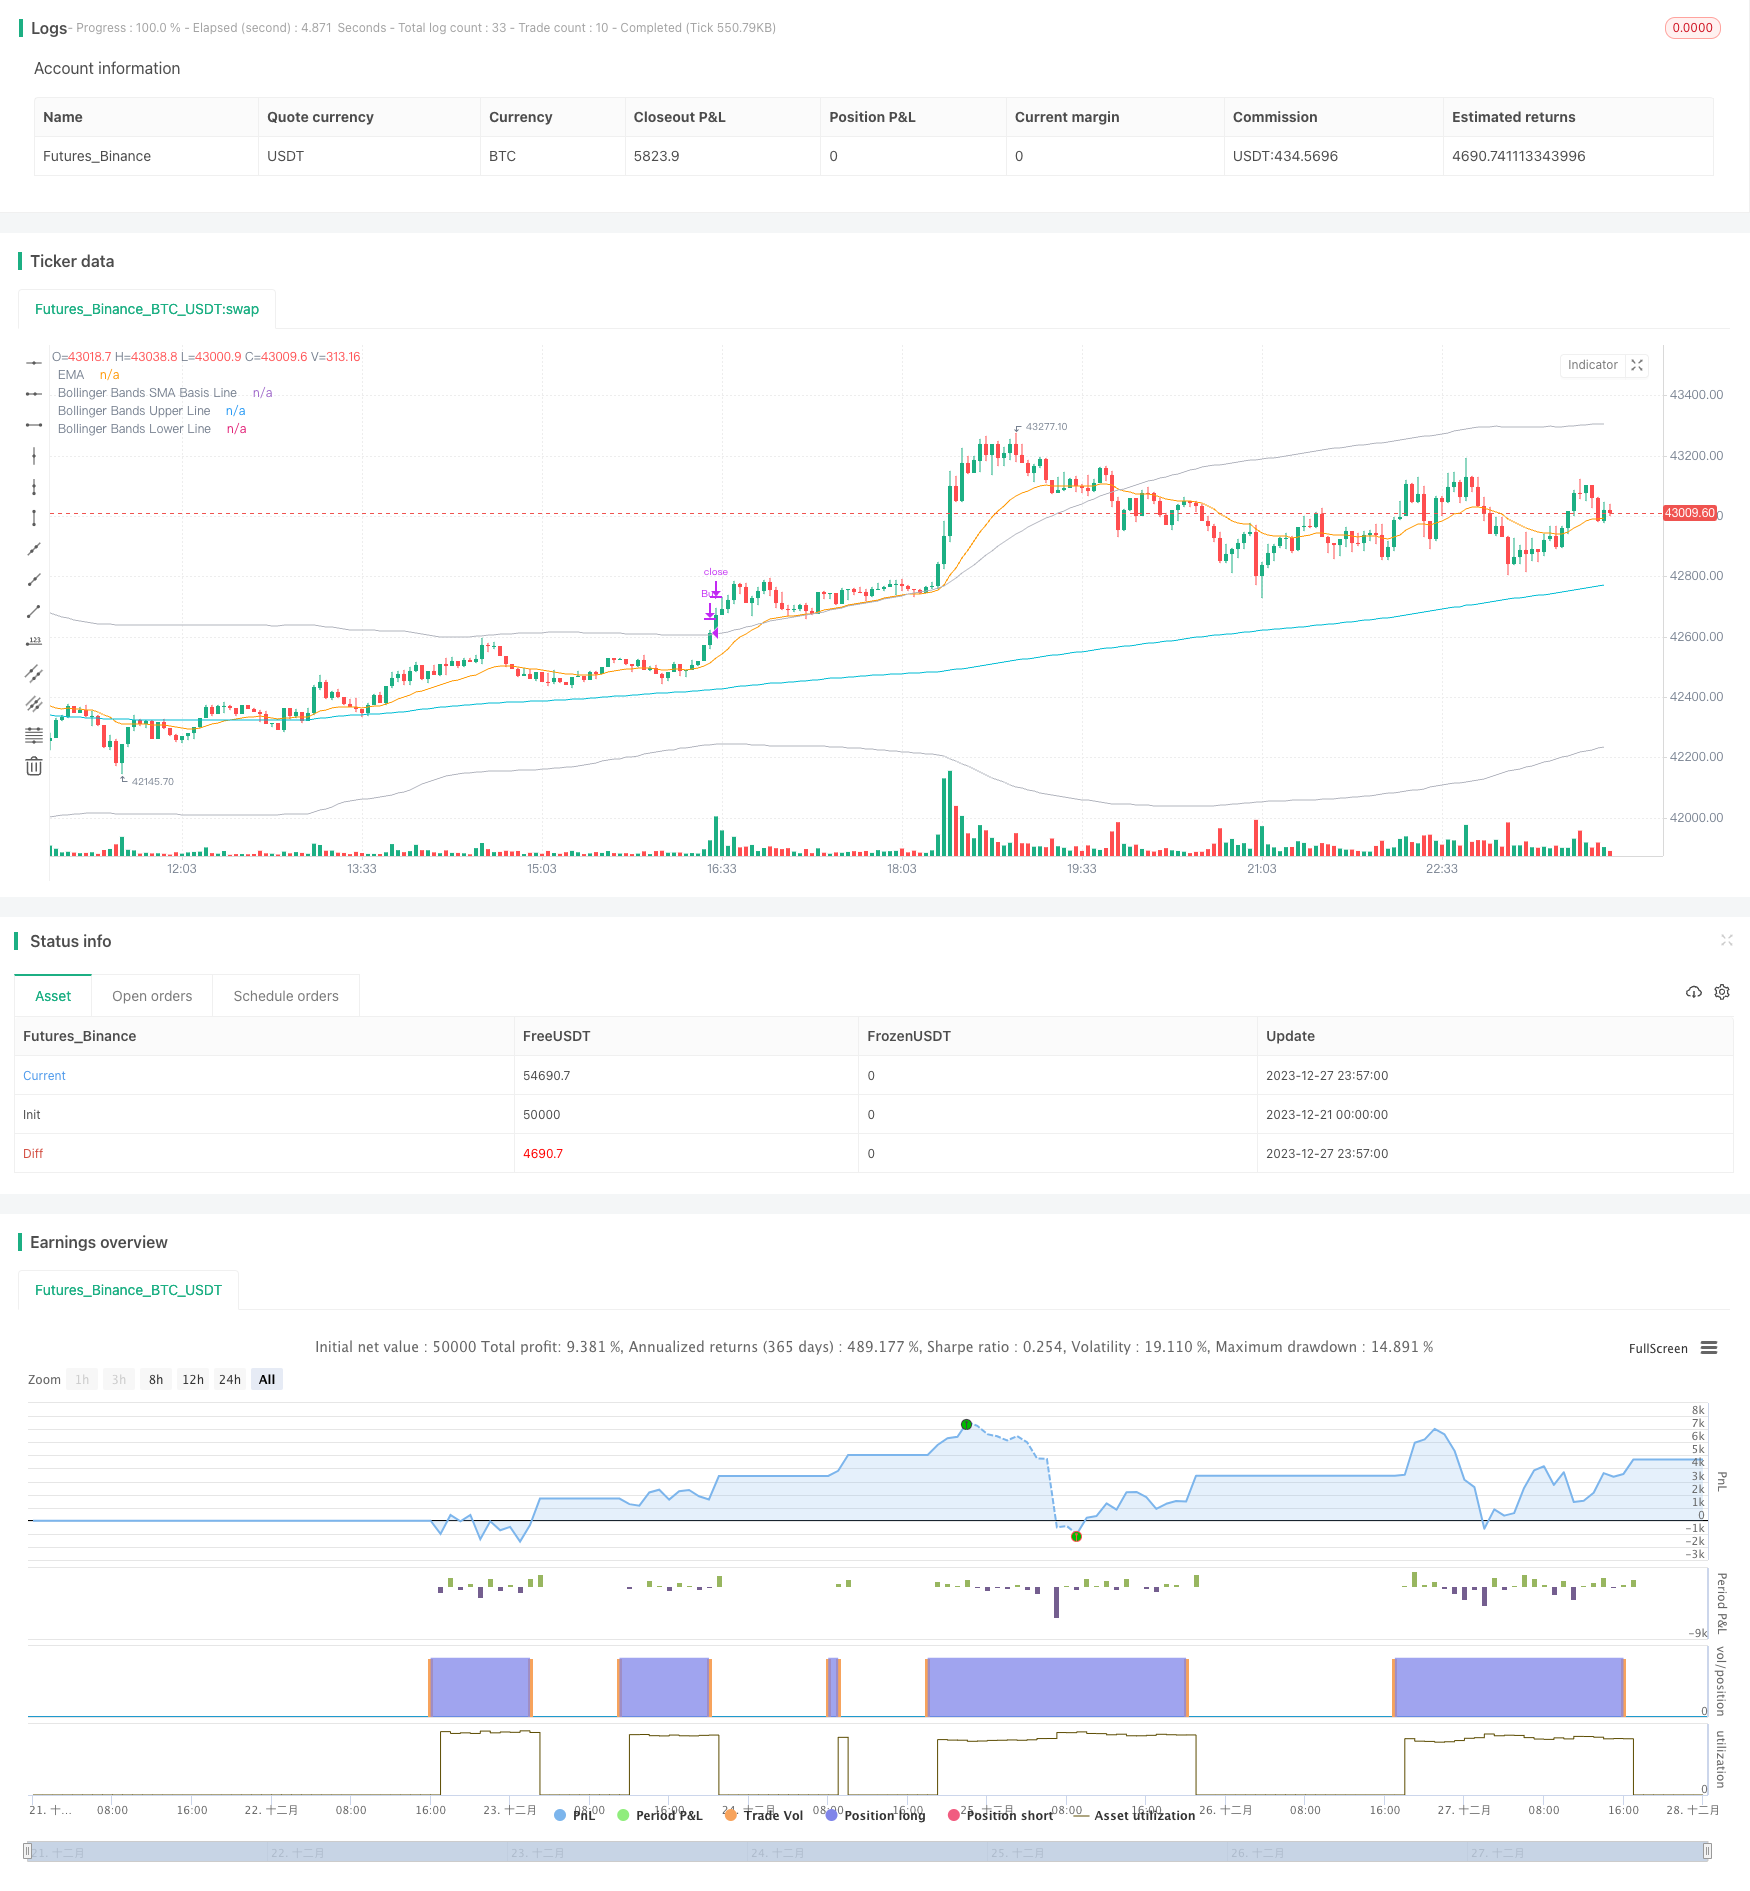
本策略集成了布林带、相对强弱指数(RSI)和指数移动平均线(EMA)三个指标,实现了一个长线持有的股票自动交易策略。当RSI低于超卖线且价格接近或触及布林带下轨时产生买入信号;当价格上涨触及布林带上轨时产生卖出信号,实现了利用布林带判断市场趋势和超买超卖的双重过滤。
本策略主要基于布林带、RSI和EMA三个指标进行判断。布林带中的中轨线是价格的简单移动平均线,上下轨线分别是价格标准差的两倍范围。布林带能够判断市场的超买超卖现象,价格接近下轨时为超卖现象,接近上轨时为超买现象。RSI指标判断股票是否超买超卖的重要指标之一,RSI低于30时为超卖,高于70时为超买。而EMA是价格的指数加权移动平均线,能够判断价格趋势。
本策略的买入条件为:RSI指标低于30的超卖线时产生买入信号,且需要同时满足价格已经接近或触及布林带下轨的超卖状态,这样可以避免假信号。
本策略的卖出条件为:价格上涨期间,当触及布林带上轨时产生卖出信号,comboBox1。这样利用布林带判断超买状态,进行止盈卖出。
- 集成布林带和RSI指标,双重过滤判断超买超卖状态,避免假信号。
- 利用EMA判断价格趋势方向,避免逆势交易。
- RSI参数和布林带参数都可以自定义设置,适用于不同股票。
- 策略逻辑简单清晰,容易理解实现。
- 布林带和RSI都可能产生错误信号,导致错误买入。
- 止损位置设置需要优化,回撤风险较大。
- EMA不能完美判断趋势,可能错过趋势反转点。
- 参数设置不当可能导致过于频繁交易或错过交易机会。
风险解决方法:
- 适当缩短布林带周期,优化RSI参数。
- 动态追踪止损。
- 集成其他指标判断趋势。
- 测试不同参数设置,寻找最优参数组合。
本策略可以从以下几个方向进一步优化:
- 增加其他指标判断,如KD指标判断超买超卖。
- 增加止损策略,如移动止损、区间止损等方式管理风险。
- 在卖出条件中增加离场策略,如根据EMA判断趋势离场。
- 优化参数设置,改进获利空间,如调整布林带宽度。
- 增加开仓规则,避免假突破,如量能过滤。
本策略集成布林带、RSI和EMA三个指标,实现了一个双重过滤判断的长线持有自动交易策略。判断超买超卖状态的双重过滤机制可以有效避免假信号,利用EMA判断趋势可以避免逆势交易。同时策略参数可以灵活设置,适用于不同股票,是一个简单实用的量化交易策略。通过优化止损策略、离场规则等,可以进一步提高策略效率和减少回撤风险。本策略为初学者提供了一个参考框架,有一定实用价值。
||
This strategy integrates Bollinger Bands, Relative Strength Index (RSI) and Exponential Moving Average (EMA) three indicators to implement an automatic trading strategy with long holding periods for stocks. It generates buy signals when RSI is below oversold line and price is close to or touches the Bollinger Bands lower rail, and generates sell signals when price rises to touch the Bollinger Bands upper rail, utilizing Bollinger Bands to determine market trends and overbought/oversold status for double confirmation.
This strategy mainly judges based on Bollinger Bands, RSI and EMA three indicators. The middle rail in Bollinger Bands is the simple moving average of price, and the upper and lower rails are two standard deviation ranges of price. Bollinger Bands can judge the overbought/oversold status of the market. When price is close to the lower rail, it indicates oversold status, and when price is close to the upper rail, it indicates overbought status. RSI is one of the important indicators to judge whether a stock is overbought or oversold. RSI below 30 indicates oversold status and RSI above 70 indicates overbought status. EMA is the exponential weighted moving average of price and can determine price trend.
The buy signal for this strategy is generated when RSI is below the 30 oversold line, and at the same time price has approached or touched the Bollinger Bands lower rail in oversold status. This avoids false signals.
The sell signal is generated when price touches the Bollinger Bands upper rail during an uptrend. This utilizes Bollinger Bands to determine overbought status and sells for profit taking.
- Integrates Bollinger Bands and RSI to double confirm overbought/oversold status, avoiding false signals.
- Utilizes EMA to determine price trend direction, avoiding trading against the trend.
- Parameters for both RSI and Bollinger Bands can be customized for different stocks.
- Simple and clear strategy logic, easy to understand and implement.
- Both Bollinger Bands and RSI may generate false signals, causing wrong entries.
- Stop loss position needs further optimization, with higher retracement risks.
- EMA may fail to perfectly determine trend with missed trend reversal points.
- Inappropriate parameter settings may lead to over-trading or missing trading opportunities.
Solutions:
- Shorten Bollinger Bands period, optimize RSI parameters.
- Dynamic trailing stop loss.
- Integrate other indicators for trend determination.
- Test different parameter settings to find optimum combination.
The strategy can be further optimized in the following aspects:
- Add more indicators for judgement, e.g. KD for overbought/oversold status.
- Add stop loss mechanisms like moving stop loss, zone stop loss to manage risks.
- Add exit rules based on EMA trend determination in selling conditions.
- Optimize parameter settings to expand profit range, e.g. adjust Bollinger Bands width.
- Add entry rules to avoid false breakouts, e.g. volume filters.
The strategy integrates Bollinger Bands, RSI and EMA for a long holding automatic trading strategy with double confirmation filters. The double confirmation for overbought/oversold status avoids false signals effectively, and using EMA for trend determination prevents trading against the trend. Meanwhile, flexible parameter settings make it adaptable to different stocks. Further improvement in aspects of stop loss and exit mechanisms can enhance the strategy's efficiency and risk management. The strategy provides a valuable reference framework for beginners and has practical significance.
[/trans]
Strategy Arguments
| Argument | Default | Description |
|---|---|---|
| v_input_1 | 2 | RSI Period Length |
| v_input_2 | 30 | RSI Oversold Level |
| v_input_3 | 80 | RSI Overbought Level |
| v_input_4 | 231 | Bollinger Period Length |
| v_input_5 | true | Use EMA? |
| v_input_6 | 20 | EMA Period Length |
Source (PineScript)
/*backtest
start: 2023-12-21 00:00:00
end: 2023-12-28 00:00:00
period: 3m
basePeriod: 1m
exchanges: [{"eid":"Futures_Binance","currency":"BTC_USDT"}]
*/

//@version=4
strategy("Bollinger + RSI + EMA, Double Strategy Long-Only (by ChartArt) v1.3", shorttitle="rsi 30 min ADJ Buy", overlay=true)

///////////// RSI
RSIlength = input(2, title="RSI Period Length") // Adjusted RSI period length
RSIoverSold = input(30, title="RSI Oversold Level")  // Adjustable RSI oversold level
RSIoverBought = input(80, title="RSI Overbought Level")  // Adjustable RSI overbought level
price = close
vrsi = rsi(price, RSIlength)

///////////// Bollinger Bands
BBlength = input(231, minval=1, title="Bollinger Period Length") // Adjusted Bollinger period length
BBmult = 2
BBbasis = sma(price, BBlength)
BBdev = BBmult * stdev(price, BBlength)
BBupper = BBbasis + BBdev
BBlower = BBbasis - BBdev

///////////// EMA
useEMA = input(true, title="Use EMA?")
emaLength = input(20, title="EMA Period Length")
ema = useEMA ? ema(close, emaLength) : na

source = close
buyEntry = crossover(source, BBlower) or (close < BBlower and close > BBbasis) or (low < BBlower and close > BBbasis) // Add condition for low touching Bollinger Band
sellEntry = crossunder(source, BBupper)

///////////// Plotting
plot(BBbasis, color=color.aqua, title="Bollinger Bands SMA Basis Line")
plot(BBupper, color=color.silver, title="Bollinger Bands Upper Line")
plot(BBlower, color=color.silver, title="Bollinger Bands Lower Line")
plot(ema, color=color.orange, title="EMA")  // Plot EMA

///////////// RSI + Bollinger Bands Strategy
long = crossover(vrsi, RSIoverSold) and buyEntry
close_long = close >= BBupper

if (not na(vrsi))
    if long
        strategy.entry("Buy", strategy.long, qty=10, stop=BBlower, comment="Buy")
    else
        strategy.cancel(id="Buy")

    if close_long
        strategy.close("Buy")
Detail
https://www.fmz.com/strategy/437009
Last Modified
2023-12-29 14:46:57