Name
快速EMA和慢速EMA动量突破策略fast-EMA-and-slow-EMA-Momentum-Breakthrough-Strategy
Author
ChaoZhang
Strategy Description
这个策略通过计算快速EMA和慢速EMA,并在快速EMA上穿慢速EMA时做多,在快速EMA下穿慢速EMA时做空,实现获利。该策略属于动量跟踪类策略。
该策略主要是利用EMA指标的 organisations 概念。EMA即指数移动平均线,它是根据历史价格走势来预测未来价格走势的技术指标。EMA指标分为快线和慢线,快线对最近价格变化更敏感,慢线对历史价格变化更敏感。当短期价格变化超过一定幅度时,快线会上穿或下穿慢线,产生买入或卖出信号。
具体来说,该策略选取长度为37的EMA作为快线,长度为175的EMA作为慢线。当快线上穿慢线时产生买入信号,做多;当快线下穿慢线时产生卖出信号,做空。做多后通过慢线下穿快线的方式来实现止损或止盈。
这种EMA交叉策略具有如下优势:
- 原理简单,容易理解实现
- 能够有效捕捉市场中的短期趋势
- 回撤风险较 contro 为低
- 可通过调整EMA周期来适应不同品种
该策略也存在一些潜在风险:
- 容易产生假信号,可能入场过早或过晚
- EMA指标滞后,可能错过关键转折点
- 震荡行情中容易止损
- 回测数据拟合风险,实盘实施效果存疑
为降低这些风险,可以考虑优化入场时机选择,设置止损位置,结合其他指标进行过滤等。
该策略还有进一步优化的空间:
- 优化EMA周期参数,适应不同品种特性
- 增加成交量指标过滤,避免在震荡行情中错入
- 设置移动止损,根据趋势逐步调整止损位置
- 结合波动率指标,根据市场波动度动态调整仓位
该EMA交叉策略整体来说较为简单直接,适合初学者掌握。但其实盘效果还需要实际验证,投资者在使用时也需要注意防范回测过拟合的风险。通过参数优化、指标组合等方式还可以进一步增强该策略的稳定性和实战效果。
||
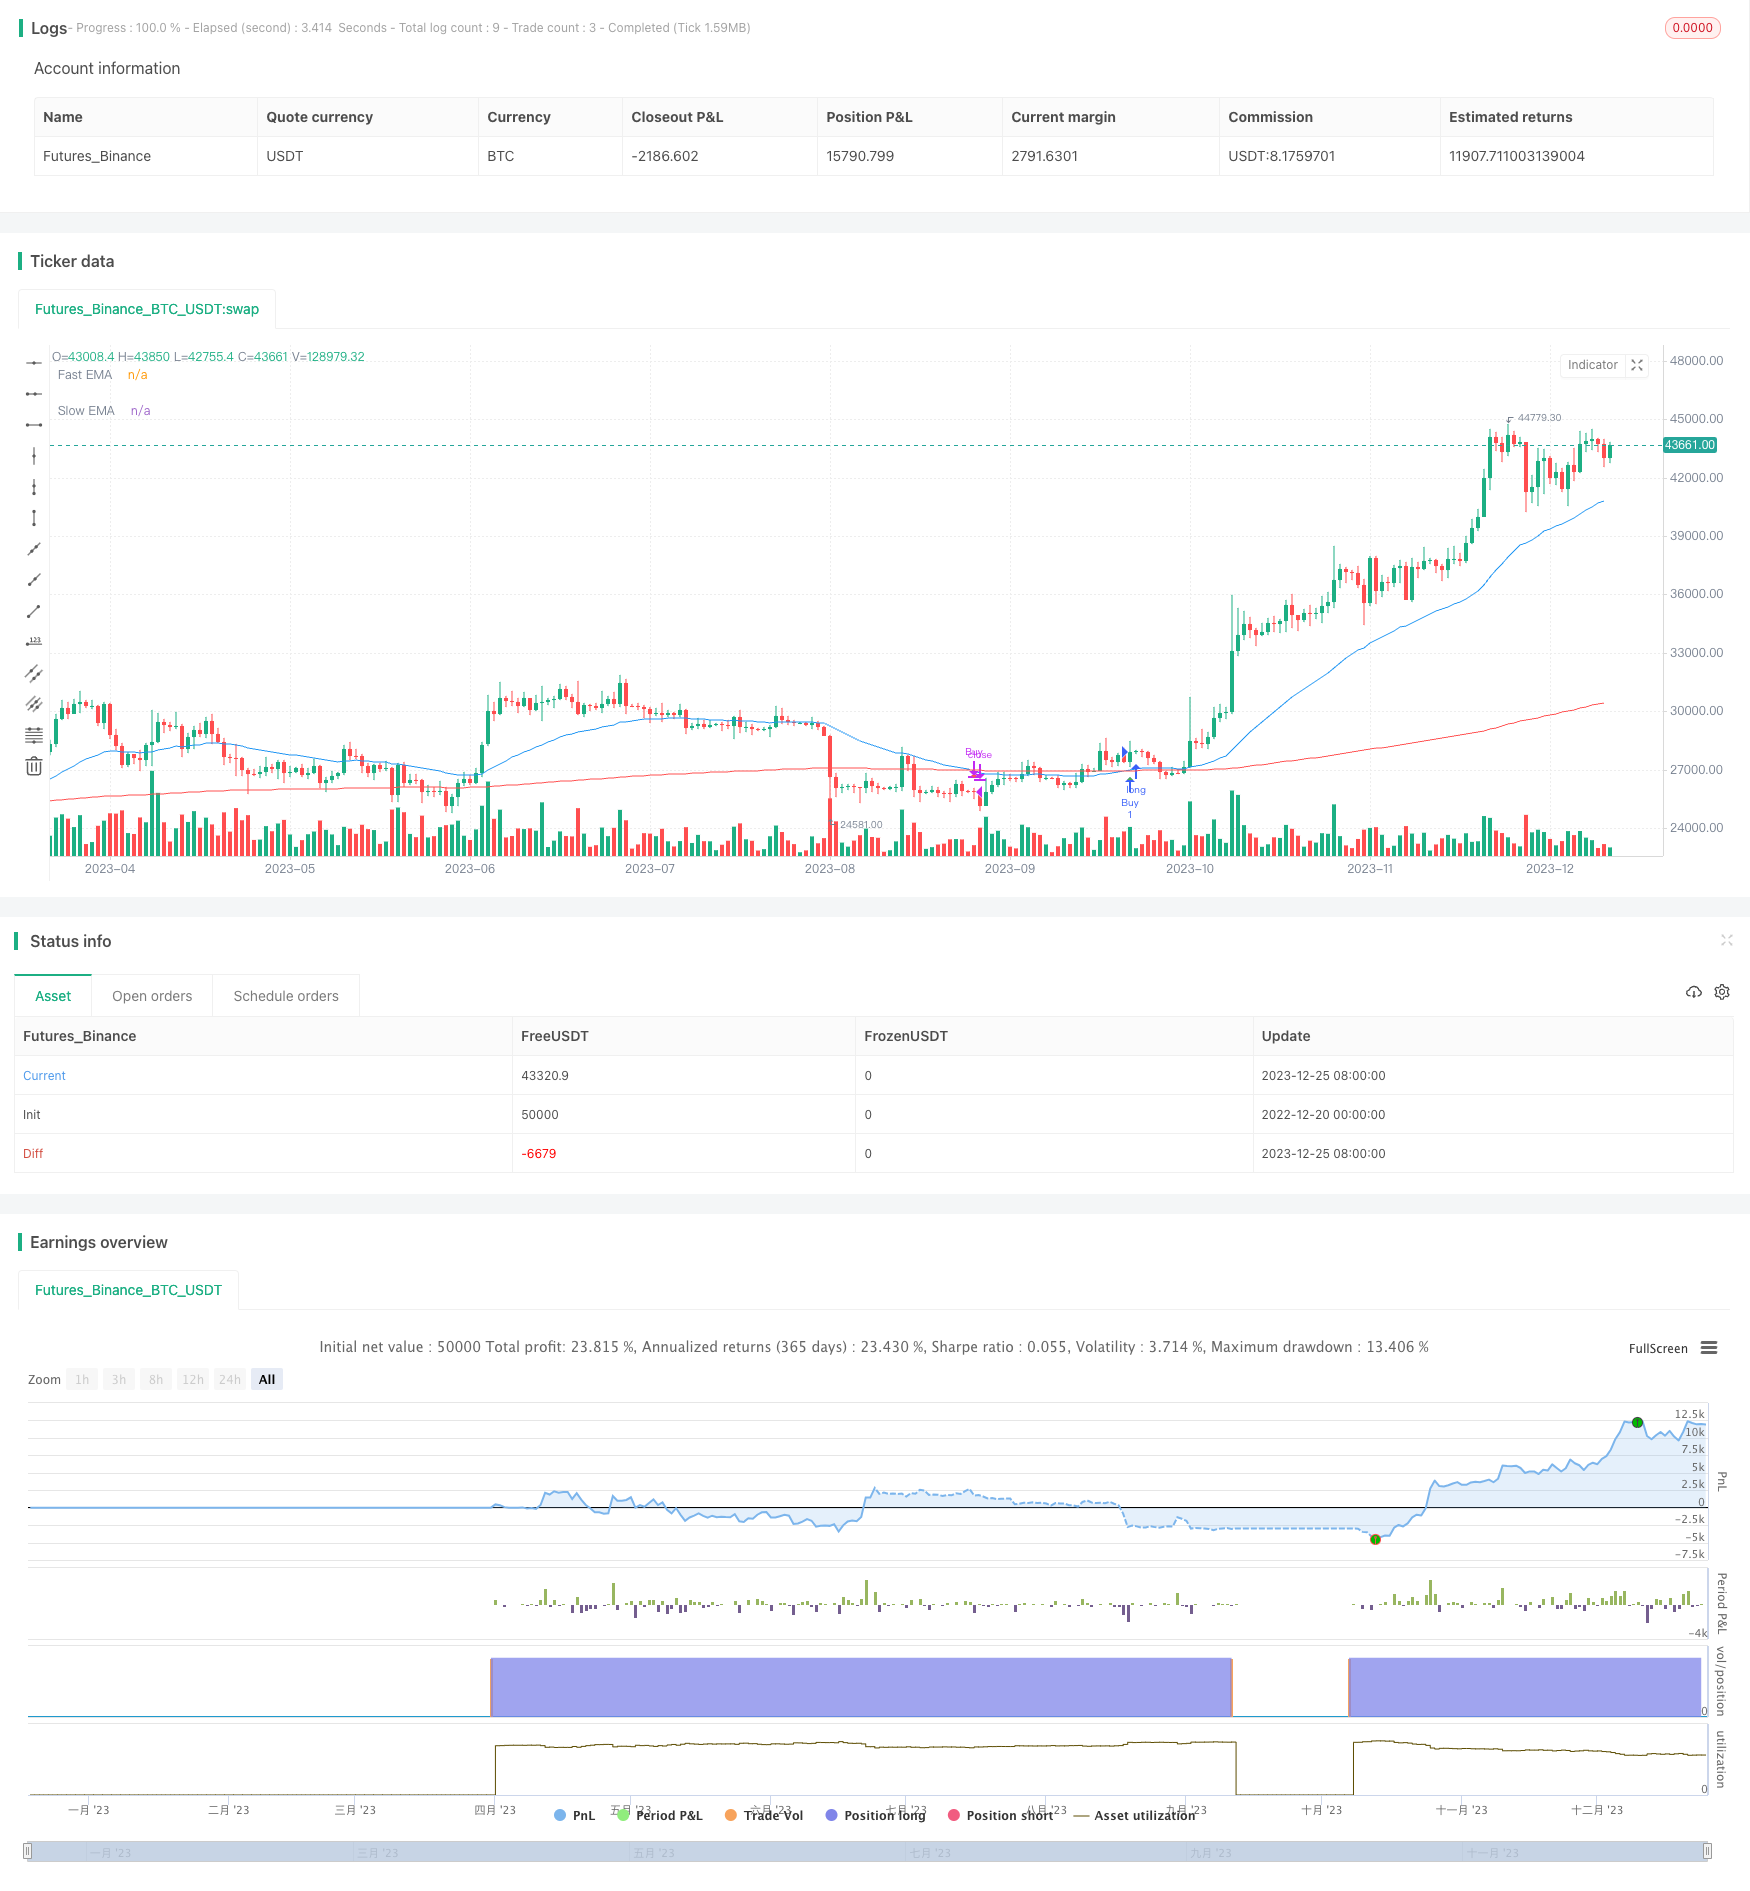
This strategy generates buy and sell signals by calculating fast EMA and slow EMA, and going long when the fast EMA crosses above the slow EMA, and going short when the fast EMA crosses below the slow EMA to make profits. This strategy belongs to momentum tracking strategy.
This strategy mainly utilizes the smoothing concept of the EMA indicator. EMA stands for Exponential Moving Average, which is a technical indicator that uses historical price trends to predict future price trends. The EMA indicator consists of a fast line and a slow line, where the fast line is more sensitive to recent price changes and the slow line is more sensitive to historical price changes. When short-term price fluctuations exceed a certain level, the fast line will cross above or below the slow line, generating buy or sell signals.
Specifically, this strategy chooses an EMA with a length of 37 as the fast line, and an EMA with a length of 175 as the slow line. It generates a buy signal when the fast line crosses above the slow line for going long, and it generates a sell signal when the fast line crosses below the slow line for going short. It realizes stop loss or take profit after going long by the slow line crossing below the fast line.
This EMA crossover strategy has the following advantages:
- Simple principle, easy to understand and implement
- Can effectively capture short-term trends in the market
- Relatively low pullback risk contro
- The EMA periods can be adjusted to adapt to different products
This strategy also has some potential risks:
- Prone to generating false signals, may enter too early or too late
- EMA indicator lags, may miss key turning points
- Easy to be stopped out in range-bound markets
- Backtesting overfitting risk, questionable effect in live trading
To reduce these risks, we can consider optimizing the timing of entries, setting stop loss levels, combining with other indicators for filtration and so on.
There is room for further optimization of this strategy:
- Optimize EMA period parameters to adapt to different product characteristics
- Add volume indicator filters to avoid wrongly entering during market swings
- Set up moving stop loss, gradually adjust stop loss level according to the trend
- Combine with volatility indicators to dynamically adjust position size based on market volatility
In general, this simple EMA crossover strategy is easy for beginners to grasp. But its actual effect needs practical verification, and investors should also be aware of the risks of backtest overfitting when using it. By optimizing parameters, combining indicators, etc., the stability and practical effect of this strategy can be further enhanced.
[/trans]
Strategy Arguments
| Argument | Default | Description |
|---|---|---|
| v_input_1 | 37 | Fast EMA Length |
| v_input_2 | 370 | Slow EMA Length |
Source (PineScript)
/*backtest
start: 2022-12-20 00:00:00
end: 2023-12-26 00:00:00
period: 1d
basePeriod: 1h
exchanges: [{"eid":"Futures_Binance","currency":"BTC_USDT"}]
*/

// This Pine Script™ code is subject to the terms of the Mozilla Public License 2.0 at https://mozilla.org/MPL/2.0/
// © umerhafeez37733

//@version=5
strategy("EMA Crossover Strategy", overlay=true)

// Input for EMA lengths
fastEmaLength = input(37, title="Fast EMA Length")
slowEmaLength = input(370, title="Slow EMA Length")

// Calculate EMAs
fastEma = ta.ema(close, fastEmaLength)
slowEma = ta.ema(close, slowEmaLength)

// Plot EMAs on the chart
plot(fastEma, title="Fast EMA", color=color.blue)
plot(slowEma, title="Slow EMA", color=color.red)

// Buy condition: Fast EMA crosses above Slow EMA
buyCondition = ta.crossover(fastEma, slowEma)

// Sell condition: Fast EMA crosses below Slow EMA
sellCondition = ta.crossunder(fastEma, slowEma)

// Plot Buy and Sell signals on the chart
plotshape(series=buyCondition, title="Buy Signal", color=color.green, style=shape.triangleup, location=location.belowbar)
plotshape(series=sellCondition, title="Sell Signal", color=color.red, style=shape.triangledown, location=location.abovebar)

// Execute strategy
strategy.entry("Buy", strategy.long, when=buyCondition)
strategy.close("Buy", when=sellCondition)
Detail
https://www.fmz.com/strategy/436781
Last Modified
2023-12-27 16:35:04