Name
改进趋势跟踪动量突破趋势策略Improved-SuperTrend-Strategy
Author
ChaoZhang
Strategy Description
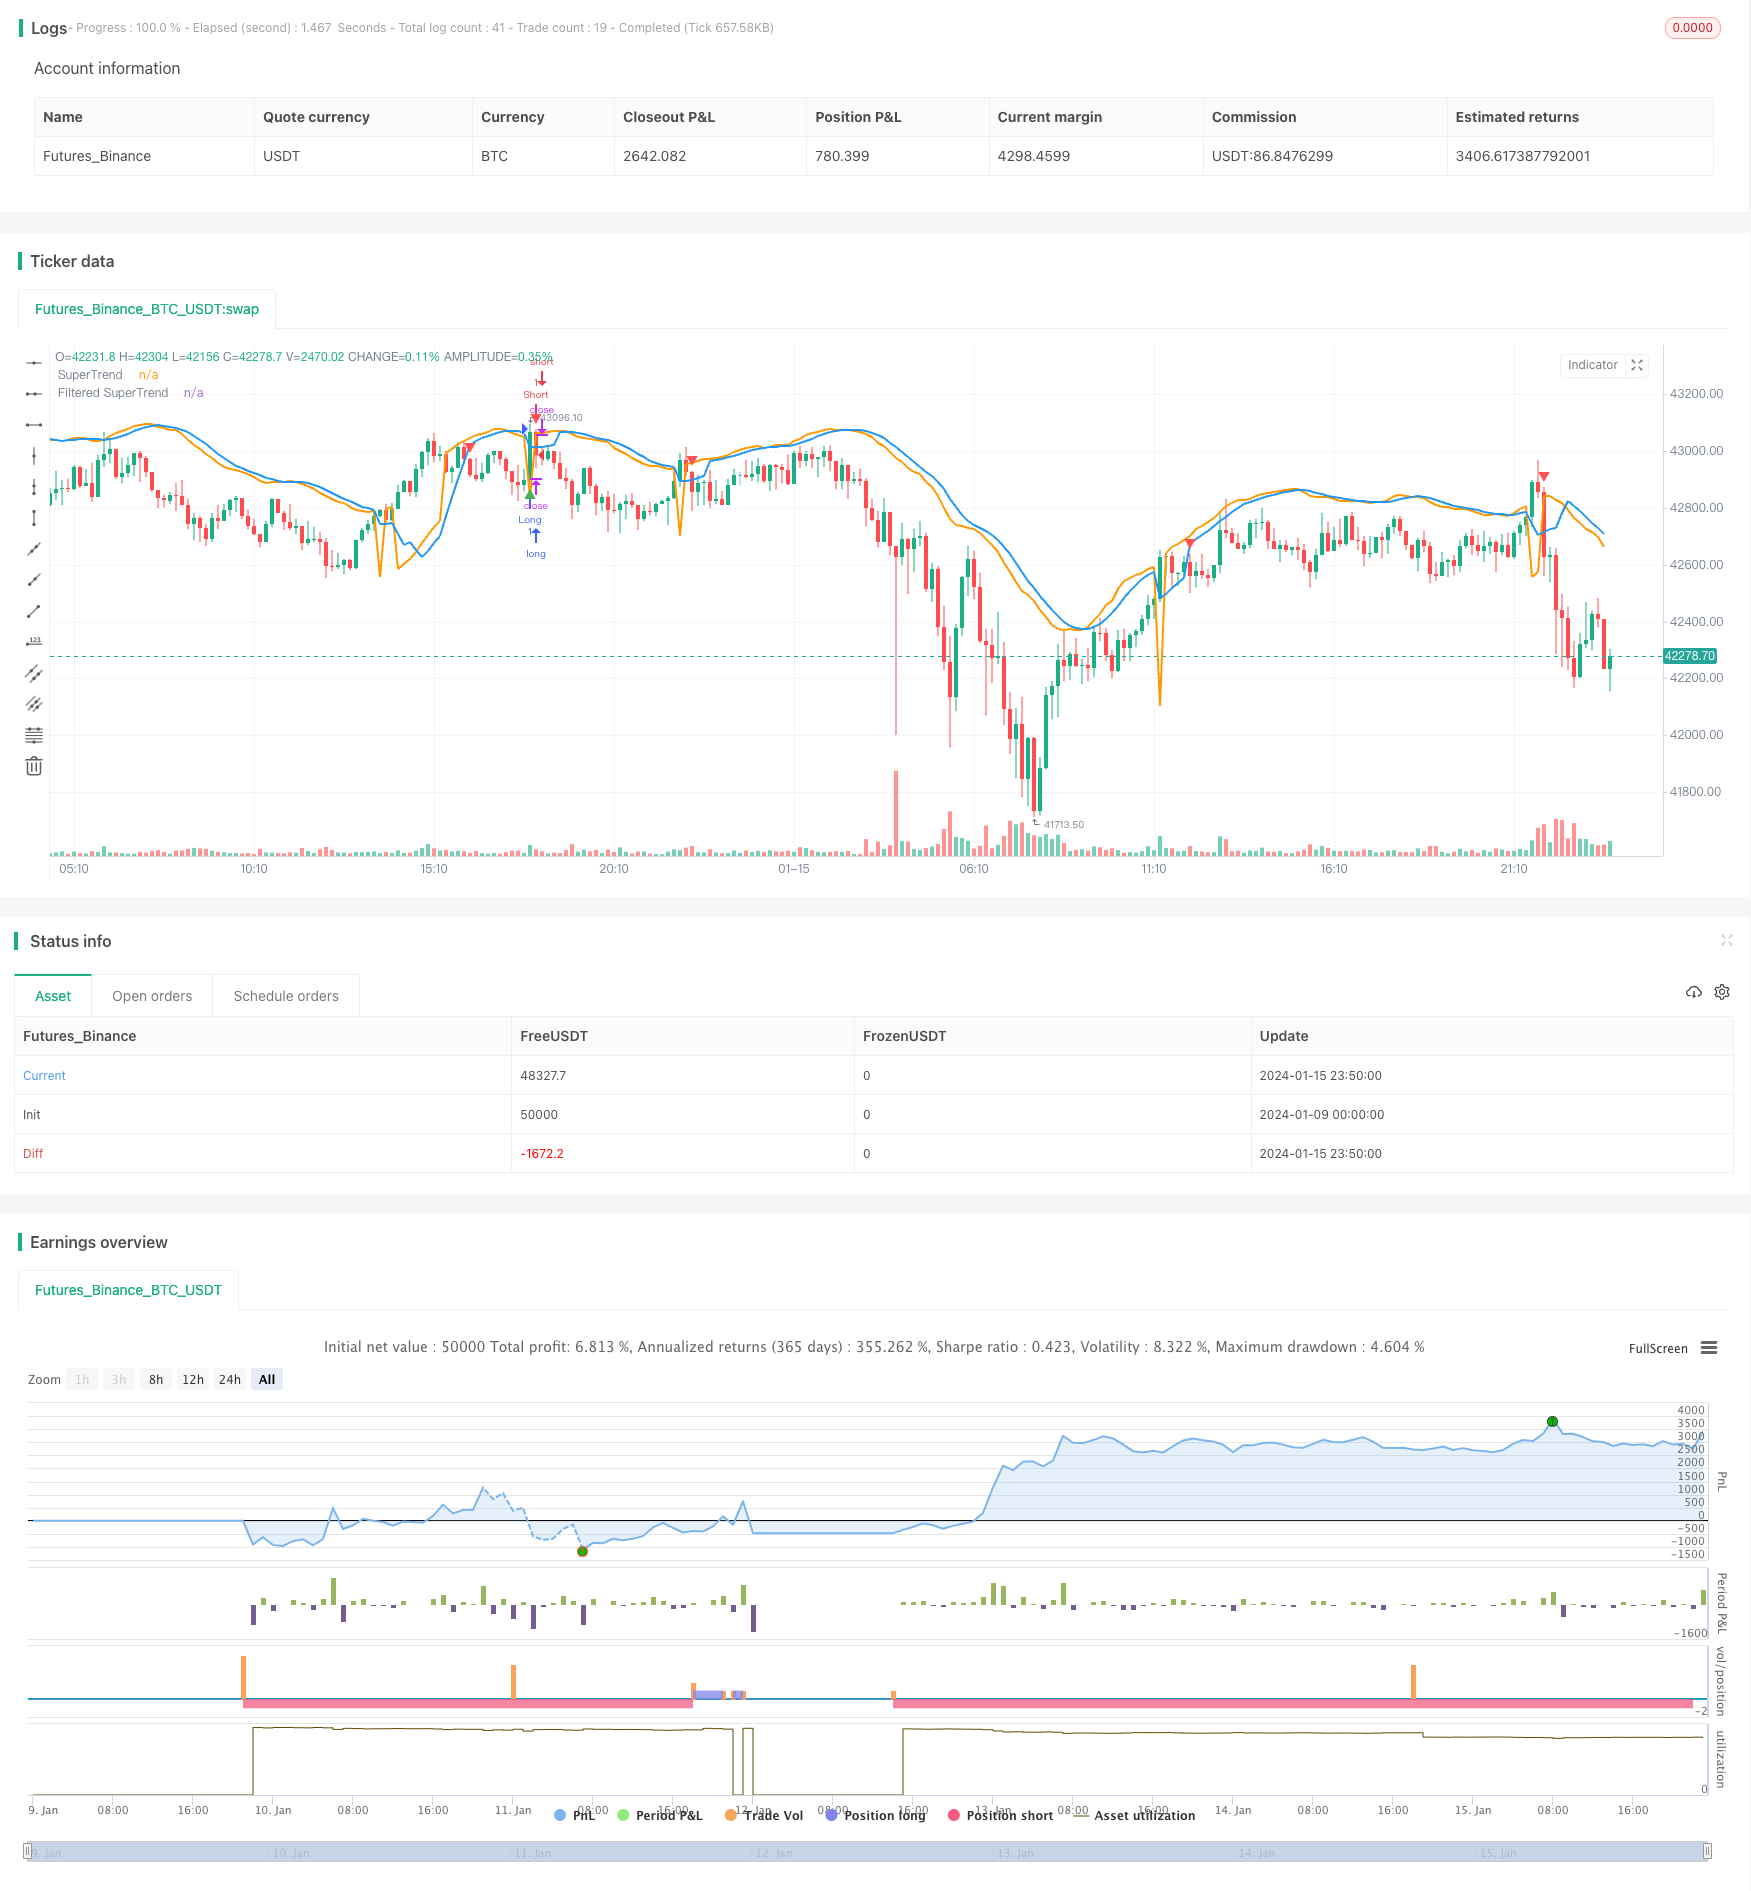
本文详细分析了一个结合SuperTrend指标和Stochastic RSI过滤器的改进趋势跟踪策略。该策略旨在生成买入和卖出信号,同时考虑市场趋势和减少假信号。Stochastic RSI用于避免超买超卖情况下的假信号。
首先,计算真实波动范围(TR)和平均真实波动范围(ATR)。然后利用ATR计算上轨和下轨:
上轨 = SMA(收盘价, ATR周期) + ATR乘数 × ATR 下轨 = SMA(收盘价, ATR周期) - ATR乘数 × ATR
如果收盘价高于下轨,则为上升趋势;如果收盘价低于上轨,则为下降趋势。在上升趋势中,SuperTrend为下轨;在下降趋势中,SuperTrend为上轨。
为了减少假信号,对SuperTrend进行移动平均来获得过滤后的SuperTrend。
计算RSI的值,然后应用Stochastic指标生成Stochastic RSI。它反映RSI是否处于超买或超卖区域。
买入条件:收盘价上穿过滤后的SuperTrend且处于上升趋势,且Stochastic RSI < 80 卖出条件:收盘价下穿过滤后的SuperTrend且处于下降趋势,且Stochastic RSI > 20
退出买入:收盘价下穿过滤后的SuperTrend且处于上升趋势 退出卖出:收盘价上穿过滤后的SuperTrend且处于下降趋势
这是一个改进的趋势跟踪策略,相比简单的移动平均等指标有以下优势:
- SuperTrend本身就具有较强的趋势识别能力和滤波假信号的能力。
- 应用过滤机制进一步减少了假信号,使信号更加可靠。
- Stochastic RSI避免了超买超卖情况下产生的假信号,让策略在重要支持阻力区域附近发出信号。
- 策略同时考虑了趋势方向和 Stochastic RSI 的超买超卖情况,较好地平衡了跟踪趋势和避免假信号之间的关系。
- 策略参数可以灵活调整,适用于不同市场环境。
- 在剧烈波动的市场中,止损可能被突破。
- SuperTrend和过滤机制都有滞后,可能错过最近的价格变化。
- Stochastic RSI参数设置不当也会影响策略表现。
- 适当调整止损,或使用违约止损。
- 调整参数ATR周期、过滤周期以平衡滞后性。
- 测试并优化Stochastic RSI的参数。
- 测试不同的参数组合,寻找最佳参数。
- 尝试不同的过滤机制,如EMA平滑等。
- 应用机器学习算法自动优化参数。
- 结合其他指标补充入场根据。
本策略整合了SuperTrend和Stochastic RSI两个指标的优势,能够有效识别趋势,发出高质量的交易信号。同时过滤机制也使其对市场噪音更具鲁棒性。此策略可通过参数优化获得更好的策略效果,也可以考虑与其他指标或模型相结合。总的来说,该策略表现出良好的跟踪趋势能力,并具有一定的风险控制机制,适合那些追求稳定收益的投资者。
||
This article analyzes in depth a trend following strategy that combines the SuperTrend indicator with a Stochastic RSI filter for improved accuracy. It aims to generate buy and sell signals while considering the prevailing trend and reducing false signals. The Stochastic RSI filters out false signals during overbought and oversold conditions.
First, True Range (TR) and Average True Range (ATR) are calculated. Then the upper and lower bands are computed using ATR:
Upper Band = SMA(Close, ATR Period) + ATR Multiplier * ATR Lower Band = SMA(Close, ATR Period) - ATR Multiplier * ATR
An uptrend is identified when close > lower band. A downtrend is identified when close < upper band.
During uptrend, SuperTrend is set to lower band. During downtrend, SuperTrend is set to upper band.
To reduce false signals, the SuperTrend is smoothed using a moving average to obtain the filtered SuperTrend.
The RSI value is calculated, then Stochastic indicator is applied on it to generate Stochastic RSI. It shows whether RSI is overbought or oversold.
Long entry: Close crosses above filtered SuperTrend in uptrend and Stochastic RSI < 80 Short entry: Close crosses below filtered SuperTrend in downtrend and Stochastic RSI > 20
Long exit: Close crosses below filtered SuperTrend in uptrend
Short exit: Close crosses above filtered SuperTrend in downtrend
This improved trend following strategy has the following edges over simple moving averages:
- SuperTrend itself has good trend identification and false signal filtering abilities.
- The filtering mechanism further reduces false signals resulting in more reliable signals.
- Stochastic RSI avoids false signals around important support/resistance levels during overbought/oversold conditions.
- The strategy considers both trend direction and overbought/oversold conditions leading to better balance between following the trend and avoiding false signals.
- Flexible parameter adjustment allows adaptation to different market environments.
- Stop loss can be hit during high volatility moves.
- Lagging issues with SuperTrend and filtering causing missing recent price changes.
- Incorrect Stochastic RSI parameter settings impacting strategy performance.
- Adjust stop loss appropriately or use trailing stop loss.
- Tune parameters like ATR period and filter period to balance lagging effect.
- Test and optimize Stochastic RSI parameters.
- Test different parameter combinations to find optimal parameters.
- Try different filtering mechanisms like EMA smoothing etc.
- Apply machine learning to auto-optimize parameters.
- Incorporate other indicators to supplement entry conditions.
This strategy combines the strengths of SuperTrend and Stochastic RSI for effective trend identification and quality trade signals, while also making the strategy robust to market noise through filtering mechanisms. Further performance improvement can be achieved through parameter optimization or combining with other indicators/models. Overall, this strategy demonstrates good trend following ability and some risk control for those seeking steady returns.
[/trans]
Strategy Arguments
| Argument | Default | Description |
|---|---|---|
| v_input_1 | 14 | ATR Length |
| v_input_2 | 1.5 | ATR Multiplier |
| v_input_3 | 5 | Filter Length |
| v_input_4 | 14 | Stochastic RSI Length |
| v_input_5 | 3 | Stochastic RSI %K Smoothing |
Source (PineScript)
/*backtest
start: 2024-01-09 00:00:00
end: 2024-01-16 00:00:00
period: 10m
basePeriod: 1m
exchanges: [{"eid":"Futures_Binance","currency":"BTC_USDT"}]
*/

//@version=5
strategy("Improved SuperTrend Strategy with Stochastic RSI", shorttitle="IST+StochRSI", overlay=true)

// Input parameters
atr_length = input(14, title="ATR Length")
atr_multiplier = input(1.5, title="ATR Multiplier")
filter_length = input(5, title="Filter Length")
stoch_length = input(14, title="Stochastic RSI Length")
smooth_k = input(3, title="Stochastic RSI %K Smoothing")

// Calculate True Range (TR) and Average True Range (ATR)
tr = ta.rma(ta.tr, atr_length)
atr = ta.rma(tr, atr_length)

// Calculate SuperTrend
upper_band = ta.sma(close, atr_length) + atr_multiplier * atr
lower_band = ta.sma(close, atr_length) - atr_multiplier * atr

is_uptrend = close > lower_band
is_downtrend = close < upper_band

super_trend = is_uptrend ? lower_band : na
super_trend := is_downtrend ? upper_band : super_trend

// Filter for reducing false signals
filtered_super_trend = ta.sma(super_trend, filter_length)

// Calculate Stochastic RSI
rsi_value = ta.rsi(close, stoch_length)
stoch_rsi = ta.sma(ta.stoch(rsi_value, rsi_value, rsi_value, stoch_length), smooth_k)

// Entry conditions
long_condition = ta.crossover(close, filtered_super_trend) and is_uptrend and stoch_rsi < 80
short_condition = ta.crossunder(close, filtered_super_trend) and is_downtrend and stoch_rsi > 20

// Exit conditions
exit_long_condition = ta.crossunder(close, filtered_super_trend) and is_uptrend
exit_short_condition = ta.crossover(close, filtered_super_trend) and is_downtrend

// Plot SuperTrend and filtered SuperTrend
plot(super_trend, color=color.orange, title="SuperTrend", linewidth=2)
plot(filtered_super_trend, color=color.blue, title="Filtered SuperTrend", linewidth=2)

// Plot Buy and Sell signals
plotshape(series=long_condition, title="Buy Signal", color=color.green, style=shape.triangleup, location=location.belowbar)
plotshape(series=short_condition, title="Sell Signal", color=color.red, style=shape.triangledown, location=location.abovebar)

// Output signals to the console for analysis
plotchar(long_condition, "Long Signal", "▲", location.belowbar, color=color.green, size=size.small)
plotchar(short_condition, "Short Signal", "▼", location.abovebar, color=color.red, size=size.small)

// Strategy entry and exit
strategy.entry("Long", strategy.long, when=long_condition)
strategy.entry("Short", strategy.short, when=short_condition)
strategy.close("Long", when=exit_long_condition)
strategy.close("Short", when=exit_short_condition)
Detail
https://www.fmz.com/strategy/439082
Last Modified
2024-01-17 15:55:15