Name
最高最低中心回看策略Highest-Lowest-Center-Lookback-Strategy
Author
ChaoZhang
Strategy Description
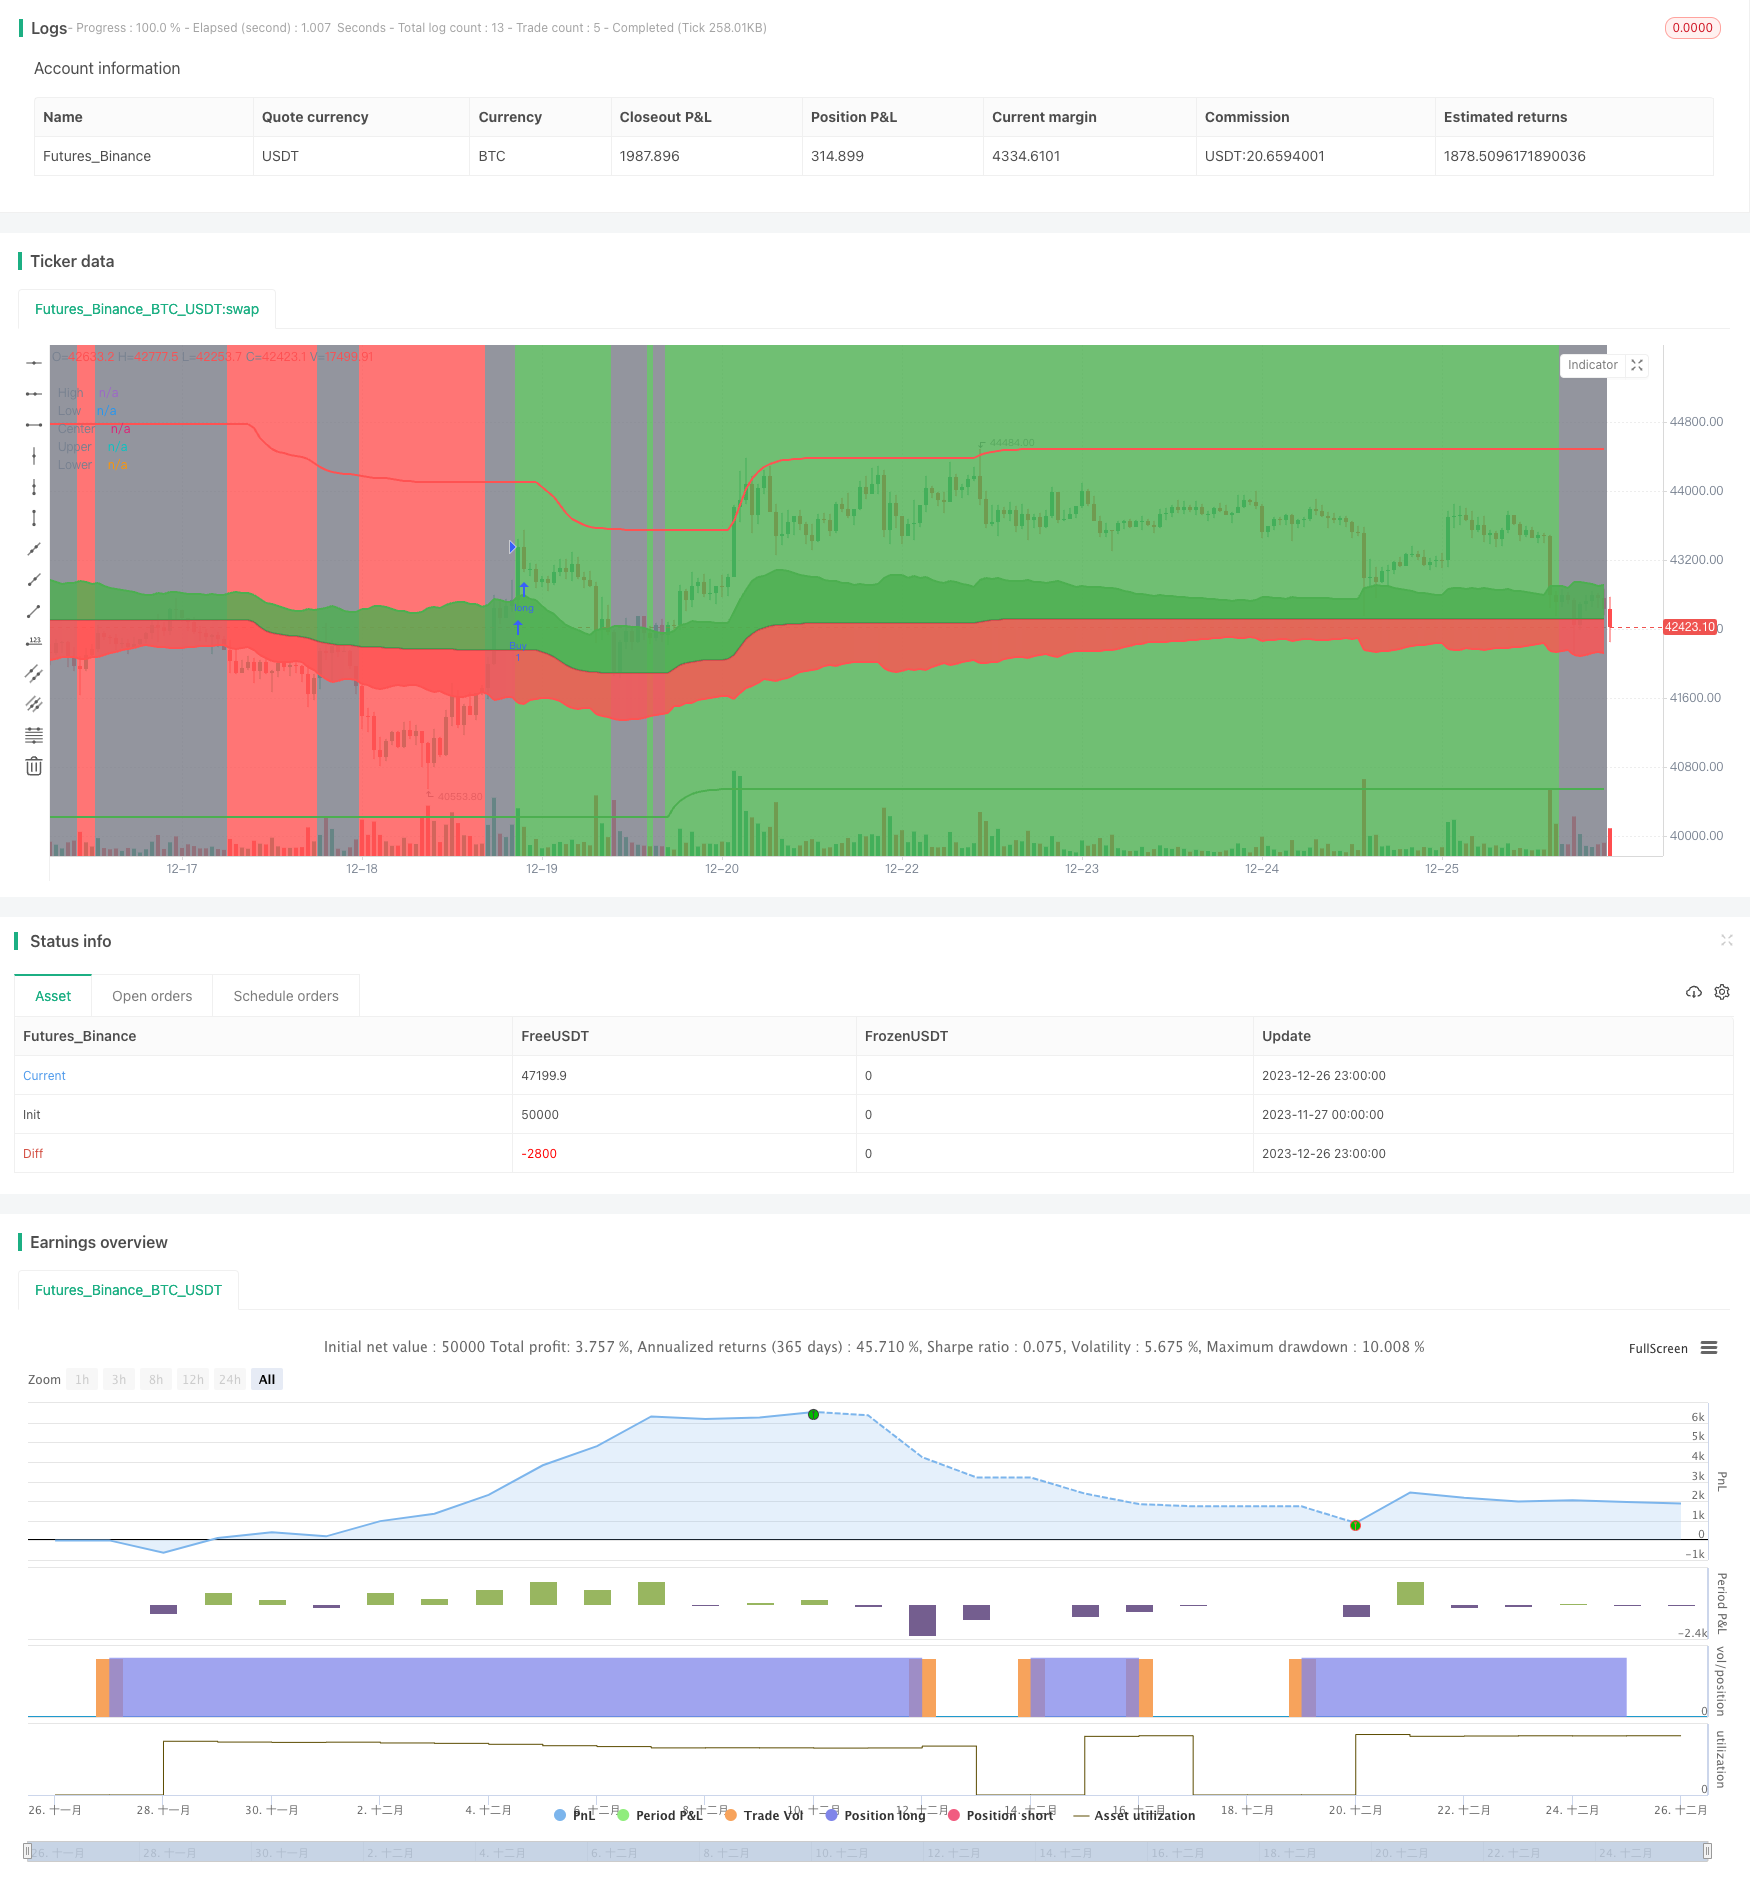
最高最低中心回看策略是一种趋势跟踪策略。它的主要思想是计算过去一定周期内的最高价和最低价的中间价作为基准价,然后根据这个基准价再结合波动率计算出建仓区和平仓区。当价格进入建仓区时,做多;当价格进入平仓区时,平仓。
该策略主要通过以下几个步骤实现:
- 计算过去lookback_length周期内的最高价h和最低价l,并使用EMA平滑
- 计算最高价和最低价的中间价center作为基准价
- 根据ATR和ATR multiplier计算波动率vola
- 根据center和vola计算出建仓区upper和平仓区lower
- 当价格price上穿upper时,做多;当price下穿lower时,平仓
通过这种方法,可以在价格进入趋势状态时及时跟踪趋势;同时也可以通过波动率来控制风险。
这种策略具有以下几个优势:
- 可以有效跟踪趋势,及时捕捉价格变化
- 使用最高最低价的中间价作为基准价,可以减少假突破的概率
- 波动率可以自动调整,从而控制风险
- 持仓时间短,可以获取较高频率的交易机会
- 实现简单,容易理解和优化
该策略也存在一些风险:
- 在震荡行情中可能会出现较多无谓交易
- ATR大小和倍数的设置会影响策略表现,需要仔细测试优化
- 在突破中间价后可能会出现回调从而导致止损
- 如果趋势反转速度过快,会带来较大亏损
为了控制这些风险,可以从以下几个方面进行优化:
- 调整ATR参数,降低波动率,过滤震荡
- 增加过滤条件,避免无谓交易
- 采用移动止损以锁定利润
- 结合趋势指标判断真正趋势的开始和结束
该策略还具有进一步优化的空间:
- 可以测试不同市场及不同周期的参数效果
- 可以结合机器学习算法自动优化参数
- 可以结合更多指标判断趋势开始和结束
- 可以考虑动态调整建仓比例
- 可以结合情绪指标避免被极端情绪带偏
通过这些优化,可以期望进一步提高策略的稳定性和盈利能力。
最高最低中心回看策略是一个简单实用的趋势跟踪策略。它可以及时捕捉价格变化,跟踪趋势,而又能够通过波动率控制风险。该策略容易实现,适合量化交易初学者学习和实践。通过参数优化和规则优化,可以进一步提升策略的效果。总的来说,这是一种值得推荐的量化策略。
||
The Highest/Lowest Center Lookback strategy is a trend following strategy. Its main idea is to calculate the middle price of the highest and lowest prices over a certain period in the past as the benchmark price, and then calculate the entry zone and exit zone based on this benchmark price combined with volatility. When the price enters the entry zone, go long; when the price enters the exit zone, close the position.
The strategy is mainly implemented through the following steps:
- Calculate the highest price h and lowest price l over the past lookback_length periods, and smooth them with EMA
- Calculate the middle price of h and l as the center price
- Calculate volatility vola based on ATR and ATR multiplier
- Calculate entry zone upper and exit zone lower based on center and vola
- When price price breaks above upper, go long; when price breaks below lower, close position
In this way, it can track the trend in time when price enters a trend state; at the same time, risk can be controlled through volatility.
This strategy has the following advantages:
- Can effectively track trends and capture price changes in time
- Using the middle price of highest and lowest prices can reduce the probability of false breakouts
- Volatility can be automatically adjusted to control risk
- Position holding time is short, allowing more frequent trading opportunities
- Simple to implement and easy to understand and optimize
The strategy also has some risks:
- More unnecessary trades may occur in range-bound markets
- The settings of ATR size and multiplier will affect strategy performance, requiring careful testing and optimization
- Pullback after breaking the middle price may cause stop loss
- If the trend reversal speed is too fast, it will lead to greater losses
To control these risks, optimization can be done in the following aspects:
- Adjust ATR parameters to reduce volatility and filter whipsaws
- Add filters to avoid unnecessary trades
- Use moving stop loss to lock in profits
- Combine trend indicators to judge real trend start and end
The strategy also has room for further optimization:
- Test parameter effectiveness across different markets and timeframes
- Automatically optimize parameters with machine learning algorithms
- Incorporate more indicators to judge trend start and end
- Consider dynamically adjusting position sizing
- Incorporate sentiment indicators to avoid bias from extreme emotions
Through these optimizations, further improvements in strategy stability and profitability can be expected.
The Highest/Lowest Center Lookback strategy is a simple and practical trend following strategy. It can capture price changes in time, track trends, while controlling risk through volatility. The strategy is easy to implement, suitable for quantitative trading beginners to learn and practice. By optimizing parameters and rules, the strategy performance can be further improved. In general, this is a recommended quantitative strategy.
[/trans]
Strategy Arguments
| Argument | Default | Description |
|---|---|---|
| v_input_1 | 200 | Lookback Length |
| v_input_2 | 5 | Smoother Length |
| v_input_3 | 10 | ATR Length |
| v_input_4 | 1.5 | ATR Multiplier |
Source (PineScript)
/*backtest
start: 2023-11-27 00:00:00
end: 2023-12-27 00:00:00
period: 1h
basePeriod: 15m
exchanges: [{"eid":"Futures_Binance","currency":"BTC_USDT"}]
*/

//@version=4
strategy("Highest/Lowest Center Lookback Strategy", overlay=true)

lookback_length = input(200, type=input.integer, minval=1, title="Lookback Length")
smoother_length = input(5, type=input.integer, minval=1, title="Smoother Length")
atr_length = input(10, type=input.integer, minval=1, title="ATR Length")
atr_multiplier = input(1.5, type=input.float, minval=0.5, title="ATR Multiplier")

vola = atr(atr_length) * atr_multiplier
price = sma(close, 3)

l = ema(lowest(low, lookback_length), smoother_length)
h = ema(highest(high, lookback_length), smoother_length)
center = (h + l) * 0.5
upper = center + vola
lower = center - vola
trend = price > upper ? true : (price < lower ? false : na)

bull_cross = crossover(price, upper)
bear_cross = crossunder(price, lower)

strategy.entry("Buy", strategy.long, when=bull_cross)
strategy.close("Buy", when=bear_cross)

plot(h, title="High", color=color.red, transp=75, linewidth=2)
plot(l, title="Low", color=color.green, transp=75, linewidth=2)

pc = plot(center, title="Center", color=color.black, transp=25, linewidth=2)
pu = plot(upper, title="Upper", color=color.green, transp=75, linewidth=2)
pl = plot(lower, title="Lower", color=color.red, transp=75, linewidth=2)

fill(pu, pc, color=color.green, transp=85)
fill(pl, pc, color=color.red, transp=85)

bgcolor(trend == true ? color.green : (trend == false ? color.red : color.gray), transp=85)
Detail
https://www.fmz.com/strategy/436878
Last Modified
2023-12-28 15:42:10