Name
月旗MACD动量StochRSI交易策略MoonFlag-MACD-Momentum-StochRSI-Trading-Strategy
Author
ChaoZhang
Strategy Description
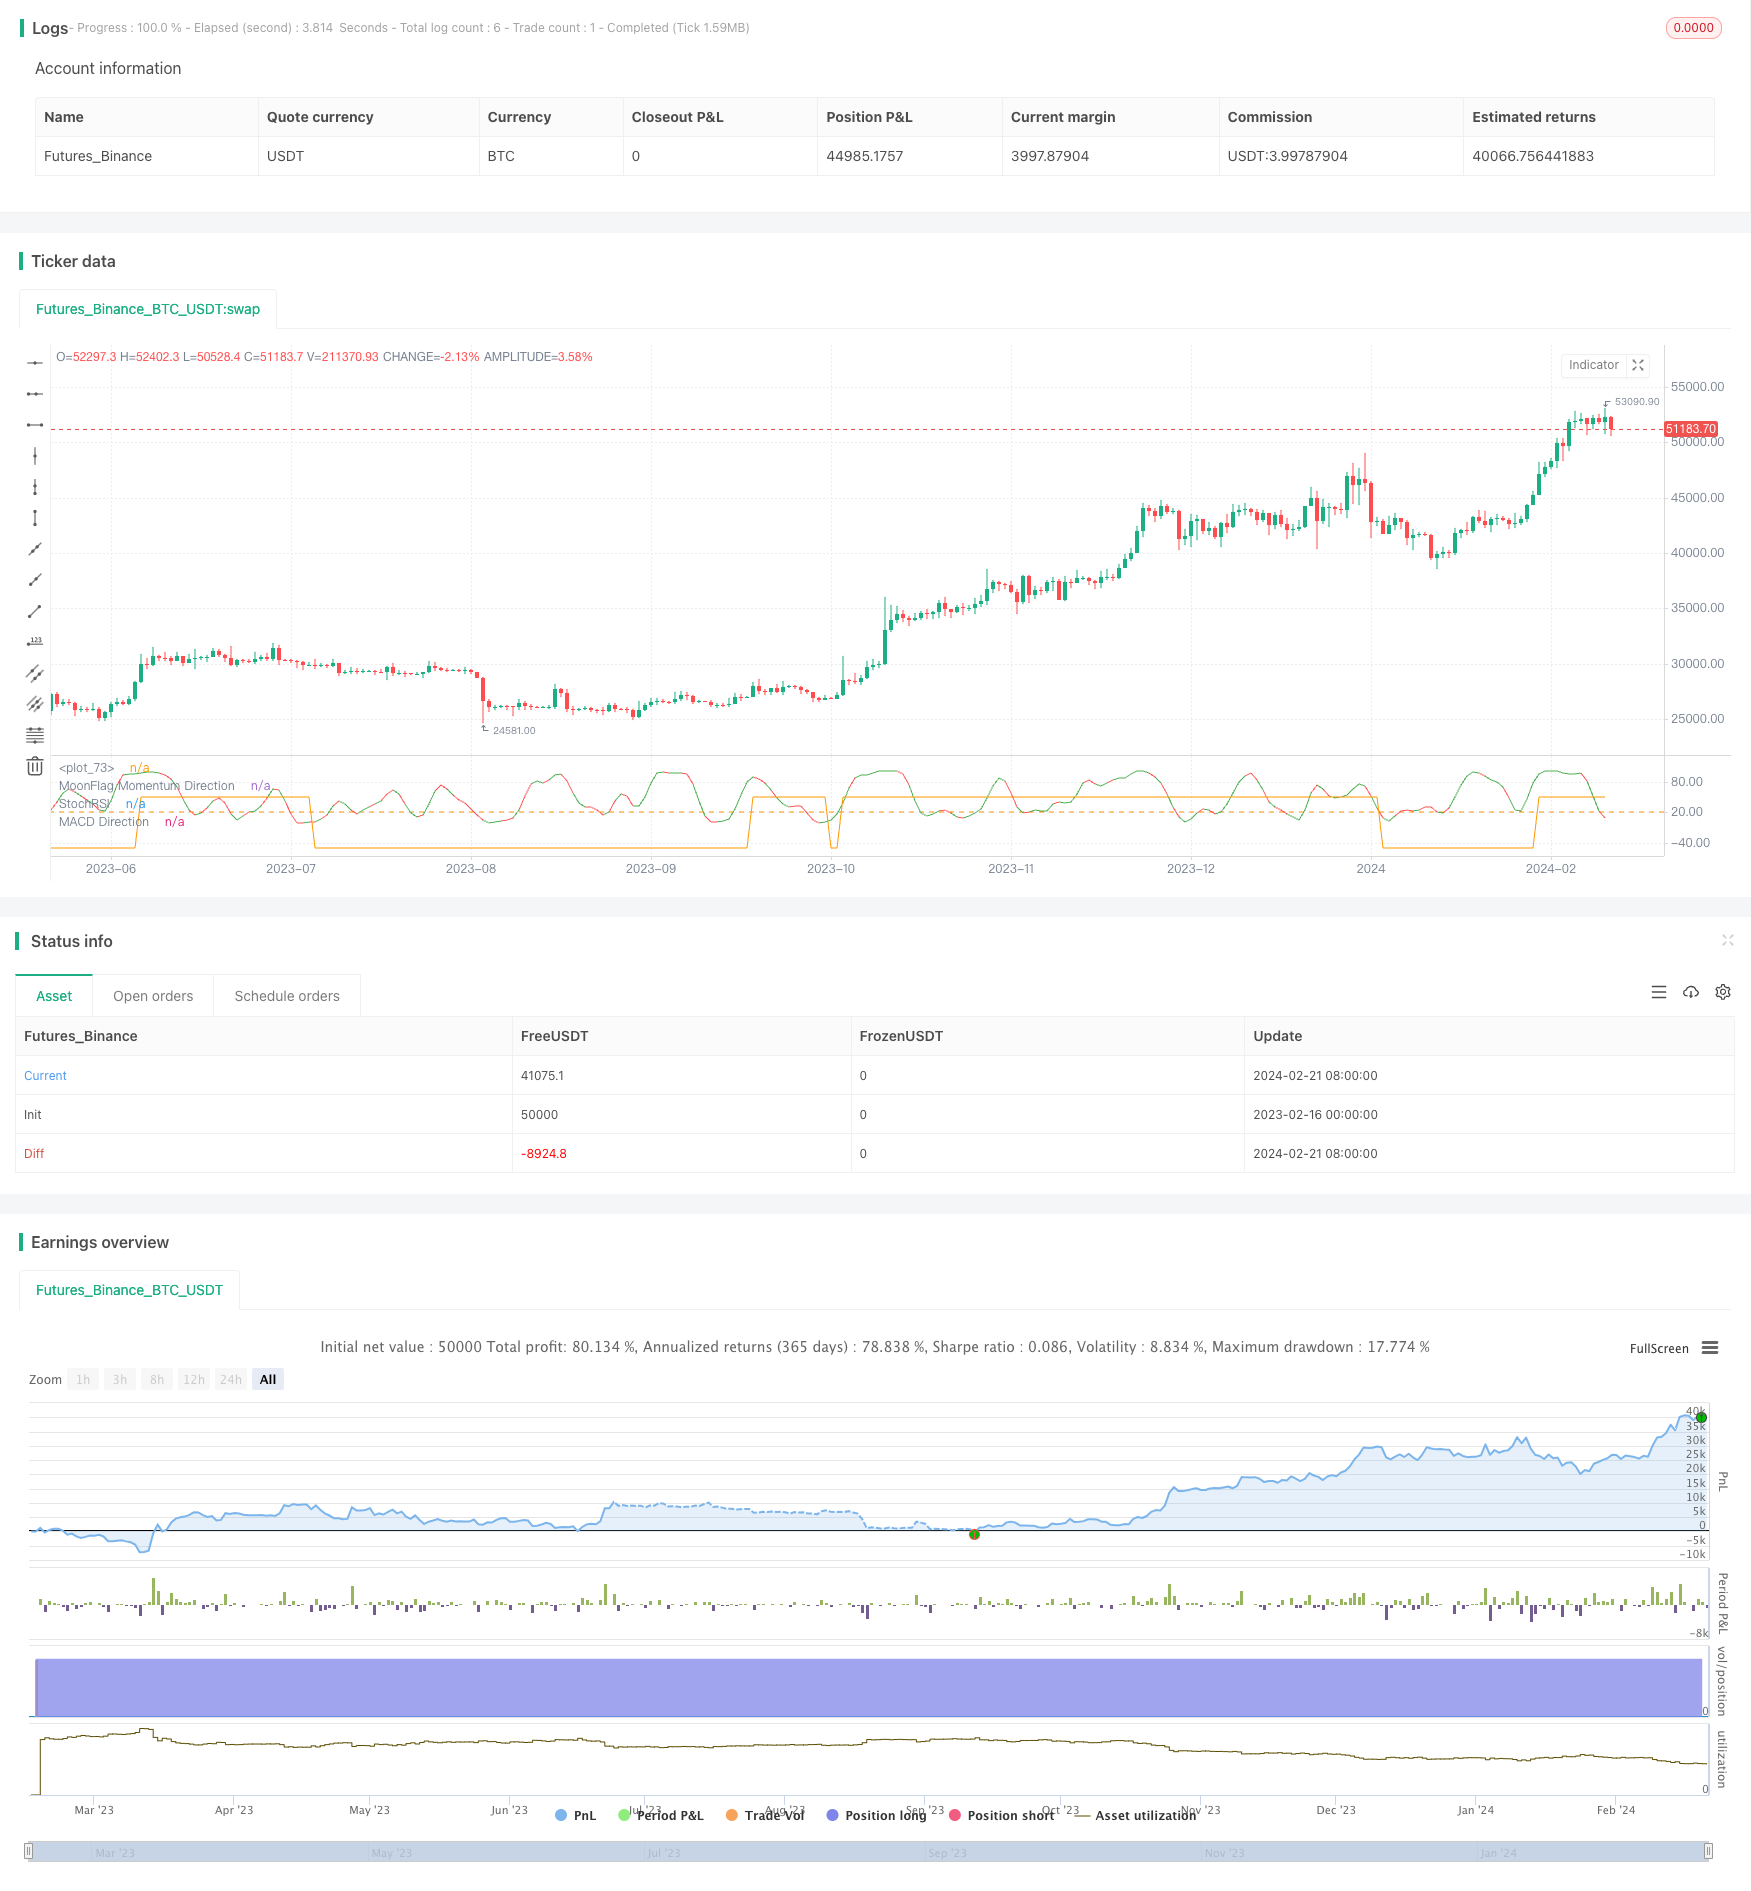
月旗MACD动量StochRSI交易策略是一个利用MACD、动量和StochRSI三个指标进行判断的量化交易策略。该策略主要适用于比特币和以太坊的日线交易。
该策略使用以下几个关键指标进行判断:
-
MACD指标:快速SMA周期为50,慢速SMA周期为200,代表着市场中常用的50日线和200日线。该指标判断市场的长期趋势方向。
-
自创的动量指标:本质上与Stoch指标类似,用于判断市场的短期动量方向。
-
StochRSI指标:判断市场力度和超买超卖情况。
在进入多头时,需要同时满足MACD>0(代表着中长期趋势向上)、自创动量指标>0(代表着短期动量向上)和收盘价较前一日收高(代表着当前处于上升趋势)3个条件。
平多头信号略复杂,需要同时满足MACD<0、自创动量指标<0、收盘价较前一日收低和StochRSI>20的4个条件。
该策略综合判断了中长期趋势、短期动量和当前趋势,是一种较为稳健的突破系统。
-
多指标综合判断,避免产生假信号
-
MACD参数选择考虑了市场重要的50日线和200日线
-
各指标参数测试变化后,策略效果变化不大,避免过拟合风险
-
回测数据充分,可靠性较高
-
突破系统容易被套利,可能会增加交易次数和滑点成本
-
综合多指标判断的复杂度较高,参数调整和优化难度大
-
日内短线操作风险较大
-
结合更多指标,如成交量的分析
-
增加机器学习算法,实现动态参数优化
-
降低交易频率,转换至更高周期进行判断
月旗MACD动量StochRSI交易策略综合多种指标判断市场趋势和力度,回测效果较好,可靠性较高,适合有经验的量化交易者在高质量数字货币上应用和优化。
||
The MoonFlag MACD Momentum StochRSI Trading Strategy is a quantitative trading strategy that utilizes MACD, momentum and StochRSI indicators for judgment. It is mainly suitable for Bitcoin and Ethereum daily trading.
The strategy uses the following key indicators for judgment:
-
MACD Indicator: Fast SMA period is 50 and slow SMA period is 200, representing the commonly used 50-day line and 200-day line in the market. This indicator judges the long-term trend direction of the market.
-
Custom momentum indicator: Essentially similar to the Stoch indicator, used to judge the short-term momentum direction of the market.
-
StochRSI Indicator: Judges the strength and overbought/oversold levels of the market.
To enter long, it needs to meet the 3 conditions of MACD>0 (representing upward medium-to-long term trend), custom momentum indicator >0 (representing upward short-term momentum) and close price higher than previous close (representing current uptrend) simultaneously.
Closing long signal is slightly more complex, requiring MACD<0, custom momentum indicator <0, close price lower than previous close and StochRSI>20 the 4 conditions to be met simultaneously.
The strategy comprehensively judges the medium-to-long-term trend, short-term momentum and current trend, and is a relatively robust breakout system.
-
Comprehensive judgment of multiple indicators avoids generating false signals
-
MACD parameter selection considers the important 50-day line and 200-day line in the market
-
After parameters of each indicator were tested for variation, strategy performance changed little, avoiding overfitting risk
-
Backtested with sufficient data with high reliability
-
Breakout systems are prone to arbitrage, which may increase number of trades and slippage costs
-
High complexity with comprehensive multi-indicator judgment, difficulty in parameters tuning and optimization
-
High intraday short-term trading risks
-
Incorporate analysis of more indicators, such as trading volume
-
Increase machine learning algorithms for dynamic parameter optimization
-
Lower trading frequency, convert to higher periodicity for judgments
The MoonFlag MACD Momentum StochRSI Trading Strategy comprehensively judges market trends and strength with multiple indicators, has good backtest results and high reliability, suitable for experienced quantitative traders to apply and optimize on quality cryptocurrencies.
[/trans]
Strategy Arguments
| Argument | Default | Description |
|---|---|---|
| v_input_int_1 | 50 | MACD SMA Fast Length |
| v_input_int_2 | 200 | MACD SMA Slow Length |
| v_input_int_3 | 12 | MoonFlag Momentum Length |
| v_input_bool_1 | true | Include Condition (StochRSI > 20) with Exit Long/Enter Short |
| v_input_int_4 | 2019 | Start backtesting from year: |
Source (PineScript)
/*backtest
start: 2023-02-16 00:00:00
end: 2024-02-22 00:00:00
period: 1d
basePeriod: 1h
exchanges: [{"eid":"Futures_Binance","currency":"BTC_USDT"}]
*/

// // This Pine Script™ code is subject to the terms of the Mozilla Public License 2.0 at https://mozilla.org/MPL/2.0/
// // © MoonFlag
//@version=5
strategy("MoonFlag 1D MACD Momentum StochRSI Strategy", max_bars_back=500, overlay=false, initial_capital=5000, default_qty_type=strategy.percent_of_equity, default_qty_value=80, pyramiding=0, calc_on_order_fills=true)


d(gaps_1, data)=>
    float out = 0.
    out :=(ta.wma(ta.wma(ta.wma(data,  math.round(((1 * gaps_1) - math.round((1 * gaps_1) / 3)) / 2)), math.round((1 * gaps_1) / 3)) , int(((1 * gaps_1) - math.round((1 * gaps_1) / 3)) / 2)))
    out
MoonFlagAverage(gaps_1,data)=>
    float out = 0.
    out:=d(gaps_1,d(gaps_1, d(gaps_1, data)))
    out

fastLength = input.int(50,  "MACD SMA Fast Length")
slowlength = input.int(200, "MACD SMA Slow Length")
MACDLength = 9//input.int(9,   "MACD Length")

MACD  = ta.ema(close, fastLength) - ta.ema(close, slowlength)
aMACD = ta.sma(MACD, MACDLength)
MACDdelta = MACD - aMACD

//plot (MACD, "MACD1", color.red)
//plot (aMACD, "aMACD1", color.green)
//plot (delta, "MACD delta", color.white)

fastLength2 = input.int(12, "MoonFlag Momentum Length")
slowlength2 = 2*fastLength2//input.int(50, "MoonFlag Momentum Slow Length")
MACDLength2 = 20//input.int(20, "Momentum Delta")

MoonFlag_MACD2 = MoonFlagAverage(fastLength2, close) - MoonFlagAverage(slowlength2,close)
MoonFlag_aMACD2 = MoonFlagAverage(MACDLength2, MoonFlag_MACD2)

MoonFlag_delta = MoonFlag_MACD2 - MoonFlag_aMACD2
MoonFlag_delta_line=0
if MoonFlag_delta < 0
    MoonFlag_delta_line:=-100
else
    MoonFlag_delta_line:=100
//plot (MoonFlag_MACD2, "MoonFlag Momentum Fast Length", color.red)
//plot (MoonFlag_aMACD2, "MoonFlag Momentum Slow Length", color.green)
//plot (MoonFlag_delta2, "MoonFlag Delta", color.white)

uptrend   = (close + high)/(close[1] + high[1])
downtrend =  (close + low)/(close[1] + low[1])

lineColor = color.green
if uptrend > 1
    lineColor := color.green
if downtrend < 1
    lineColor := color.red

smoothK     = 2//input.int(2, minval=1, title="K smoothing Stoch RSI")
smoothD     = 3//input.int(3, minval=1, title= "D smoothing for Stoch RSI")
lengthRSI   = 7//input.int(7, minval=1, title="RSI Length")
lengthStoch = 8//input.int(8, minval=1, title="Stochastic Length")
src = close//input(close, title="RSI Source")

rsi1 = ta.rsi(src, lengthRSI)
k = ta.sma(ta.stoch(rsi1, rsi1, rsi1, lengthStoch), smoothK)
StochRSI = ta.sma(k, smoothD)

MACDdirection_line = 0
MACDdirection_line := MACDdirection_line[1]
if (MACDdelta > 0)
    MACDdirection_line := 50
if (MACDdelta < 0)
    MACDdirection_line := -50

useStochRSI = input.bool(true,"Include Condition (StochRSI > 20) with Exit Long/Enter Short")
StochRSI_val = 20//input.int(20,"StochRSI greater than to exit short")
h1 = hline(StochRSI_val)

StochRSIGreaterThanSetValue = true
if useStochRSI
    if  (StochRSI > StochRSI_val)
        StochRSIGreaterThanSetValue := true
    else
        StochRSIGreaterThanSetValue := false

stoch20 = lineColor
if StochRSI < StochRSI_val
    stoch20 := color.white

yearin = input.int(2019, title="Start backtesting from year:")

includeShorts = false//input.bool(false, "Include Shorts")

plot(MoonFlag_delta_line,"MoonFlag Momentum Direction", color.white)
plot(MACDdirection_line,"MACD Direction", color = color.orange)
plot(StochRSI, "StochRSI", color=lineColor)

if  (year>=yearin)
    if (MACDdelta > 0) and (uptrend > 1)   and MoonFlag_delta_line > 0
        strategy.entry("buy2", strategy.long, comment="buy")
    if (MACDdelta < 0) and (downtrend < 1) and MoonFlag_delta_line < 0 and StochRSIGreaterThanSetValue
        if includeShorts
            strategy.entry("sell", strategy.short, comment="sell")
        else
            strategy.close("buy2", comment = "sell")
Detail
https://www.fmz.com/strategy/442654
Last Modified
2024-02-23 15:06:59