Name
比特币和黄金5分钟震荡交易策略20Bitcoin-and-Gold-5-Minute-Scalping-Strategy-20
Author
ChaoZhang
Strategy Description
[trans]
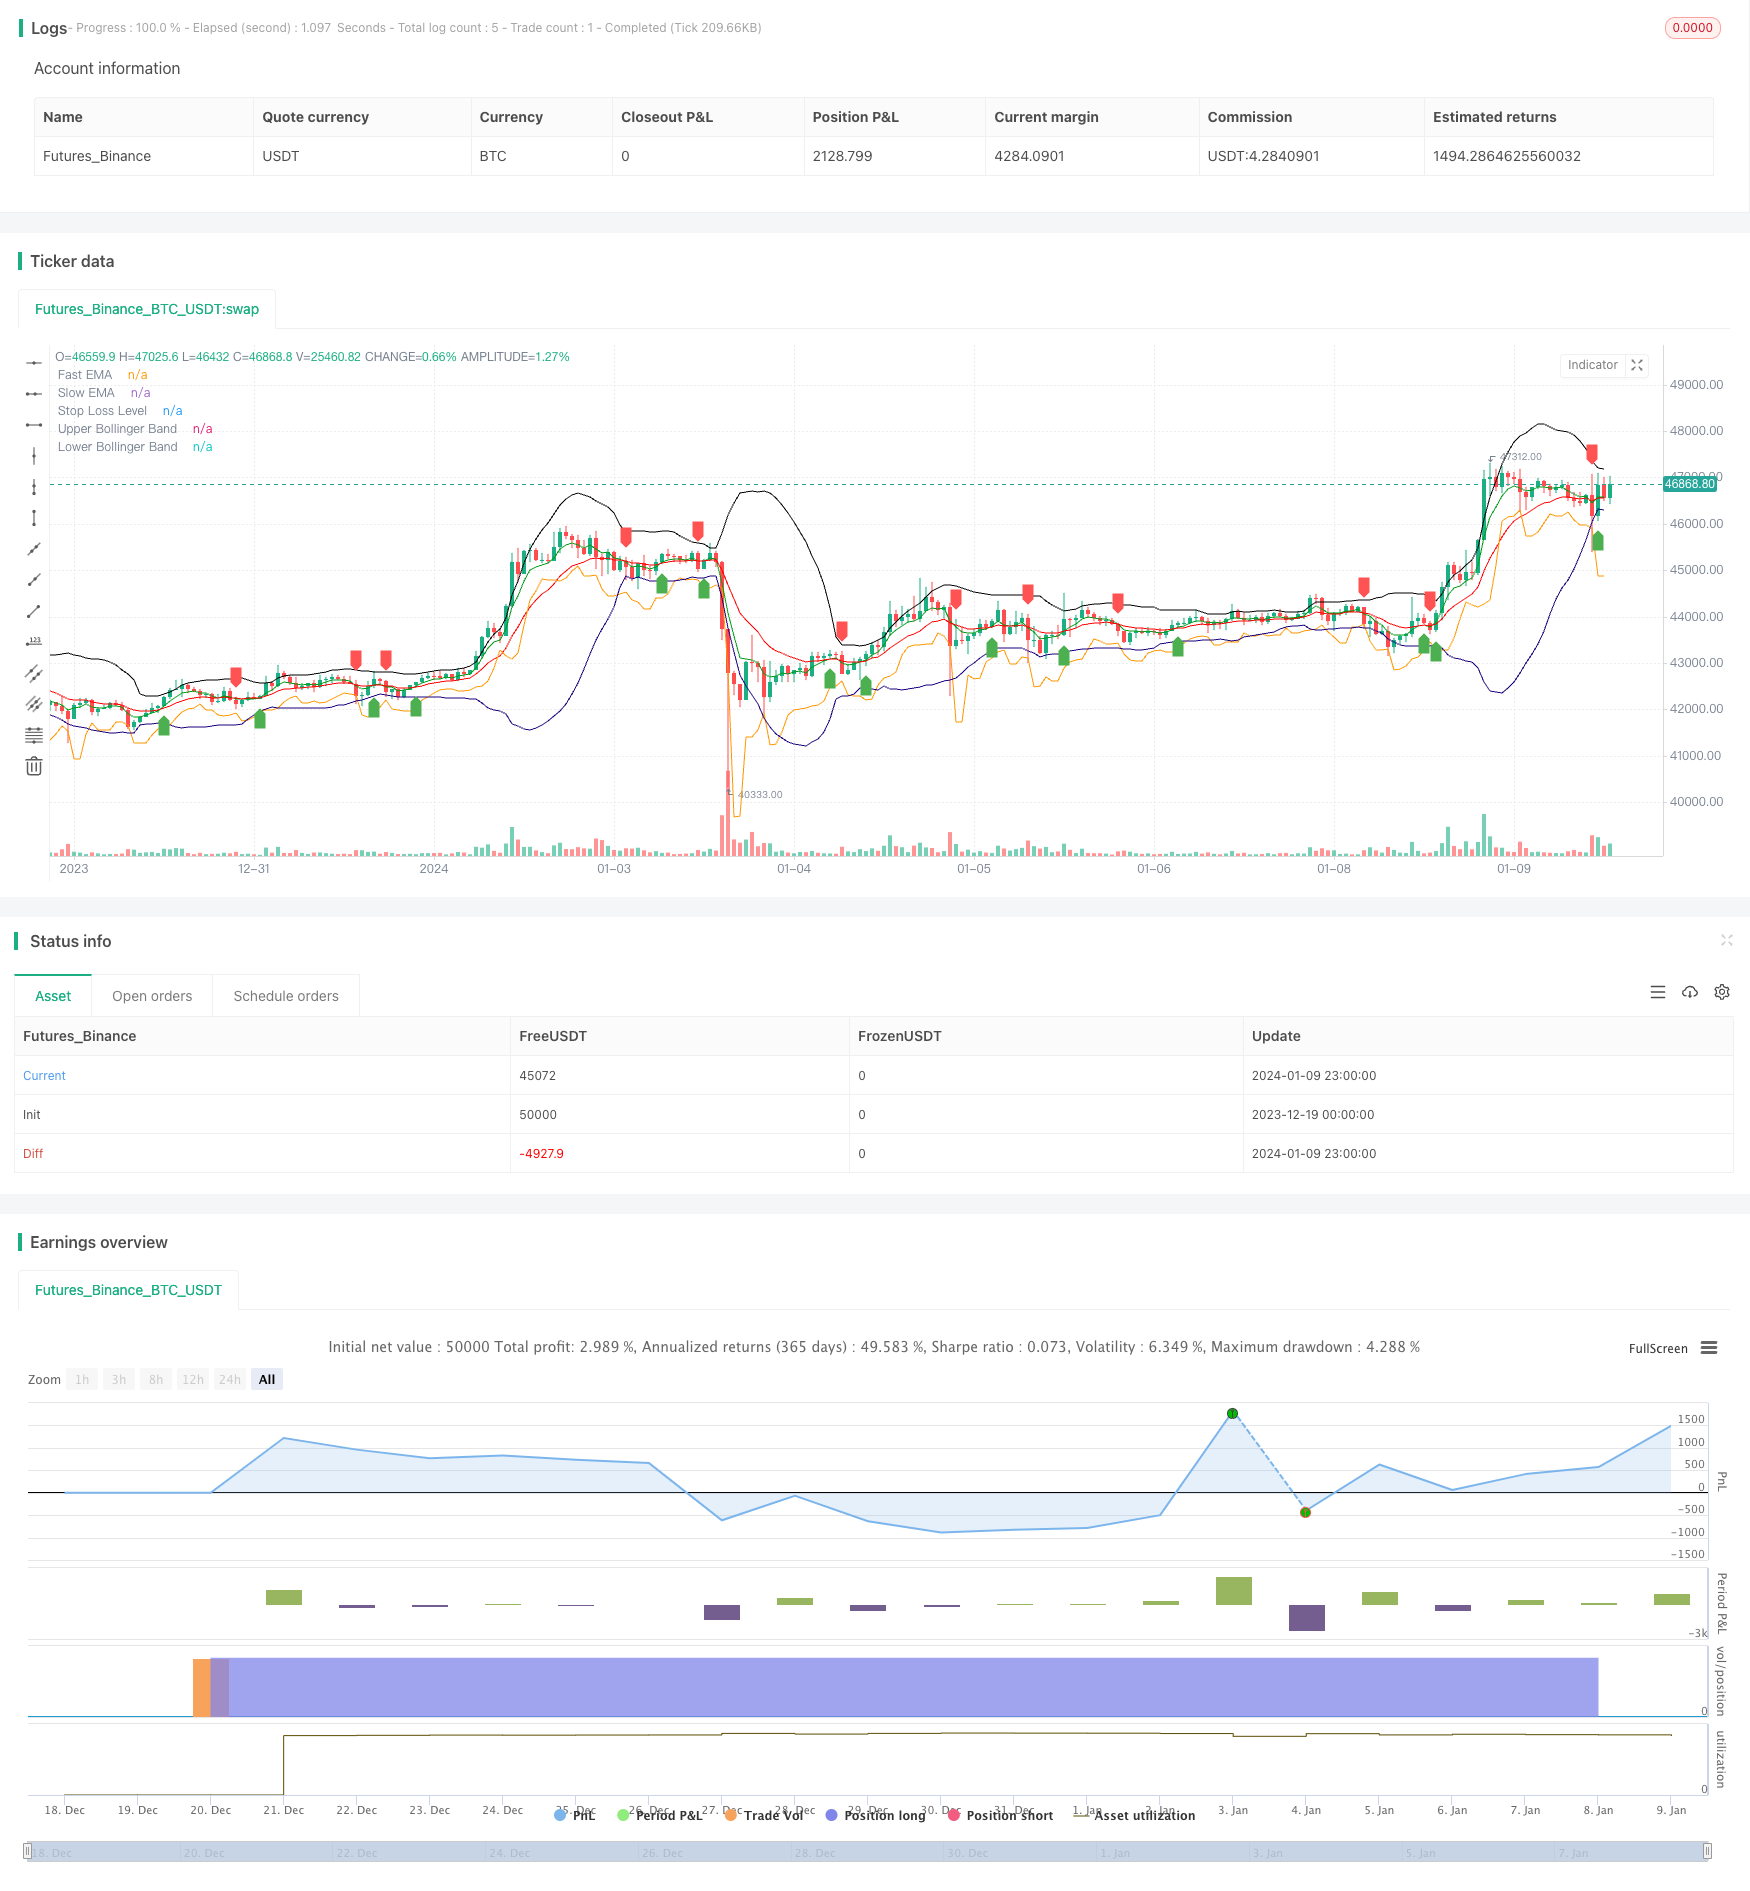
该策略是一种5分钟震荡交易策略,旨在捕捉比特币和黄金市场的短期价格波动,实现盈利。它结合使用EMA均线、布林带指标以及止损方法来实现入场和出场。
该策略使用快速EMA指标和慢速EMA指标构建趋势判断系统。当快速EMA上穿慢速EMA时产生买入信号;当快速EMA下穿慢速EMA时产生卖出信号,捕捉短期趋势的转折。
同时,该策略结合布林带指标判断价格波动区间。只有当价格接近布林带上轨或中轨时,才产生交易信号。这能过滤掉大部分假信号。
入场后,该策略使用ATR指标计算止损位。并且设定止损为入场蜡烛的低点再减去n倍ATR,用于控制每个交易的风险。
该策略最大的优势在于 capturing short-term swings and price volatility, taking small but consistent profits 每次只追求小利润,但持续盈利。通过快速EMA和慢速EMA的配合,能快速判断短期趋势;布林带和ATR止损能有效控制风险,是一种相对稳定的震荡策略。
另外, 5分钟周期操作使得该策略交易频率较高,这也增大了其盈利空间。同时也方便进行人工监控或优化。
该策略主要风险在于 whipsaws leading to multiple small losses 抄底反转造成的小额连续亏损。当价格在一个范围内震荡时,EMA交叉信号可能频繁出现,造成不必要的交易和连续小额亏损。
此外,作为一个短期震荡策略,它也面临着高交易频率带来的交易成本风险。如果交易成本过高,可能会侵蚀利润空间。
该策略可以通过以下方式进行优化:
-
增加其他oscillators作为辅助判断指标,如RSI, Stochastics等,避免在震荡市场中被套。
-
增加machine learning模型判断趋势方向,提高入场的准确性。
-
利用遗传算法、随机森林等方法自动优化参数,使之更符合当下市场情况。
-
结合深度学习判断关键支持位和关键压力位,设定更优的止损位置。
-
测试不同交易品种如股指、外汇、加密货币等,选择交易效果最好的品种作为主要交易标的。
总的来说,该策略作为一个短期频繁交易策略,能够有效捕捉价格短期震荡和趋势反转,通过快速EMA判断,布林带过滤和ATR止损来控制风险,可以获得稳定收益。如果进一步优化和改进,在降低交易频率的同时保持盈利能力,将是一个非常具有潜力的量化策略。
||
This is a 5-minute scalping strategy aimed at capturing short-term price swings and volatility in the Bitcoin and Gold markets to generate profits. It combines the use of EMA lines, Bollinger Bands indicator and stop loss methods to enter and exit trades.
The strategy uses fast EMA and slow EMA indicators to build a trend judgment system. A buy signal is generated when the fast EMA crosses above the slow EMA; A sell signal is generated when the fast EMA crosses below the slow EMA, capturing the turn of short-term trends.
At the same time, the strategy incorporates Bollinger Bands indicator to judge the price fluctuation range. Trading signals are only generated when the price is close to the upper or middle rail of the Bollinger Bands. This filters out most false signals.
After entering the market, the strategy uses the ATR indicator to calculate the stop loss price. The stop loss is set at the low of the entry bar minus n times ATR, which is used to control the risk of each trade.
The biggest advantage of this strategy is capturing short-term swings and price volatility, taking small but consistent profits every time. The combination of fast EMA and slow EMA can quickly determine short-term trends; Bollinger Bands and ATR stop loss can effectively control risks, making it a relatively stable scalping strategy.
In addition, the 5-minute timeframe leads to a higher trading frequency, which also expands its profit potential. It also facilitates manual monitoring or optimization.
The main risk of this strategy comes from whipsaws leading to multiple small losses. When the price oscillates within a range, EMA crossover signals may occur frequently, resulting in unnecessary trades and consecutive small losses.
In addition, as a short-term scalping strategy, it also faces the risk of trading costs brought about by high trading frequency. Excessively high trading costs could erode profit margins.
The strategy can be optimized in the following ways:
-
Add other oscillators as auxiliary judgment indicators, such as RSI, Stochastics, etc., to avoid being trapped in oscillating markets.
-
Increase machine learning models to judge trend direction and improve entry accuracy.
-
Use genetic algorithms, random forests and other methods to automatically optimize parameters to better fit current market conditions.
-
Incorporate deep learning to determine key support and resistance levels and set better stop loss positions.
-
Test different trading vehicles such as stock indices, forex, cryptocurrencies, etc., and select the one with the best trading performance as the main trading vehicle.
In summary, as a short-term frequent trading strategy, this strategy can effectively capture short-term price swings and trend reversals by using fast EMA to judge, Bollinger Bands to filter and ATR for stop loss to control risks, allowing steady gains. If further optimized and improved to reduce trading frequency while maintaining profitability, it will be a highly promising quantitative strategy.
[/trans]
Strategy Arguments
| Argument | Default | Description |
|---|---|---|
| v_input_1 | 5 | Fast EMA Length |
| v_input_2 | 13 | Slow EMA Length |
| v_input_3 | 20 | Bollinger Band Length |
| v_input_4 | 2 | Bollinger Band Multiplier |
| v_input_5 | true | Stop Loss Multiplier |
Source (PineScript)
/*backtest
start: 2023-12-19 00:00:00
end: 2024-01-10 00:00:00
period: 1h
basePeriod: 15m
exchanges: [{"eid":"Futures_Binance","currency":"BTC_USDT"}]
*/

// This source code is subject to the terms of the Mozilla Public License 2.0 at https://mozilla.org/MPL/2.0/
// © singhak8757

//@version=5
strategy("Bitcoin and Gold 5min Scalping Strategy2.0", overlay=true)


// Input parameters
fastLength = input(5, title="Fast EMA Length")
slowLength = input(13, title="Slow EMA Length")
bollingerLength = input(20, title="Bollinger Band Length")
bollingerMultiplier = input(2, title="Bollinger Band Multiplier")
stopLossMultiplier = input(1, title="Stop Loss Multiplier")

// Calculate EMAs
fastEMA = ta.ema(close, fastLength)
slowEMA = ta.ema(close, slowLength)

// Calculate Bollinger Bands
basis = ta.sma(close, bollingerLength)
upperBand = basis + bollingerMultiplier * ta.stdev(close, bollingerLength)
lowerBand = basis - bollingerMultiplier * ta.stdev(close, bollingerLength)

// Buy condition
buyCondition = ta.crossover(fastEMA, slowEMA) and (close <= upperBand or close <= basis)

// Sell condition
sellCondition = ta.crossunder(fastEMA, slowEMA) and (close >= lowerBand or close >= basis)

// Calculate stop loss level
stopLossLevel = ta.lowest(low, 2)[1] - stopLossMultiplier * ta.atr(14)

// Plot EMAs
plot(fastEMA, color=color.rgb(0, 156, 21), title="Fast EMA")
plot(slowEMA, color=color.rgb(255, 0, 0), title="Slow EMA")

// Plot Bollinger Bands
plot(upperBand, color=color.new(#000000, 0), title="Upper Bollinger Band")
plot(lowerBand, color=color.new(#1b007e, 0), title="Lower Bollinger Band")

// Plot Buy and Sell signals
plotshape(series=buyCondition, title="Buy Signal", color=color.green, style=shape.labelup, location=location.belowbar)
plotshape(series=sellCondition, title="Sell Signal", color=color.red, style=shape.labeldown, location=location.abovebar)

// Plot Stop Loss level
plot(stopLossLevel, color=color.orange, title="Stop Loss Level")

// Strategy logic
strategy.entry("Buy", strategy.long, when = buyCondition)
strategy.exit("Stop Loss/Close", from_entry="Buy", loss=stopLossLevel)
strategy.close("Sell", when = sellCondition)
Detail
https://www.fmz.com/strategy/439366
Last Modified
2024-01-19 15:42:06