Name
渐变MACD量化策略Gradient-MACD-Quant-Strategy
Author
ChaoZhang
Strategy Description
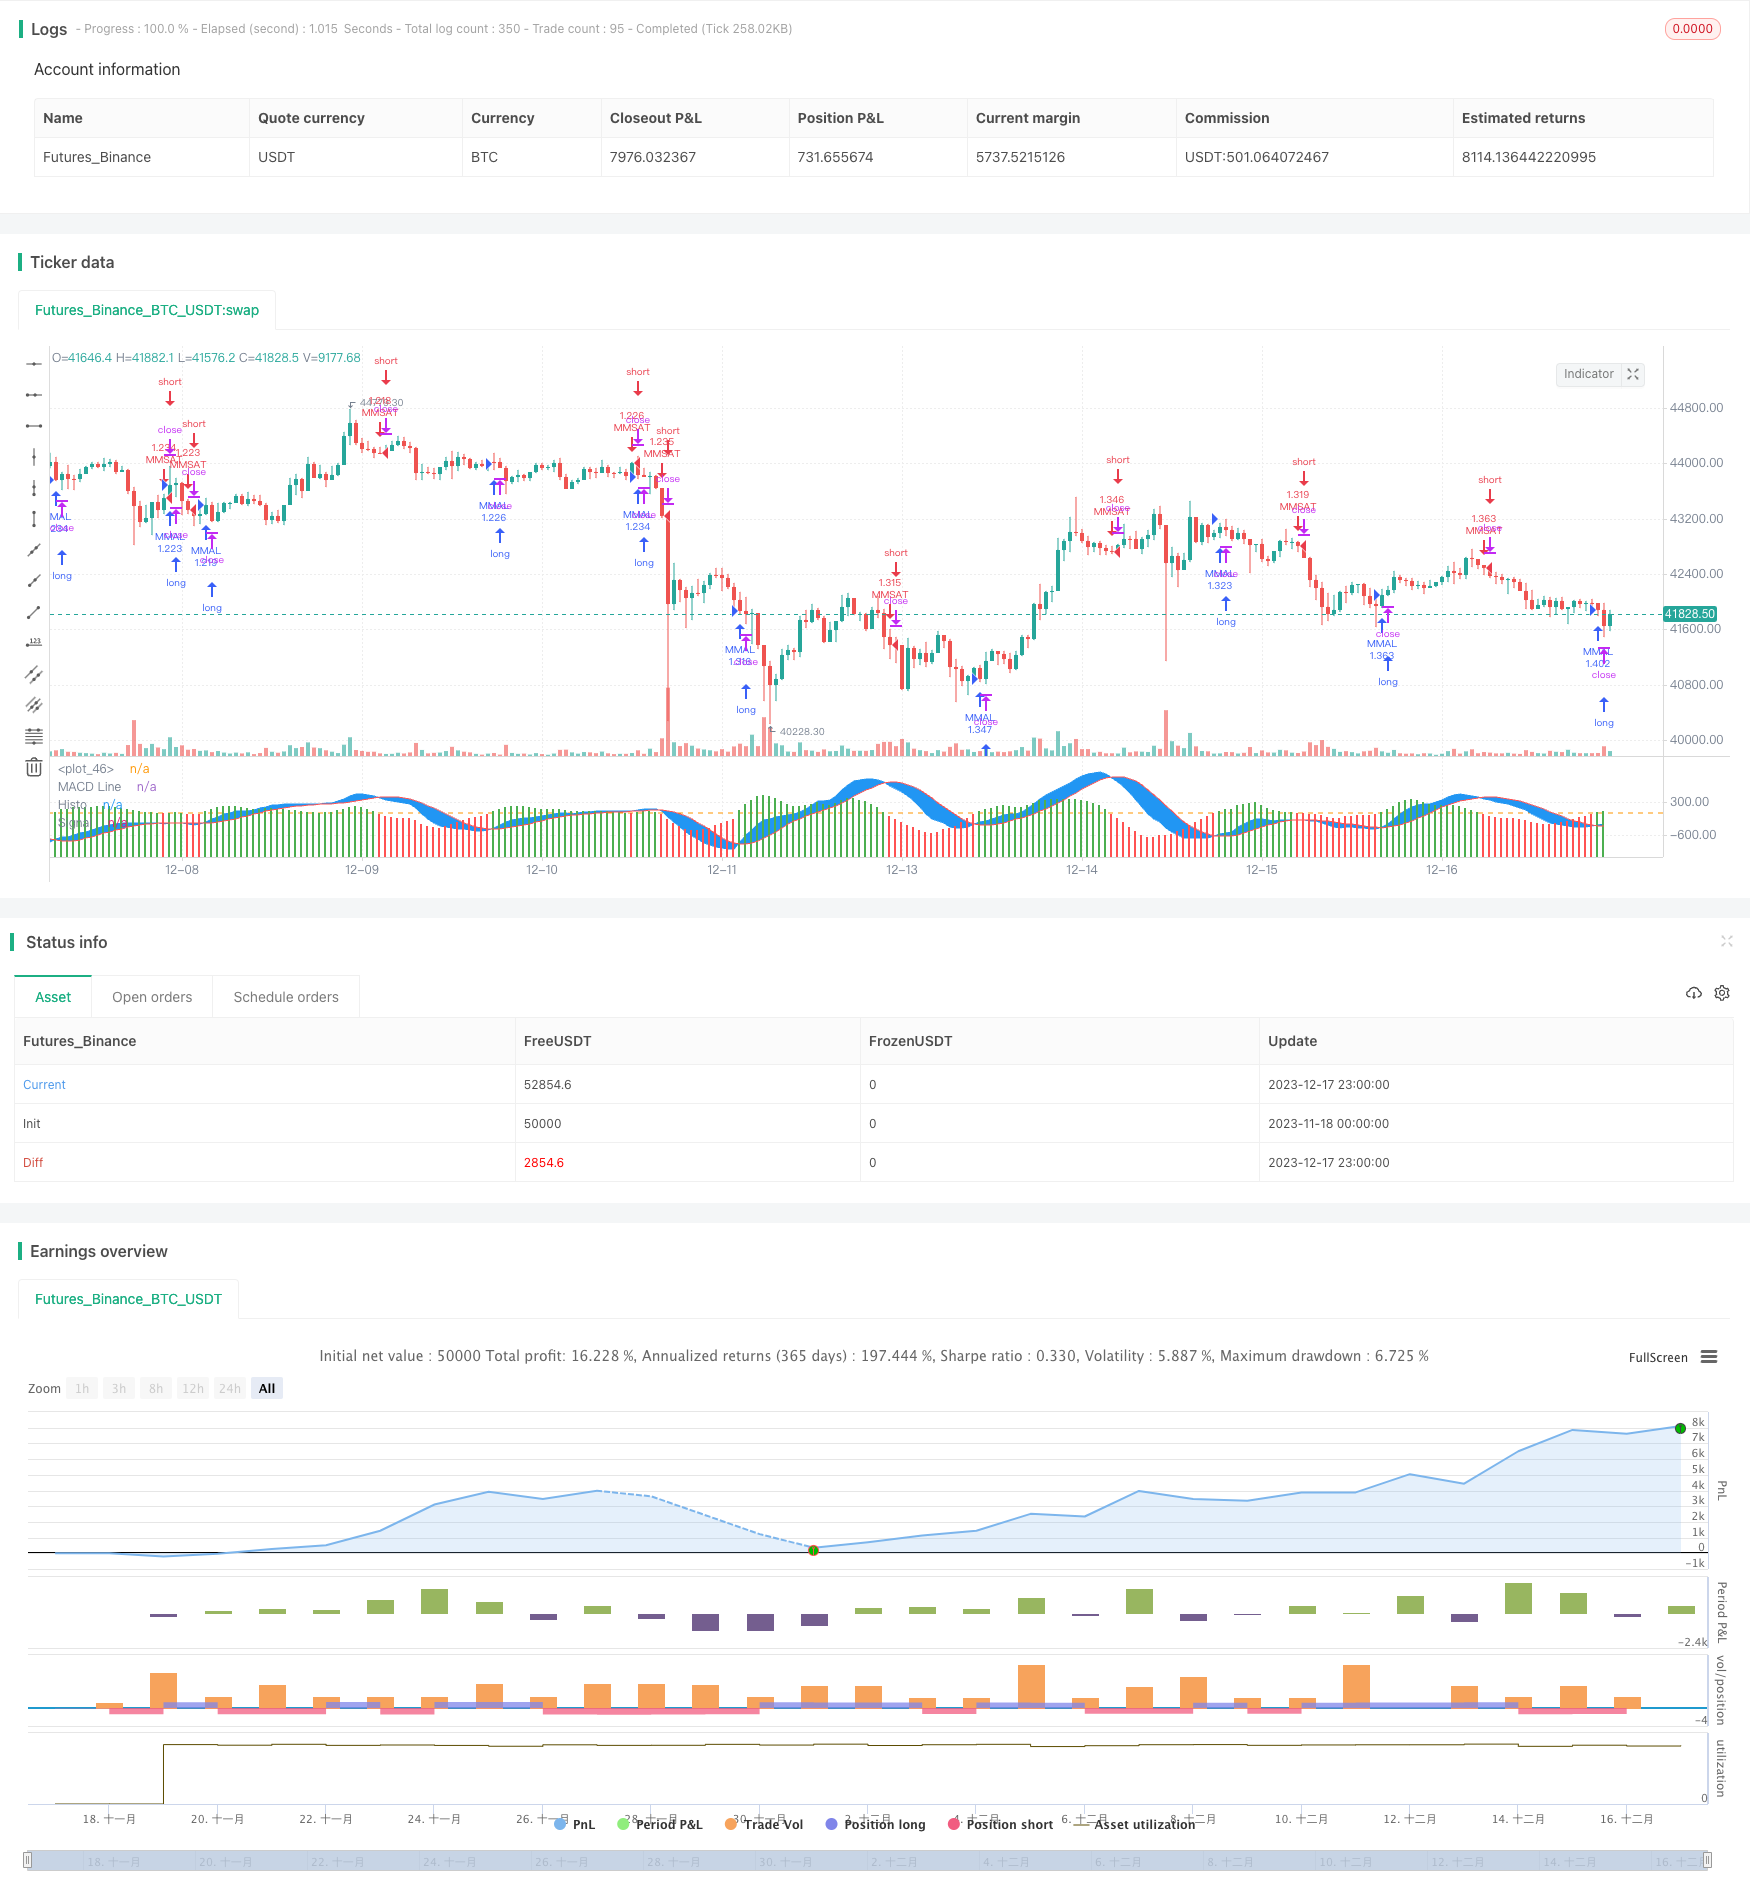
本策略通过计算Heikin-Ashi蜡烛线,平滑K线价格,结合MACD指标发出交易信号,实现追踪中长线趋势的量化交易策略。
-
计算Heikin-Ashi开盘价、收盘价、最高价、最低价,绘制Heikin-Ashi蜡烛线,平滑K线价格走势。
-
设置MACD参数:快线长度12,慢线长度26,信号线长度9。
-
计算DEA慢线、DEA快线和MACD差值。绘制MACD柱状图。
-
当MACD差值上穿0时,做多;当MACD差值下穿0时,做空。
-
设置年、月、日过滤条件,只在指定时间段内交易。
-
Heikin-Ashi蜡烛线可有效滤除市场噪音,识别趋势。
-
MACD可提供较为清晰的趋势买卖点。
-
结合Heikin-Ashi和MACD,可提高买卖点质量,增加获利 trades。
-
设置时间过滤条件,可根据历史数据回测确定最佳交易时段,提高盈利率。
-
趋势反转时,可能出现较大亏损。
-
MACD参数设置不当,可产生过多无效信号。
-
时间过滤条件过于死板,可能漏掉较好交易机会。
对策:
-
设置止损止盈,控制单次亏损。
-
优化MACD参数,确定最佳参数组合。
-
结合其他指标判断局部趋势。
-
测试不同的参数组合,寻找最优参数。
-
增加止损机制,如留出止损/追踪止损。
-
结合EMA、KDJ等指标判断反转点。
-
添加量能指标,避免量能 divergence。
本策略通过计算Heikin-Ashi蜡烛线平滑价格,配合MACD Tradingview指标判断趋势方向和入场点位,实现了一个基于趋势跟踪的量化策略。相比普通MACD策略,它平滑了价格曲线,过滤了部分噪音,可以更清楚判断趋势方向。通过parameter优化、止损机制、和其它指标的组合,可以进一步增强策略的稳定性和盈利能力。
||
This strategy calculates Heikin-Ashi candlesticks to smooth price lines and combines MACD indicator to generate trading signals, implementing a quantitative strategy that tracks medium-to-long term trends.
-
Calculate Heikin-Ashi open, close, high and low prices to plot Heikin-Ashi candlesticks and smooth price trends.
-
Set MACD parameters: fast length 12, slow length 26, signal length 9.
-
Calculate DEA slow line, DEA fast line and MACD histogram. Plot MACD histogram.
-
Go long when MACD histogram crosses above 0; Go short when crossing below 0.
-
Add year, month and day filters to limit trading to specified time range.
-
Heikin-Ashi candlesticks filter out market noise effectively to identify trends.
-
MACD provides clear trend trading signals.
-
Combining Heikin-Ashi and MACD improves signal quality and profitability.
-
Time filters help optimize trading schedule based on historical performance.
-
Potential large losses during trend reversal.
-
Improper MACD parameters may generate excessive worthless signals.
-
Rigid time filters may miss good trading opportunities.
Countermeasures:
-
Set stop loss/take profit to limit losses.
-
Optimize MACD parameters to determine best combination.
-
Add indicators to determine local trends.
-
Test different parameter combinations to find optimum.
-
Add stop loss mechanisms like trailing stop loss.
-
Add indicators like EMA, KDJ to determine reversal points.
-
Add volume indicators to avoid divergence.
This strategy smoothes price action with Heikin-Ashi candlesticks and determines trend direction and entry signals with MACD Tradingview indicator to implement a trend-following quant strategy. Compared with regular MACD strategies, it filters out some noise for clearer trend identification. Further enhancements on parameter optimization, stop loss, and combo indicators can improve its stability and profitability.
[/trans]
Strategy Arguments
| Argument | Default | Description |
|---|---|---|
| v_input_1 | 12 | MACD Fast Line Length |
| v_input_2 | 26 | MACD Slow Line Length |
| v_input_3 | 9 | Signal Line Length |
| v_input_4 | 2020 | yearfrom |
| v_input_5 | 2042 | yearuntil |
| v_input_6 | true | monthfrom |
| v_input_7 | 12 | monthuntil |
| v_input_8 | true | dayfrom |
| v_input_9 | 31 | dayuntil |
Source (PineScript)
/*backtest
start: 2023-11-18 00:00:00
end: 2023-12-18 00:00:00
period: 1h
basePeriod: 15m
exchanges: [{"eid":"Futures_Binance","currency":"BTC_USDT"}]
*/

//@version=4
strategy("MACD ASHI BARS .v1 ", overlay=false,default_qty_type = strategy.percent_of_equity, default_qty_value = 100,commission_type=strategy.commission.percent,commission_value=0.1,slippage=1)

// Calculation HA Values
haopen  = 0.0
haclose = (open + high + low + close) / 4
haopen := na(haopen[1]) ? (open + close) / 2 : (haopen[1] + haclose[1]) / 2
hahigh  = max(high, max(haopen, haclose))
halow   = min(low,  min(haopen, haclose))

// HA colors
hacolor = haclose > haopen ? color.green : color.red
src=haclose


fastmacd = input(12,title='MACD Fast  Line Length')
slowmacd = input(26,title='MACD Slow Line Length')
signalmacd = input(9,title='Signal Line Length')

macdslowline1 = sma(src,slowmacd)
macdslowline2 = sma(macdslowline1,slowmacd)
DEMAslow = ((2 * macdslowline1) - macdslowline2 )

macdfastline1 = sma(src,fastmacd)
macdfastline2 = sma(macdfastline1,fastmacd)
DEMAfast = ((2 * macdfastline1) - macdfastline2)

MACDLine = (DEMAfast - DEMAslow)

SignalLine = sma(MACDLine, signalmacd)

delta = MACDLine-SignalLine


swap1 = delta>0?color.green:color.red


plot(delta,color=swap1,style=plot.style_columns,title='Histo',histbase=0,transp=20)
p1 = plot(MACDLine,color=color.blue,title='MACD Line')
p2 = plot(SignalLine,color=color.red,title='Signal')
fill(p1, p2, color=color.blue)
hline(0)


yearfrom = input(2020)
yearuntil =input(2042)
monthfrom =input(1)
monthuntil =input(12)
dayfrom=input(1)
dayuntil=input(31)


if ( crossover(delta,0)  and   year >= yearfrom and year <= yearuntil and month>=monthfrom and month <=monthuntil and dayofmonth>=dayfrom and dayofmonth < dayuntil)
    strategy.entry("MMAL", strategy.long, stop=close, oca_name="TREND",  comment="AL")

else
    strategy.cancel(id="MMAL")


if (  crossunder(delta,0) and  year >= yearfrom and year <= yearuntil and month>=monthfrom and month <=monthuntil and dayofmonth>=dayfrom and dayofmonth < dayuntil )

    strategy.entry("MMSAT", strategy.short,stop=close, oca_name="TREND",  comment="SAT")
else
    strategy.cancel(id="MMSAT")
Detail
https://www.fmz.com/strategy/435901
Last Modified
2023-12-19 16:14:50