Name
牛市力量交易策略Bull-Power-Trading-Strategy
Author
ChaoZhang
Strategy Description
牛市力量交易策略是基于“公牛熊平衡指标”的一个趋势跟踪策略。该策略通过计算当前K线与前一K线的关系,判断目前的市场是处于多头还是空头的状态,从而进行相应的买入或卖出操作。
该策略的核心指标是value,它通过比较当前K线的收盘价、开盘价、最高价和最低价,来判断市场的多空状态。
具体计算公式如下:
如果收盘价 < 开盘价:
如果前一K线的收盘价 < 当前K线的开盘价:
    value = max(最高价 - 前一K线收盘价,收盘价 - 最低价)
否则:
    value = max(最高价 - 开盘价,收盘价 - 最低价)
如果收盘价 > 开盘价:
如果前一K线的收盘价 > 当前K线的开盘价:
    value = 最高价 - 最低价
否则:
    value = max(开盘价 - 前一K线收盘价,最高价 - 最低价)
如果收盘价 == 开盘价:
如果最高价 - 收盘价 > 收盘价 - 最低价:
    如果前一K线的收盘价 < 当前K线的开盘价:
        value = max(最高价 - 前一K线收盘价,收盘价 - 最低价)
    否则:
        value = 最高价 - 开盘价

如果最高价 - 收盘价 < 收盘价 - 最低价:
    如果前一K线的收盘价 > 当前K线的开盘价:
        value = 最高价 - 最低价
    否则:
        value = max(开盘价 - 前一K线收盘价,最高价 - 最低价)

否则:
    如果前一K线的收盘价 > 当前K线的开盘价:
        value = max(最高价 - 开盘价,收盘价 - 最低价)
    否则:
        value = max(开盘价 - 前一K线收盘价,最高价 - 最低价)
该公式的主要思想是,通过比较价格的大小关系,判断当前K线的多空状态。如果收盘价低于开盘价,代表空头;如果收盘价高于开盘价,代表多头。
将计算出的value值与输入的两个参数SellLevel和BuyLevel进行比较。如果value大于SellLevel,表示市场空头;如果value小于BuyLevel,表示市场多头。
根据比较结果,进行相应的买入或卖出操作。
-
该策略响应迅速,能够快速捕捉趋势的转折点,及时调整仓位。
-
通过动态计算当前K线与前一K线的关系,实时判断市场多空,不依赖固定指标。
-
策略参数较少,SellLevel和BuyLevel直接影响具体的交易逻辑,容易理解和调整。
-
可灵活调整反向交易和正常交易逻辑,适用于不同市场环境。
-
该策略对突发事件反应灵敏,可能会产生过多无效交易。
-
value指标计算复杂,在某些极端情况下会失效,导致错误信号。
-
仅基于一个自定义指标操作,系统性风险较大。
-
未考虑止损逻辑,可能带来较大亏损。
可通过适当放宽买卖条件,加入止损机制,或者与其他指标组合使用来减小这些风险。
-
结合其他指标过滤交易信号,例如MACD、KDJ等,避免错误交易。
-
加入流动性指标,避免高波动期的错位交易。
-
优化参数SellLevel和BuyLevel的设定,适应不同周期和品种。
-
增加止损策略,控制单笔亏损。
-
结合VIX指标判断市场波动率,不同市场环境使用不同参数。
牛市力量交易策略是基于当前K线与前一K线价格关系的实时多空判断指标,能够快速响应市场变化,捕捉趋势转折点。策略简单易于理解和实现,但仅基于一个自定义复杂指标,可通过多种方式进行优化,使其参数更好地适应市场环境,过滤假信号,控制风险。总体来说,该策略适合追求高响应速度的短线操作者。
||
The Bull Power trading strategy is a trend following strategy based on the "Bull and Bear Balance Indicator". By calculating the relationship between the current K-line and previous K-line, the strategy judges whether the current market is bullish or bearish and makes corresponding buy or sell decisions.
The core indicator of this strategy is value. By comparing the close price, open price, highest price and lowest price of the current K-line, it determines the bullish/bearish status of the market.
The specific formula is as below:
If Close < Open:
If Previous Close < Current Open:
    value = max(Highest - Previous Close, Close - Lowest)
Else:
    value = max(Highest - Open, Close - Lowest)
If Close > Open:
If Previous Close > Current Open:
    value = Highest - Lowest
Else:
    value = max(Open - Previous Close, Highest - Lowest)
If Close == Open:
If Highest - Close > Close - Lowest:
    If Previous Close < Current Open:
        value = max(Highest - Previous Close, Close - Lowest)
    Else:
        value = Highest - Open

If Highest - Close < Close - Lowest:
    If Previous Close > Current Open:
        value = Highest - Lowest
    Else:
        value = max(Open - Previous Close, Highest - Lowest)

Else:
    If Previous Close > Current Open:
        value = max(Highest - Open, Close - Lowest)
    Else:
        value = max(Open - Previous Close, Highest - Lowest)
The main idea is to judge the current K-line's bull/bear status by comparing price relationships. If Close < Open, it indicates bearishness. If Close > Open, it indicates bullishness.
Compare the calculated value with input parameters SellLevel and BuyLevel. If value is greater than SellLevel, the market is bearish. If value is less than BuyLevel, the market is bullish.
Make corresponding buy or sell decisions based on the comparison result.
-
The strategy responds quickly and captures trend turning points in a timely manner.
-
It calculates relationship between the current K-line and previous K-line in real time to determine the market condition instead of relying on fixed indicators.
-
The strategy has few parameters which directly affect the trading logic and are easy to understand.
-
It allows flexible configuration of reverse trade logic for different market environments.
-
The strategy is sensitive to sudden events and may generate excessive invalid trades.
-
The value calculation is complex. It may fail in extreme cases and cause wrong signals.
-
It relies solely on a custom complex indicator, resulting in higher systemic risks.
-
No stop loss logic may lead to huge losses.
These risks can be reduced by relaxing buy/sell criteria, adding stop loss mechanisms or combining with other indicators.
-
Incorporate other indicators to filter trade signals, e.g. MACD, KDJ etc.
-
Add liquidity indicator to avoid misaligned trading during high volatility periods.
-
Optimize SellLevel and BuyLevel parameters for different cycles and products.
-
Add stop loss strategy to control single trade loss.
-
Use VIX to determine market volatility and adopt adaptive parameters.
The Bull Power trading strategy makes real-time judgment of market bullish/bearish status based on price relationships between the current K-line and previous K-line. It captures trend changes quickly. The strategy itself is simple to understand but relies solely on a complex custom indicator. It can be optimized in various ways to make parameters adaptive to market conditions, filter false signals and control risks. In summary, this strategy suits short-term traders pursuing high response speed.
[/trans]
Strategy Arguments
| Argument | Default | Description |
|---|---|---|
| v_input_1 | 40 | SellLevel |
| v_input_2 | 3 | BuyLevel |
| v_input_3 | false | Trade reverse |
Source (PineScript)
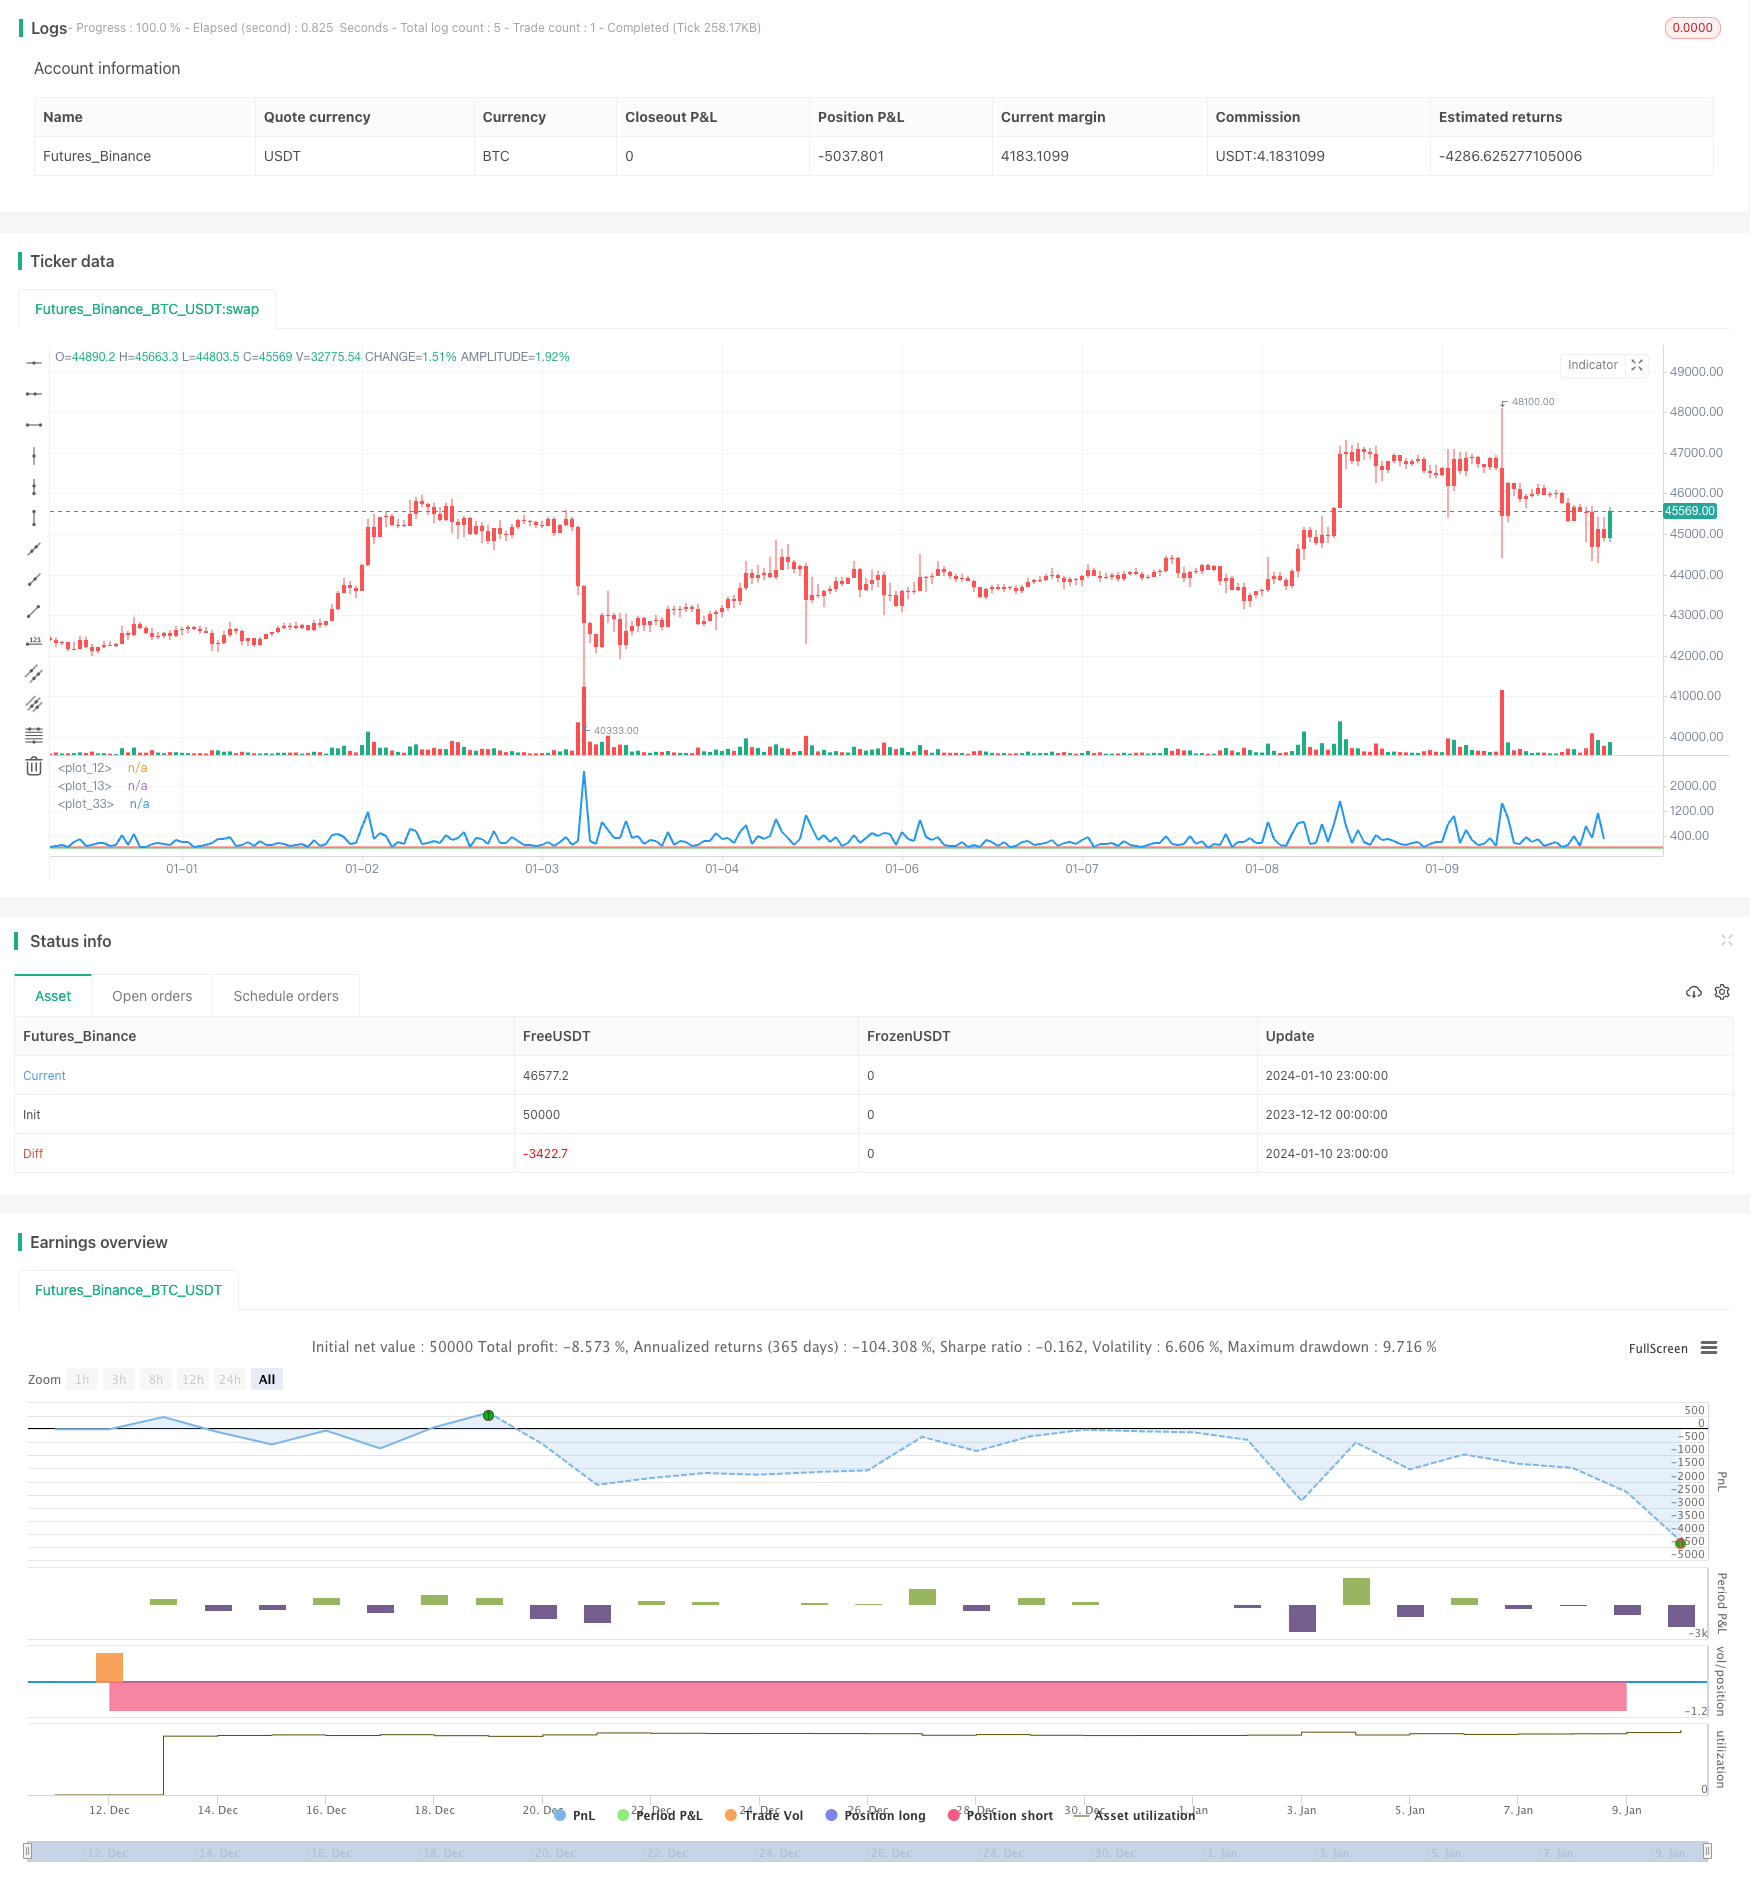
/*backtest
start: 2023-12-12 00:00:00
end: 2024-01-11 00:00:00
period: 1h
basePeriod: 15m
exchanges: [{"eid":"Futures_Binance","currency":"BTC_USDT"}]
*/

//@version=2
////////////////////////////////////////////////////////////
//  Copyright by HPotter v1.0 30/01/2017
//  Bull Power Indicator
//  To get more information please see "Bull And Bear Balance Indicator"
//  by Vadim Gimelfarb.
////////////////////////////////////////////////////////////
strategy(title = "Bull Power Strategy")
SellLevel = input(40, step=0.01)
BuyLevel = input(3, step=0.01)
reverse = input(false, title="Trade reverse")
hline(SellLevel, color=red, linestyle=line)
hline(BuyLevel, color=green, linestyle=line)
value = iff (close < open ,
         iff (close[1] < open ,  max(high - close[1], close - low), max(high - open, close - low)),
          iff (close > open,
           iff(close[1] > open,  high - low, max(open - close[1], high - low)),
             iff(high - close > close - low,
              iff (close[1] < open, max(high - close[1], close - low), high - open),
               iff (high - close < close - low,
                 iff(close[1] > open,  high - low, max(open - close, high - low)),
                  iff (close[1] > open, max(high - open, close - low),
                   iff(close[1] < open, max(open - close, high - low), high - low))))))
pos = iff(value > SellLevel, -1,
	     iff(value <= BuyLevel, 1, nz(pos[1], 0)))
possig = iff(reverse and pos == 1, -1,
          iff(reverse and pos == -1, 1, pos))
if (possig == -1)
    strategy.entry("Short", strategy.short)
if (possig == 1)
    strategy.entry("Long", strategy.long)
barcolor(possig == -1 ? red: possig == 1 ? green : blue )
plot(value, style=line, linewidth=2, color=blue)
Detail
https://www.fmz.com/strategy/438467
Last Modified
2024-01-12 12:02:49