Name
玛雅寻宝指南Mayan-Treasure-Hunting-Guide
Author
ChaoZhang
Strategy Description
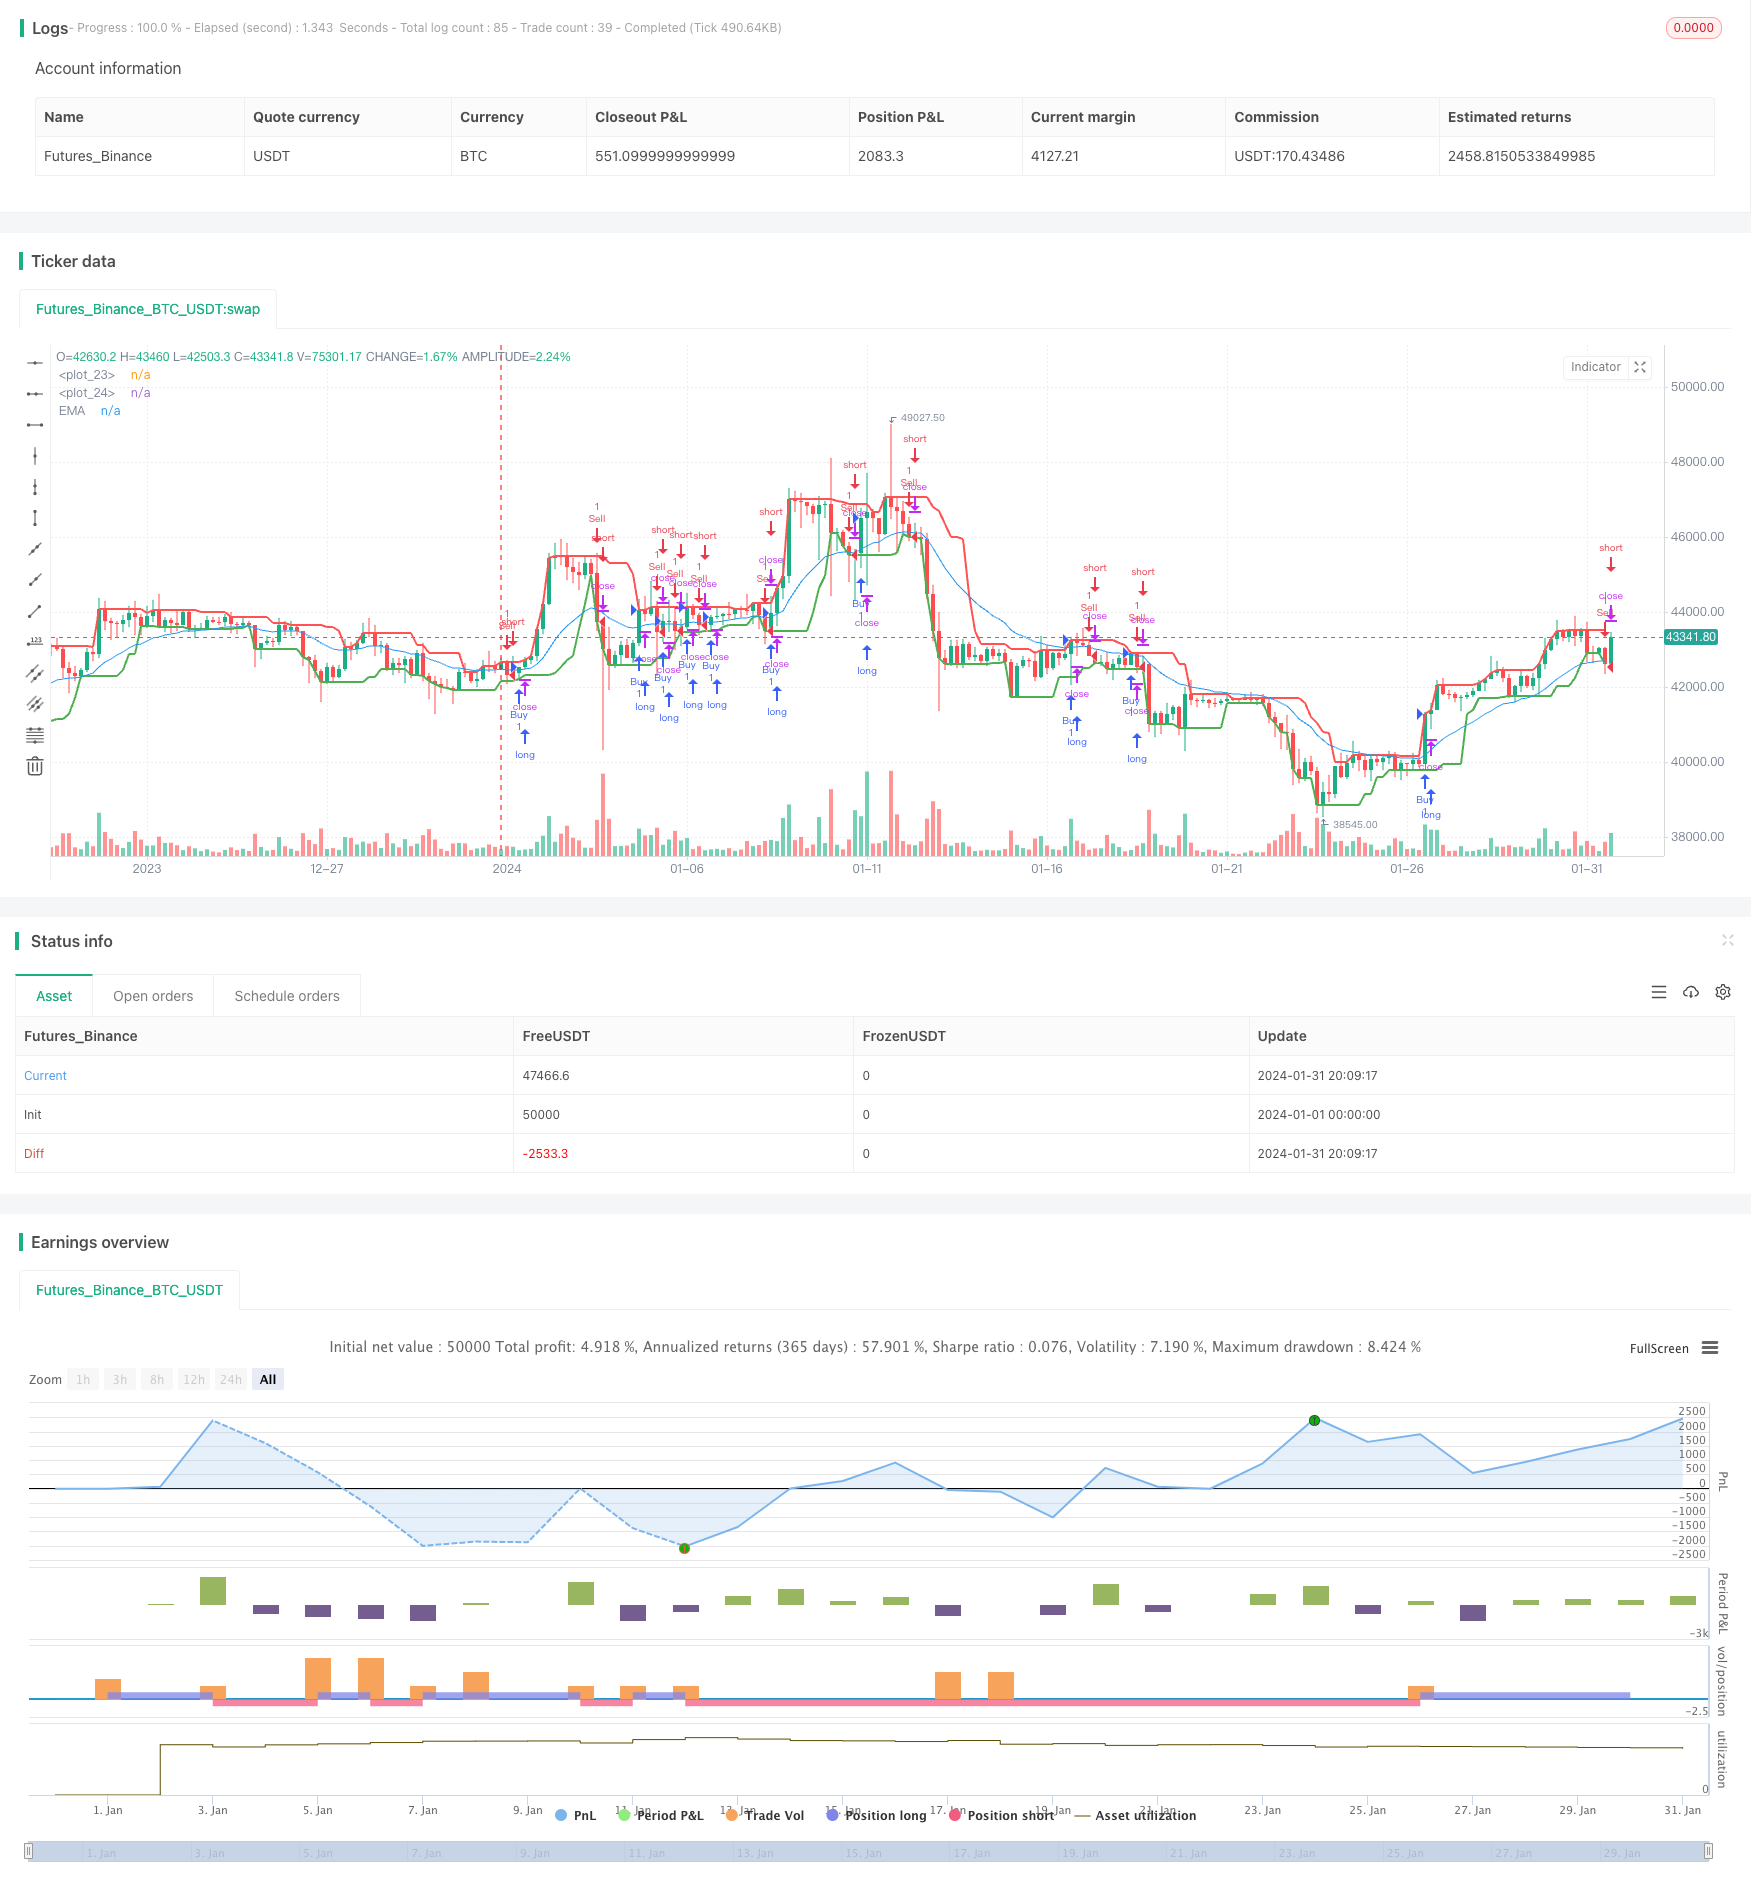
玛雅寻宝指南是一个基于EMA指标的简单股票交易策略。该策略结合了EMA均线指标和价格高低点判断,设定买入和卖出条件,实现自动化交易。
该策略的核心依据是EMA均线指标。EMA即指数移动平均线,是一种常用的趋势判断指标。EMA线能平滑价格波动,判断价格趋势方向。
当股价上涨时会站上EMA线,这时视为买入信号。当股价下跌时会站在EMA线下方,这时作为卖出信号。本策略设置20日EMA线作为判断依据。
此外,策略还结合价格当日最高价和最低价进行辅助判断。在EMA金叉时刻,如果收盘价低于当日最高价,则产生买入信号;如果收盘价高于当日最低价,则产生卖出信号。这可以过滤掉部分不稳定的交易信号。
该策略优势主要体现在利用EMA指标判断主要买卖点上。EMA指标是一种常用且实用的技术指标,可以有效平滑价格波动,判断大致的股价走势。相比复杂指标,EMA简单且直观,容易实现自动化交易。
此外,结合当日高低点进行辅助判断,可以进一步提高信号质量,过滤掉部分假信号。这种组合使用技术指标的思想值得推广应用。
总体来说,该策略简单实用,容易理解和使用,非常适合量化交易的自动化实现。这是该策略的最大优势。
尽管该策略使用简单有效的EMA指标,但任何技术指标都可能出现失效情况。特别是在价格剧烈波动时,EMA线可能产生滞后,导致交易信号延迟,从而错过最佳买卖时机。这是该策略面临的主要风险。
此外,辅助判断条件虽可过滤假信号,但也可能过滤掉部分真实信号,导致获得信号不足的情况。这同样会影响策略效果。
最后,该策略仅基于技术指标设计交易规则,没有考虑基本面因素。如果公司基本面发生重大变化,行情可能出现技术指标无法预测的大幅波动。这时策略交易信号可能完全失效。
该策略可从以下几个方面进行优化:
-
调整EMA参数,适应更多行情环境。可以设置自适应EMA长度,根据市场波动程度动态调整。
-
增加其他技术指标进行组合。比如加入 MACD 指标判断买卖点,提高信号准确性。或使用 K 线形态等图形指标进行辅助。
-
增加机器学习模型预测行情,辅助人工智能判断买卖点。这可以克服纯规则交易的局限性。
-
考虑公司基本面和宏观政策面。加入这些因素后,策略可以应对更复杂的行情环境。
玛雅寻宝指南是一个简单直观的股市交易策略。它使用广泛认可的EMA均线指标判断价格趋势、确认交易信号。同时辅以价格高低点进行过滤提高信号质量。该策略容易理解使用,适合自动化量化交易。但也存在技术指标失效等潜在风险。未来可从调参优化、增强信号、引入机器学习等多个角度进行改进,使策略效果更佳。
||
The Mayan Treasure Hunting Guide is a simple stock trading strategy based on the EMA indicator. The strategy combines the EMA line indicator and price highs and lows to set buy and sell conditions for automated trading.
The core of this strategy relies on the EMA indicator. EMA stands for Exponential Moving Average, which is a commonly used trend judgment indicator. The EMA line can smooth price fluctuations and determine the direction of the price trend.
When stock prices rise, they will stand above the EMA line, which is considered a buy signal. When prices fall, they will stand below the EMA line as a sell signal. This strategy sets a 20-day EMA line as the decision benchmark.
In addition, the strategy also combines the highest and lowest prices of the day to assist in judgment. At the moment of the EMA golden cross, if the closing price is lower than the highest price of the day, a buy signal is generated; if the closing price is higher than the lowest price of the day, a sell signal is generated. This filters out some unstable trading signals.
The main advantage of this strategy lies in using the EMA indicator to determine the main buy and sell points. The EMA indicator is a commonly used and practical technical indicator that can effectively smooth price fluctuations and determine the general trend of stock prices. Compared to complex indicators, the EMA is simple and intuitive, easy to implement for automated trading.
In addition, combining intraday highs and lows for auxiliary judgment can further improve signal quality and filter out some false signals. This idea of combining technical indicators is worth promoting.
Overall, this strategy is simple, practical, easy to understand and use, and highly suitable for automated implementation in quantitative trading. This is the biggest advantage of the strategy.
Although the strategy uses a simple and effective EMA indicator, any technical indicator may fail at times. Especially in times of violent price fluctuations, EMA lines can lag, leading to delayed trading signals and thus missing the best buy and sell timing. This is the main risk facing the strategy.
In addition, although the auxiliary judgment conditions can filter out false signals, it may also filter out some real signals, resulting in insufficient signals. This will also affect strategy performance.
Finally, the strategy is designed solely on technical indicator rules without considering fundamentals. If the company's fundamentals change dramatically, the market may see large, unpredictable moves that technical indicators fail to foresee. The trading signals from the strategy can become completely invalid.
The strategy can be optimized in the following aspects:
-
Adjust EMA parameters to adapt to more market conditions. Adaptive EMA lengths can be set based on the degree of market volatility.
-
Increase other technical indicators for combination. For example, adding the MACD indicator to determine buy and sell points can improve signal accuracy. Or use graphical indicators like candlestick patterns for assistance.
-
Increase machine learning models to predict market conditions and aid in AI judgment of buy and sell points. This can overcome the limitations of pure rules-based trading.
-
Consider company fundamentals and macro policies. Adding these factors allows strategies to cope with more complex market conditions.
The Mayan Treasure Hunting Guide is a simple and intuitive stock trading strategy. It uses the widely recognized EMA line to determine price trends and confirm trading signals. At the same time, it uses price highs and lows to filter and improve signal quality. The strategy is easy to understand and use, suitable for automated quantitative trading. But it also has potential risks such as technical indicator failure. Future improvements can be made from multiple perspectives like parameter tuning, signal enhancement, and introducing machine learning to improve strategy effectiveness.
[/trans]
Strategy Arguments
| Argument | Default | Description |
|---|---|---|
| v_input_int_1 | 20 | Length |
| v_input_1_close | 0 | Source: close |
Source (PineScript)
/*backtest
start: 2024-01-01 00:00:00
end: 2024-01-31 23:59:59
period: 4h
basePeriod: 15m
exchanges: [{"eid":"Futures_Binance","currency":"BTC_USDT"}]
*/

// This Pine Script™ code is subject to the terms of the Mozilla Public License 2.0 at https://mozilla.org/MPL/2.0/
// © alex-aftc


//@version=5
strategy("Megalodon", shorttitle="Megalodon", overlay=true)

// Parámetros de la EMA
length = input.int(20, minval=1, title="Length")
src = input(close, title="Source")

// Calcular la EMA
ema = ta.ema(src, length)

// Plot de la EMA
plot(ema, title="EMA", color=color.blue)

// Encontrar los puntos más altos y más bajos
last8h = ta.highest(close, 8)
lastl8 = ta.lowest(close, 8)

// Plot de los puntos más altos y más bajos
plot(last8h, color=color.red, linewidth=2)
plot(lastl8, color=color.green, linewidth=2)

// Condiciones de compra y venta
buy_condition = ta.cross(close, ema) == 1 and close[1] < close
sell_condition = ta.cross(close, ema) == 1 and close[1] > close

// Estrategia de trading
strategy.entry("Buy", strategy.long, when=buy_condition)
strategy.entry("Sell", strategy.short, when=sell_condition)
Detail
https://www.fmz.com/strategy/442961
Last Modified
2024-02-27 16:33:02