Name
玻尔钢带动量趋势跟踪策略Bollinger-Bands-Momentum-Trend-Following-Strategy
Author
ChaoZhang
Strategy Description
该策略基于玻尔钢带、移动平均线和成交量分析实现了一个稳健的趋势跟踪策略。该策略旨在捕捉潜在的趋势反转并利用市场动量获利。
玻尔钢带
-
利用玻尔钢带识别市场的超买超卖状态。通过上下轨的清晰视觉化辅助决策。
-
玻尔钢带的基本原理是根据一定周期内的股价中值及标准差计算出上下轨。股价上穿上轨为超买信号,下破下轨为超卖信号。
移动平均线过滤器
-
实现移动平均线过滤器以增强趋势识别。用户可以选择不同类型的移动平均线,如简单移动平均线、指数移动平均线和加权移动平均线。
-
当价格上穿(下破)移动平均线时产生买入(卖出)信号。
成交量分析
-
允许用户将成交量分析融入策略中以进行信号确认。不同颜色的量柱表示成交量高于或低于平均值。
-
成交量突破平均线可用来确认价格信号。
稳健的趋势跟踪策略
-
基于玻尔钢带、移动平均线和成交量识别市场趋势反转。
-
能够及时捕捉价格趋势,跟踪趋势获利。
灵活性与定制化
-
用户可以选择玻尔钢带参数、移动平均线类型及长度进行优化。
-
长仓和空仓仓位可单独控制。
可视化与确认
-
双重信号机制,通过移动平均线和成交量确认玻尔钢带价格信号。
-
直观展示移动平均线、止损线等交易信号。
风险管理
-
基于ATR计算止损位。可自定义ATR周期及止损ATR倍数。
-
根据持仓风险百分比调整仓位大小。有效控制单笔损失。
回测周期风险
- 不同的历史周期可能对策略表现产生影响。应当在不同周期内进行回测以确保策略稳健性。
趋势反转风险
- 在震荡行情中,频繁触发止损。可通过优化移动平均线参数降低此风险。
超优化风险
- 多参数优化可能导致过度优化,应当采用多组参数组合并进行稳健性检验。
技术指标延迟风险
- 指标计算存在一定延迟,应结合价格实体判断,不能完全依赖指标。
参数优化
- 优化玻尔钢带参数、移动平均线类型和ATR参数以适应不同品种和周期。
仓位优化
- 测试不同的持仓风险百分比水平,优化止损倍数。
信号优化
- 测试增加其它辅助指标过滤信号,如KD,MACD等。
代码优化
- 优化信号判断逻辑,减少不必要开仓。采用面向对象编程提高可扩展性。
该策略整合玻尔钢带、移动平均线和成交量分析构建了一个跟踪趋势的机械交易系统。策略优势在于信号确认机制强大、风险控制到位。后续可通过参数和信号优化提高策略稳定性和盈利能力。该策略可为投资者追捧潮流提供方法论参考。
||
This strategy implements a robust trend-following strategy based on Bollinger Bands, moving averages, and volume analysis. It aims to capture potential trend reversals and capitalize on market momentum.
Bollinger Bands
-
Utilizes Bollinger Bands to identify overbought and oversold conditions in the market. Provides clear upper and lower band visualizations to aid decision-making.
-
Calculates bands based on the middle value and standard deviation over a certain period. Price crossing upper or lower band indicates overbought or oversold signals.
Moving Average Filter
-
Implements a moving average (MA) filter to enhance trend identification. Users can choose from various MA types including Simple, Exponential, Weighted.
-
Generates buy (sell) signals when price crosses above (below) moving average.
Volume Analysis
-
Allows users to integrate volume analysis into the strategy for enhanced signal confirmation. Color-coded volume bars indicate whether volume is above or below the average.
-
Volume crossing average can be used to confirm price signals.
Robust Trend Following
-
Identifies market trend reversals based on Bollinger Bands, moving averages and volume.
-
Captures price trends in a timely manner for trend trading.
Flexibility & Customization
-
Users can optimize parameters like BB period, MA type and length.
-
Long and short positions can be controlled separately.
Visualization & Confirmation
-
Dual signal mechanism confirming price signals using MA and volume.
-
Intuitive display of key trading signals like moving averages, stop-loss levels.
Risk Management
-
Calculates stop-loss based on ATR. Customizable ATR period and multiplier.
-
Adjusts position size based on percentage of equity at risk to control single trade loss.
Backtest Period Risks
- Performance may vary across different historical periods. Robustness should be validated via multi-period backtests.
Trend Reversal Risks
- Increased stop-loss triggers during range-bound markets. Can be mitigated by optimizing MA parameters.
Over-optimization
- Multi-parameter optimization may lead to overfitting. Robustness should be verified across different parameter sets.
Lagging Indicator Risks
- Indicators have inherent lag. Price action should supplement indicator signals.
Parameter Optimization
- Optimize BB, MA, ATR parameters for different products and timeframes.
Position Optimization
- Test different equity percentage at risk levels, stop-loss multipliers.
Signal Optimization
- Introduce additional filters like KD, MACD to supplement entry and exit signals.
Code Optimization
- Refine signal logic to avoid unnecessary trades. Adopt OOP for extensibility.
The strategy integrates Bollinger Bands, moving averages and volume analysis into a mechanical trend trading system. Its strength lies within robust signal confirmation and risk control mechanisms. Further improvements can be made via parameter and signal optimization to enhance stability and profitability. The strategy methodology serves as a reference for trend followers.
[/trans]
Strategy Arguments
| Argument | Default | Description |
|---|---|---|
| v_input_int_3 | false | Offset |
| v_input_bool_1 | true | (?Backtest Time Period)Filter Date Range of Backtest |
| v_input_1 | timestamp(1 jan 2017) | Start Date |
| v_input_2 | timestamp(1 jul 2100) | End Date |
| v_input_bool_2 | true | (?Long & Short Position)On/Off Long Postion |
| v_input_bool_3 | true | On/Off Short Postion |
| v_input_string_1 | 0 | (?MA)MA Type: WMA |
| v_input_int_1 | 99 | MA Lenght |
| v_input_3_close | 0 | MA Source: close |
| v_input_int_2 | 20 | (?BB)length |
| v_input_4_close | 0 | Source: close |
| v_input_float_1 | 2 | StdDev |
| v_input_bool_4 | false | (?Volume Inputs)Use Volume Filter? |
| v_input_int_4 | 30 | MA length |
| v_input_int_5 | 3 | Width of volume bars |
| v_input_bool_5 | false | Color bars? |
| v_input_int_6 | 14 | (?Risk Management Inputs)ATR Length |
| v_input_float_2 | 2 | Long Position - Stop Loss - ATR Multiplier |
| v_input_float_3 | 2 | Short Position - Stop Loss - ATR Multiplier |
| v_input_float_4 | 2 | % of Equity at Risk |
Source (PineScript)
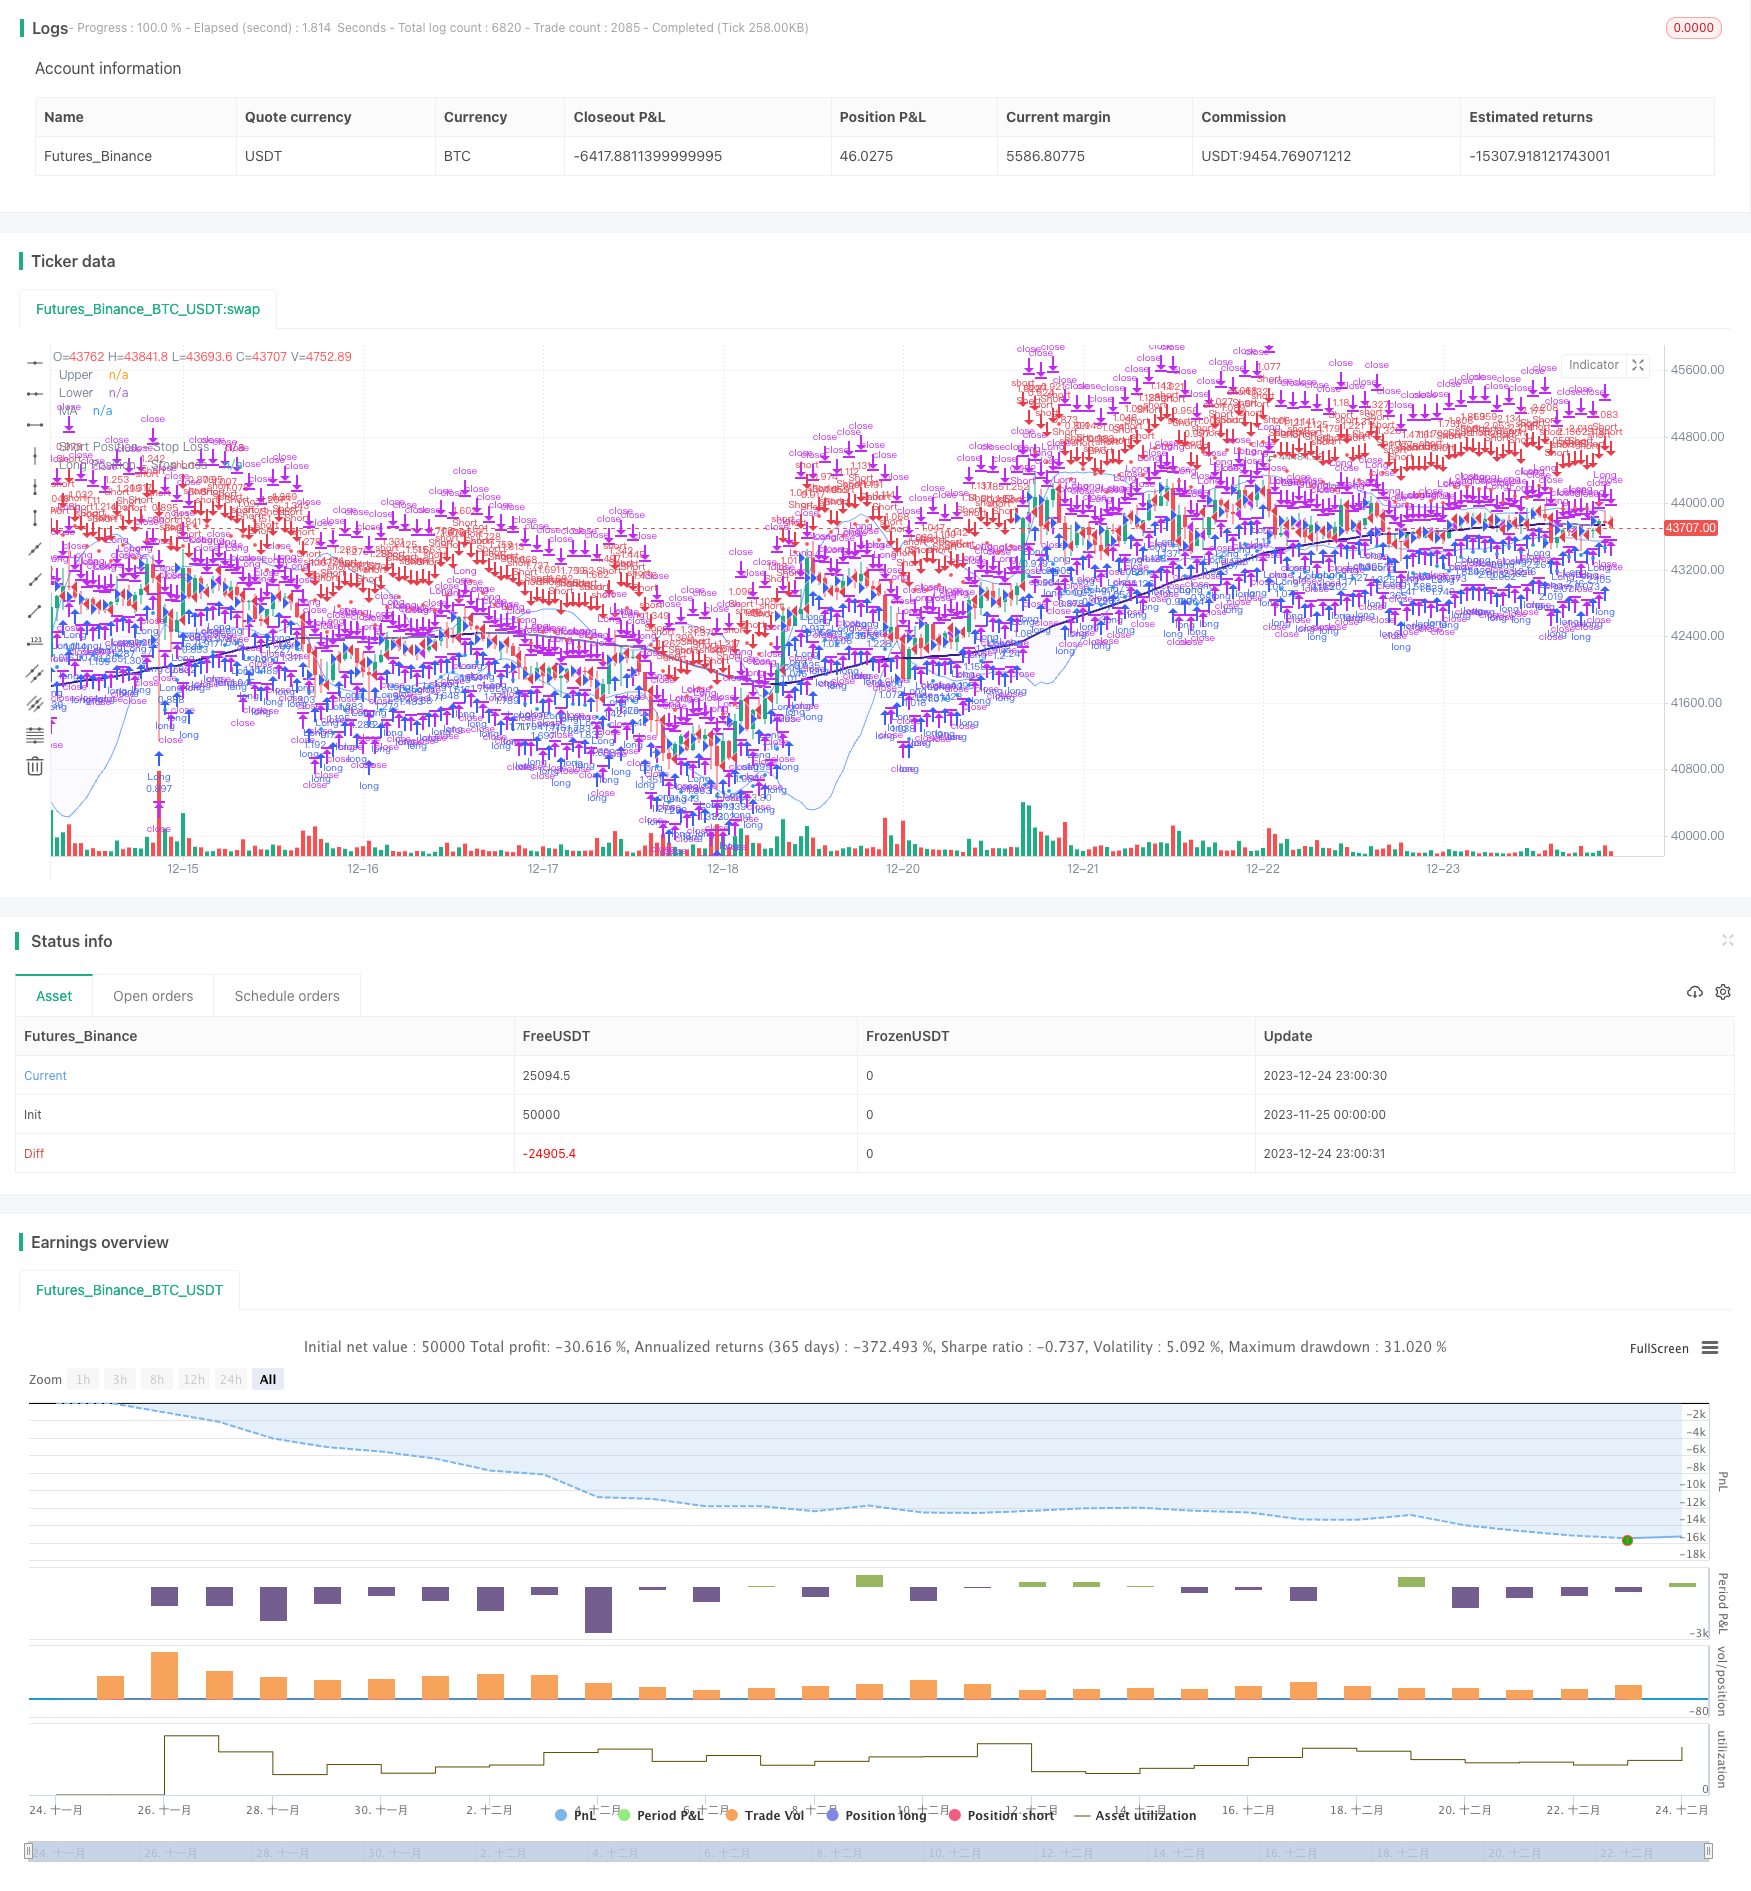
/*backtest
start: 2023-11-25 00:00:00
end: 2023-12-25 00:00:00
period: 1h
basePeriod: 15m
exchanges: [{"eid":"Futures_Binance","currency":"BTC_USDT"}]
*/

// This source code is subject to the terms of the Mozilla Public License 2.0 at https://mozilla.org/MPL/2.0/
// © sosacur01

//@version=5
strategy(title="Bollinger Band | Trend Following", overlay=true, pyramiding=1, commission_type=strategy.commission.percent, commission_value=0.2, initial_capital=10000)

//--------------------------------------

//BACKTEST RANGE
useDateFilter = input.bool(true, title="Filter Date Range of Backtest",
     group="Backtest Time Period")
backtestStartDate = input(timestamp("1 jan 2017"),
     title="Start Date", group="Backtest Time Period",
     tooltip="This start date is in the time zone of the exchange " +
     "where the chart's instrument trades. It doesn't use the time " +
     "zone of the chart or of your computer.")
backtestEndDate = input(timestamp("1 jul 2100"),
     title="End Date", group="Backtest Time Period",
     tooltip="This end date is in the time zone of the exchange " +
     "where the chart's instrument trades. It doesn't use the time " +
     "zone of the chart or of your computer.")
inTradeWindow = true
if not inTradeWindow and inTradeWindow[1]
    strategy.cancel_all()
    strategy.close_all(comment="Date Range Exit")

//--------------------------------------

//LONG/SHORT POSITION ON/OFF INPUT
LongPositions   = input.bool(title='On/Off Long Postion', defval=true, group="Long & Short Position")
ShortPositions  = input.bool(title='On/Off Short Postion', defval=true, group="Long & Short Position")

//--------------------------------------
//MA INPUTS
averageType1    = input.string(defval="WMA", group="MA", title="MA Type", options=["SMA", "EMA", "WMA", "HMA", "RMA", "SWMA", "ALMA", "VWMA", "VWAP"])
averageLength1  = input.int(defval=99, title="MA Lenght", group="MA")
averageSource1  = input(close, title="MA Source", group="MA")

//MA TYPE
MovAvgType1(averageType1, averageSource1, averageLength1) =>
	switch str.upper(averageType1)
        "SMA"  => ta.sma(averageSource1, averageLength1)
        "EMA"  => ta.ema(averageSource1, averageLength1)
        "WMA"  => ta.wma(averageSource1, averageLength1)
        "HMA"  => ta.hma(averageSource1, averageLength1)
        "RMA"  => ta.rma(averageSource1, averageLength1)
        "SWMA" => ta.swma(averageSource1)
        "ALMA" => ta.alma(averageSource1, averageLength1, 0.85, 6)
        "VWMA" => ta.vwma(averageSource1, averageLength1)
        "VWAP" => ta.vwap(averageSource1)
        => runtime.error("Moving average type '" + averageType1 +
             "' not found!"), na


//MA VALUES
ma  = MovAvgType1(averageType1, averageSource1, averageLength1)

//MA CONDITIONS
bullish_ma = close > ma
bearish_ma = close < ma

//PLOT COLOR
ma_plot    = if close > ma
    color.navy
else
    color.rgb(49, 27, 146, 40)

//MA PLOT
plot(ma,color=ma_plot, linewidth=2, title="MA")

//--------------------------------------
//BB INPUTS
length  = input.int(20, minval=1, group="BB")
src     = input(close, title="Source", group="BB")
mult    = input.float(2.0, minval=0.001, maxval=50, title="StdDev", group="BB")

//BB VALUES
basis = ta.sma(src, length)
dev = mult * ta.stdev(src, length)
upper = basis + dev
lower = basis - dev
offset = input.int(0, "Offset", minval = -500, maxval = 500)

//BBPLOT
//plot(basis, "Basis", color=#FF6D00, offset = offset)
p1 = plot(upper, "Upper", color=#2978ffa4, offset = offset)
p2 = plot(lower, "Lower", color=#2978ffa4, offset = offset)
fill(p1, p2, title = "Background", color=color.rgb(33, 47, 243, 97))

//BB ENTRY AND EXIT CONDITIONS
bb_long_entry  = close >= upper
bb_long_exit   = close <= lower
bb_short_entry = close <= lower
bb_short_exit  = close >= upper

//---------------------------------------------------------------
//VOLUME INPUTS
useVolumefilter  = input.bool(title='Use Volume Filter?', defval=false, group="Volume Inputs")
dailyLength      = input.int(title = "MA length", defval = 30, minval = 1, maxval = 100, group = "Volume Inputs")
lineWidth        = input.int(title = "Width of volume bars", defval = 3, minval = 1, maxval = 6, group = "Volume Inputs")
Volumefilter_display  = input.bool(title="Color bars?", defval=false, group="Volume Inputs", tooltip = "Change bar colors when Volume is above average")

//VOLUME VALUES
volumeAvgDaily = ta.sma(volume, dailyLength)

//VOLUME SIGNAL
v_trigger  = (useVolumefilter ? volume > volumeAvgDaily : inTradeWindow)

//PLOT VOLUME SIGNAL
barcolor(Volumefilter_display ? v_trigger ? color.new(#6fe477, 77):na: na, title="Volume Filter")
//---------------------------------------------------------------

//ENTRIES AND EXITS
long_entry  = if inTradeWindow and bullish_ma and bb_long_entry and v_trigger and LongPositions
    true
long_exit   = if inTradeWindow and bb_long_exit
    true

short_entry = if inTradeWindow  and bearish_ma and bb_short_entry and v_trigger and ShortPositions
    true
short_exit  = if inTradeWindow  and bb_short_exit
    true

//--------------------------------------

//RISK MANAGEMENT - SL, MONEY AT RISK, POSITION SIZING
atrPeriod                = input.int(14, "ATR Length", group="Risk Management Inputs")
sl_atr_multiplier        = input.float(title="Long Position - Stop Loss - ATR Multiplier", defval=2, group="Risk Management Inputs", step=0.5)
sl_atr_multiplier_short  = input.float(title="Short Position - Stop Loss - ATR Multiplier", defval=2, group="Risk Management Inputs", step=0.5)
i_pctStop                = input.float(2, title="% of Equity at Risk", step=.5, group="Risk Management Inputs")/100

//ATR VALUE
_atr = ta.atr(atrPeriod)

//CALCULATE LAST ENTRY PRICE
lastEntryPrice = strategy.opentrades.entry_price(strategy.opentrades - 1)

//STOP LOSS - LONG POSITIONS
var float sl = na

//CALCULTE SL WITH ATR AT ENTRY PRICE - LONG POSITION
if (strategy.position_size[1] != strategy.position_size)
    sl := lastEntryPrice - (_atr * sl_atr_multiplier)

//IN TRADE - LONG POSITIONS
inTrade = strategy.position_size > 0

//PLOT SL - LONG POSITIONS
plot(inTrade ? sl : na, color=color.blue, style=plot.style_circles, title="Long Position - Stop Loss")

//CALCULATE ORDER SIZE - LONG POSITIONS
positionSize = (strategy.equity * i_pctStop) / (_atr * sl_atr_multiplier)

//============================================================================================

//STOP LOSS - SHORT POSITIONS
var float sl_short = na

//CALCULTE SL WITH ATR AT ENTRY PRICE - SHORT POSITIONS
if (strategy.position_size[1] != strategy.position_size)
    sl_short := lastEntryPrice + (_atr * sl_atr_multiplier_short)

//IN TRADE SHORT POSITIONS
inTrade_short = strategy.position_size < 0

//PLOT SL - SHORT POSITIONS
plot(inTrade_short ? sl_short : na, color=color.red, style=plot.style_circles, title="Short Position - Stop Loss")

//CALCULATE ORDER - SHORT POSITIONS
positionSize_short = (strategy.equity * i_pctStop) / (_atr * sl_atr_multiplier_short)


//===============================================

//LONG STRATEGY
strategy.entry("Long", strategy.long, comment="Long", when = long_entry, qty=positionSize)
if (strategy.position_size > 0)
    strategy.close("Long", when = (long_exit), comment="Close Long")
    strategy.exit("Long", stop = sl, comment="Exit Long")

//SHORT STRATEGY
strategy.entry("Short", strategy.short, comment="Short", when = short_entry, qty=positionSize_short)
if (strategy.position_size < 0)
    strategy.close("Short", when = (short_exit), comment="Close Short")
    strategy.exit("Short", stop = sl_short, comment="Exit Short")

//ONE DIRECTION TRADING COMMAND (BELLOW ONLY ACTIVATE TO CORRECT BUGS)
//strategy.risk.allow_entry_in(strategy.direction.long)
Detail
https://www.fmz.com/strategy/436609
Last Modified
2023-12-26 11:21:10