Name
相对量指标策略The-Relative-Volume-Indicator-Strategy
Author
ChaoZhang
Strategy Description
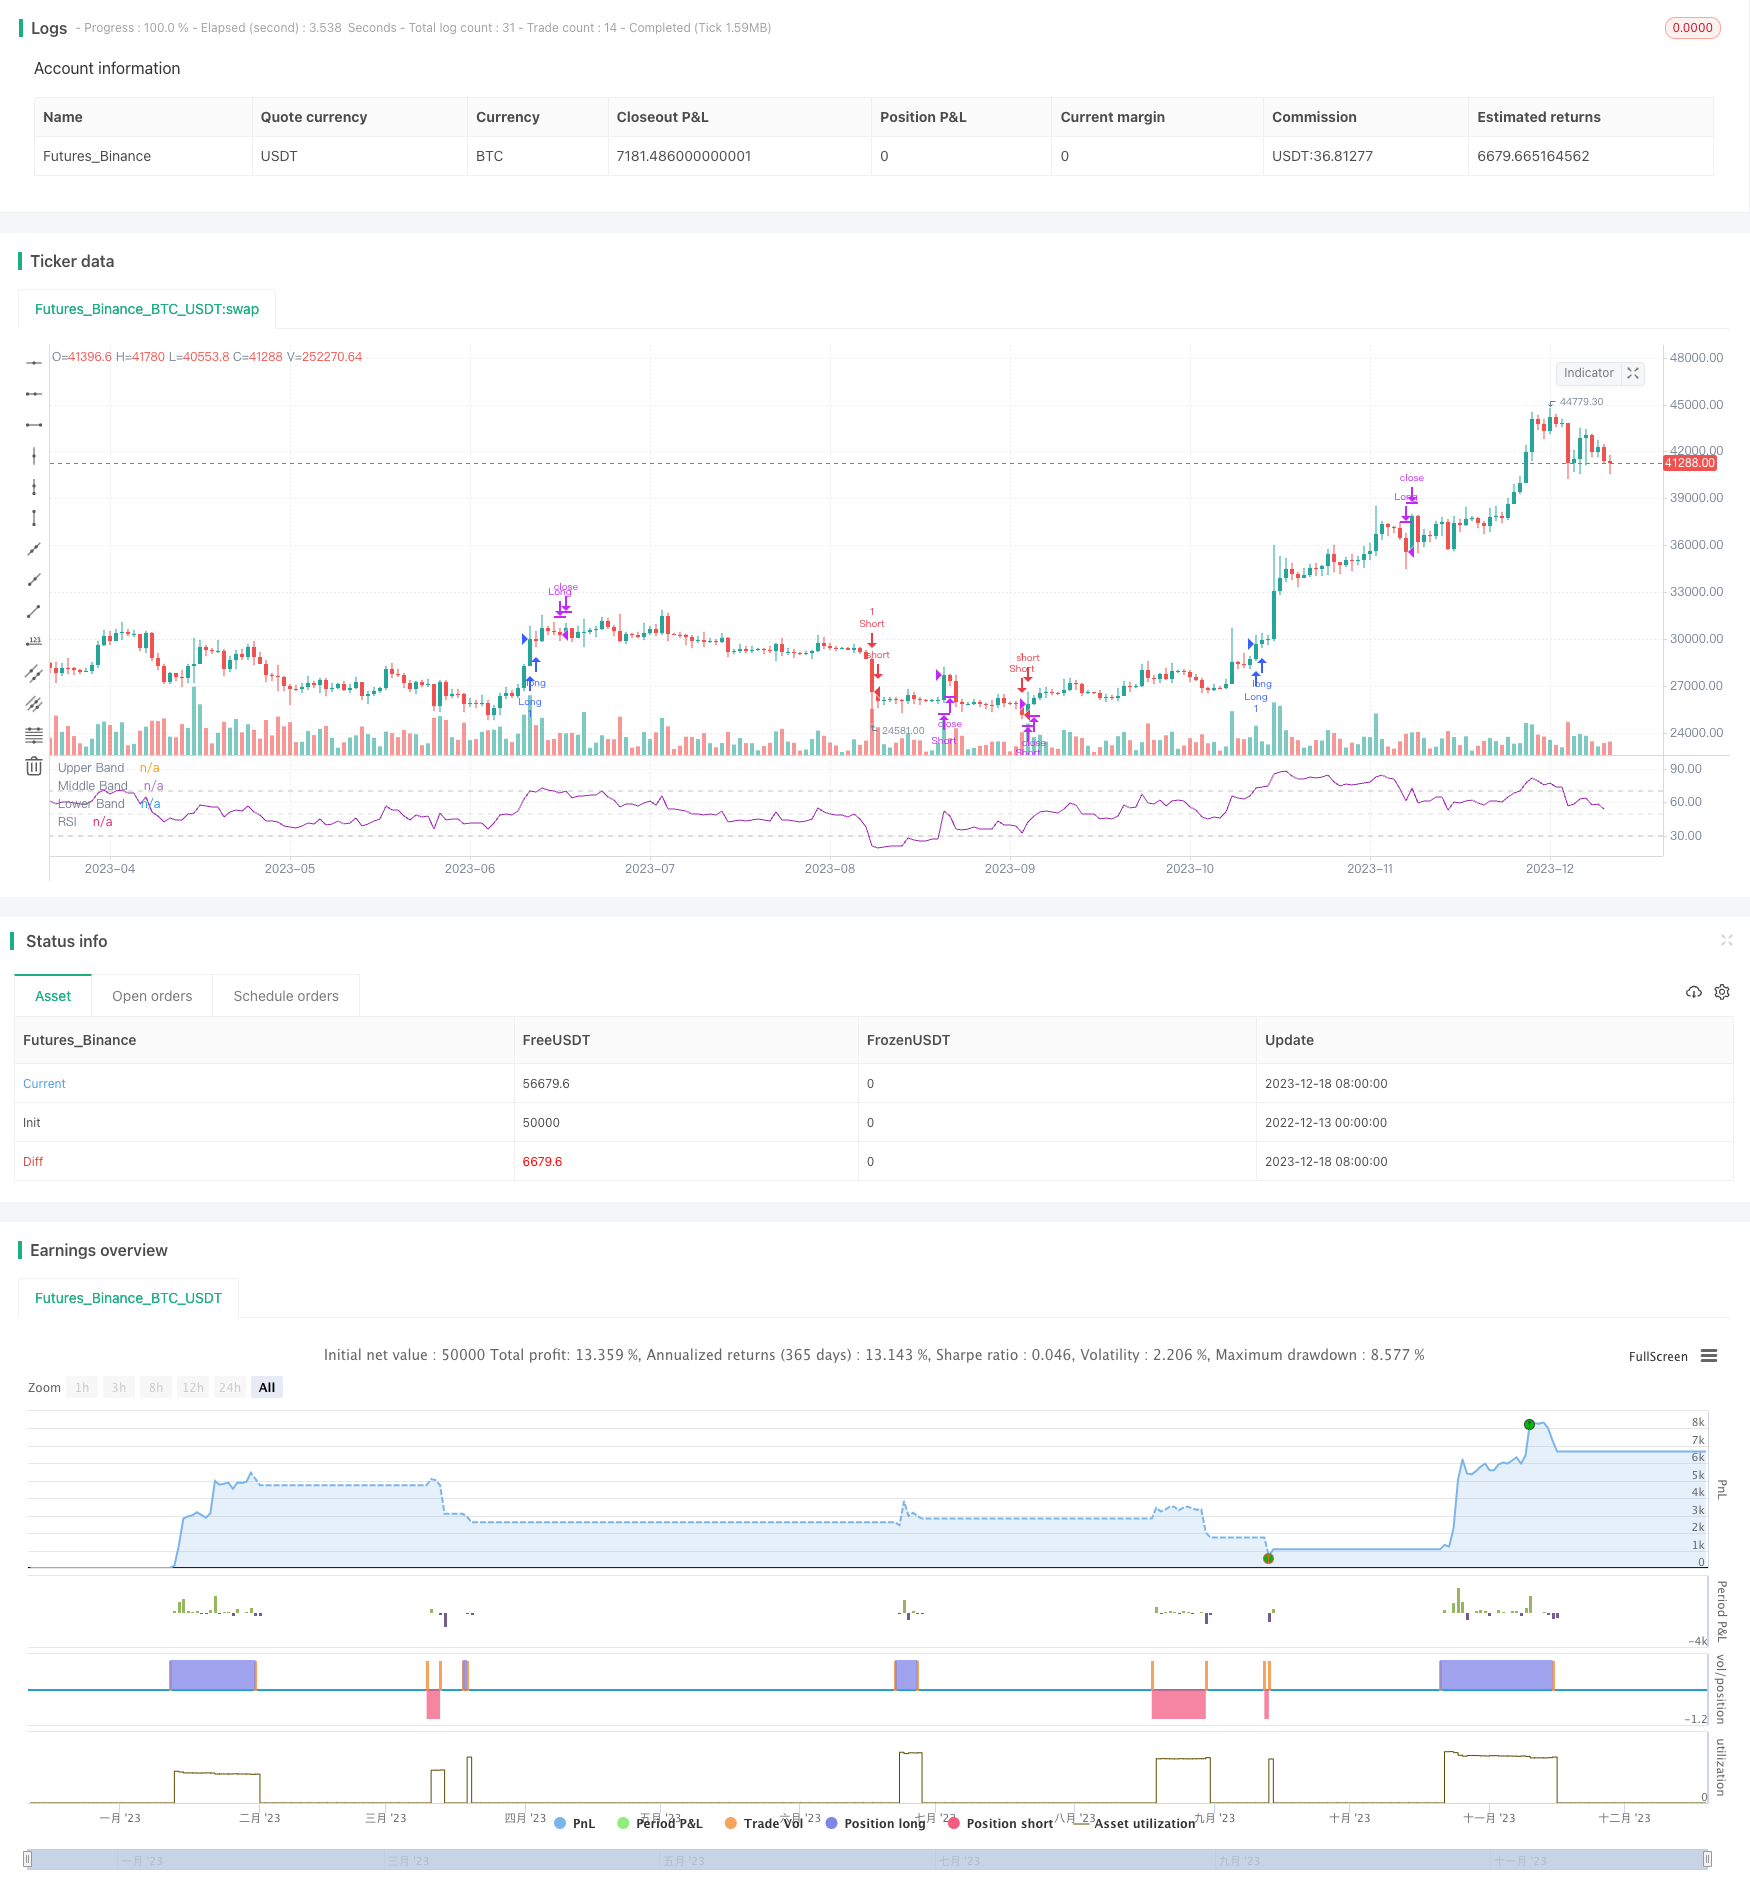
这是一个基于相对强度指标(RSI)和相对交易量指标的量化交易策略。该策略通过捕捉强势行情最快阶段的交易信号来获取超额收益。
该策略整合了两个指标:相对强度指标(RSI)和相对量指标(RVOL)。RSI用于判断市场走势的超买超卖情况。当RSI低于30时为超卖,高于70时为超买。RVOL用于判断交易量的爆发性,相对平均交易量大于设定阈值时表示买卖力道强劲。
策略逻辑是:当RSI表现超买(RSI高于阈值)和RVOL表现超大时看多入市; 当RSI表现超卖(RSI低于阈值)和RVOL表现超大时看空入市。平仓信号是RSI回归正常水平(多头平仓:RSI低于69;空头平仓:RSI高于31)。
该策略最大的优势是利用RSI指标判断市场超买超卖的时机,再结合高相对量的信号,在行情最激进的时候捕捉超强势行情的爆发点。使用RSI和RVOL的组合信号,可以过滤掉很多假突破的机会,从而提高获利概率。
相对于单一使用RSI指标,该策略增加了交易量的参考,避免在交易量不足时介入市场。相对于单一使用突破指标,该策略避免在超买超卖区域打向主流的反弹。
该策略最大的风险在于RSI指标发出错误信号的概率。当市场处于sideway时,RSI指标可能频繁进出超买超卖区域,产生虚假信号。此外,该策略对交易量变化较为敏感,如果遇到量能不足的个股,获利空间会打折扣。
为了降低风险,可以适当调整RSI的参数,增加RSI的平均长度,或者调高RVOL的阈值。也可以加入其它指标进行组合,增加策略的稳健性。
该策略可以从以下几个方面进行优化:
-
结合流动性指标,避免流动性差的标的;
-
加入波动率指标,只在波动加剧时介入;
-
增加排除假突破的机制,如加入成交量的监测;
-
使止损策略更加严格,降低回撤;
-
进行参数优化,结合回测数据找到最优参数组合。
该相对量指标策略通过相对强度指标和相对交易量的结合,成功定位了超买超卖区域内交易量爆发的时点,是一种有效的趋势捕捉策略。该策略心理场景清晰,经过参数调优以后,可以成为量化交易体系中的有效组成部分。
||
This is a quantitative trading strategy based on the Relative Strength Index (RSI) and the Relative Volume indicator. The strategy aims to capture excess returns by trading the fastest stage of a strong trend.
The strategy incorporates two indicators: Relative Strength Index (RSI) and Relative Volume (RVOL). RSI judges the overbought/oversold levels. RSI below 30 suggests oversold and RSI above 70 suggests overbought. RVOL captures surges in volume compared to recent average. When RVOL is above a threshold, it indicates strong buying/selling pressure.
The strategy logic is: go long when RSI shows overbought (above threshold) AND RVOL shoots up; go short when RSI shows oversold (below threshold) AND RVOL shoots up. Exit signals happen when RSI returns to normal level (long exit: RSI below 69; short exit: RSI above 31).
The biggest edge of this strategy is to locate the most aggressive part of a trend by combining overbought/oversold signal from RSI and the high relative volume signal. Using the combo signal of RSI and RVOL can avoid lots of false breakouts and improve profitability.
Compared to using RSI alone, this strategy incorporates volume information to avoid entering the market with insufficient liquidity. Compared to using breakout alone, this strategy prevents trading against the major trend in OB/OS regions.
The biggest risk of this strategy is the possibility of RSI giving false signals. When market is ranging, RSI may frequently cross in/out of OB/OS zones and generate fake signals. Also, this strategy is sensitive to volume changes. Low liquidity instruments can discount the profitability.
To mitigate the risks, parameters of RSI can be adjusted, like increasing averaging period, or lifting the threshold for RVOL. Combining other indicators helps improve robustness too.
The potential optimizations include:
-
Add liquidity metrics to avoid illiquid instruments;
-
Add volatility metrics to trade only when volatility expansions;
-
Build mechanisms to avoid false breakouts, e.g. monitoring volume;
-
Make stop loss more strict, to limit drawdowns;
-
Parameter tuning based on backtests to find optimum settings.
The Relative Volume strategy manages to locate points of surging volume within OB/OS zones by incorporating RSI and relative volume, making it an effective trend catching strategy. With clear logic and robust optimizations, it can be a valuable addition to the quantitative trading system.
[/trans]
Strategy Arguments
| Argument | Default | Description |
|---|---|---|
| v_input_1 | 14 | RSI Period |
| v_input_2 | 70 | RSI buy |
| v_input_3 | 35 | RSI short |
| v_input_4 | 14 | RV Period |
| v_input_5 | 1.5 | RV Threshold |
Source (PineScript)
/*backtest
start: 2022-12-13 00:00:00
end: 2023-12-19 00:00:00
period: 1d
basePeriod: 1h
exchanges: [{"eid":"Futures_Binance","currency":"BTC_USDT"}]
*/

// This source code is subject to the terms of the Mozilla Public License 2.0 at https://mozilla.org/MPL/2.0/
// © gary_trades
//This script is a basic concept to catch breakout moves utilising a spike in relative volume when the RSI is high (for longs) or when the RSI is low (for shorts).
//Drawdown is typically low as it exits out of the trade once the RSI returns back to "normal levels".

//@version=4
strategy(title="Relative Volume & RSI Pop", shorttitle="VOL & RSI Pop", overlay=false, precision=2, margin_long=100, margin_short=100)

//RSI
RSIlength = input(14, title="RSI Period")
RSItop = input(70, title="RSI buy", minval= 69, maxval=100)
RSIbottom = input(35, title="RSI short", minval= 0, maxval=35)
price = close
vrsi = rsi(price, RSIlength)
RSIco = crossover(vrsi, RSItop)
RSIcu = crossunder(vrsi, RSIbottom)
plot(vrsi, "RSI", color=color.purple)
band1 = hline(70, "Upper Band", color=#C0C0C0)
bandm = hline(50, "Middle Band", color=color.new(#C0C0C0, 50))
band0 = hline(30, "Lower Band", color=#C0C0C0)
fill(band1, band0, color=color.purple, transp=90, title="Background")

//RELATIVE VOLUME
RVOLlen = input(14, minval=1, title="RV Period")
av = sma(volume, RVOLlen)
RVOL = volume / av
RVOLthreshold = input(1.5,title="RV Threshold", minval=0.5, maxval=10)

//TRADE TRIGGERS
LongCondition = RSIco and RVOL > RVOLthreshold
CloseLong = vrsi < 69

ShortCondition = RSIcu and RVOL > RVOLthreshold
CloseShort = vrsi > 35

if (LongCondition)
    strategy.entry("Long", strategy.long)

strategy.close("Long", when = CloseLong)

if (ShortCondition)
    strategy.entry("Short", strategy.short)

strategy.close("Short", when = CloseShort)
Detail
https://www.fmz.com/strategy/435975
Last Modified
2023-12-20 15:12:56