Name
短期长期EMA决策合并策略Merged-Short-Term-and-Long-Term-EMA-Decision-Strategy
Author
ChaoZhang
Strategy Description
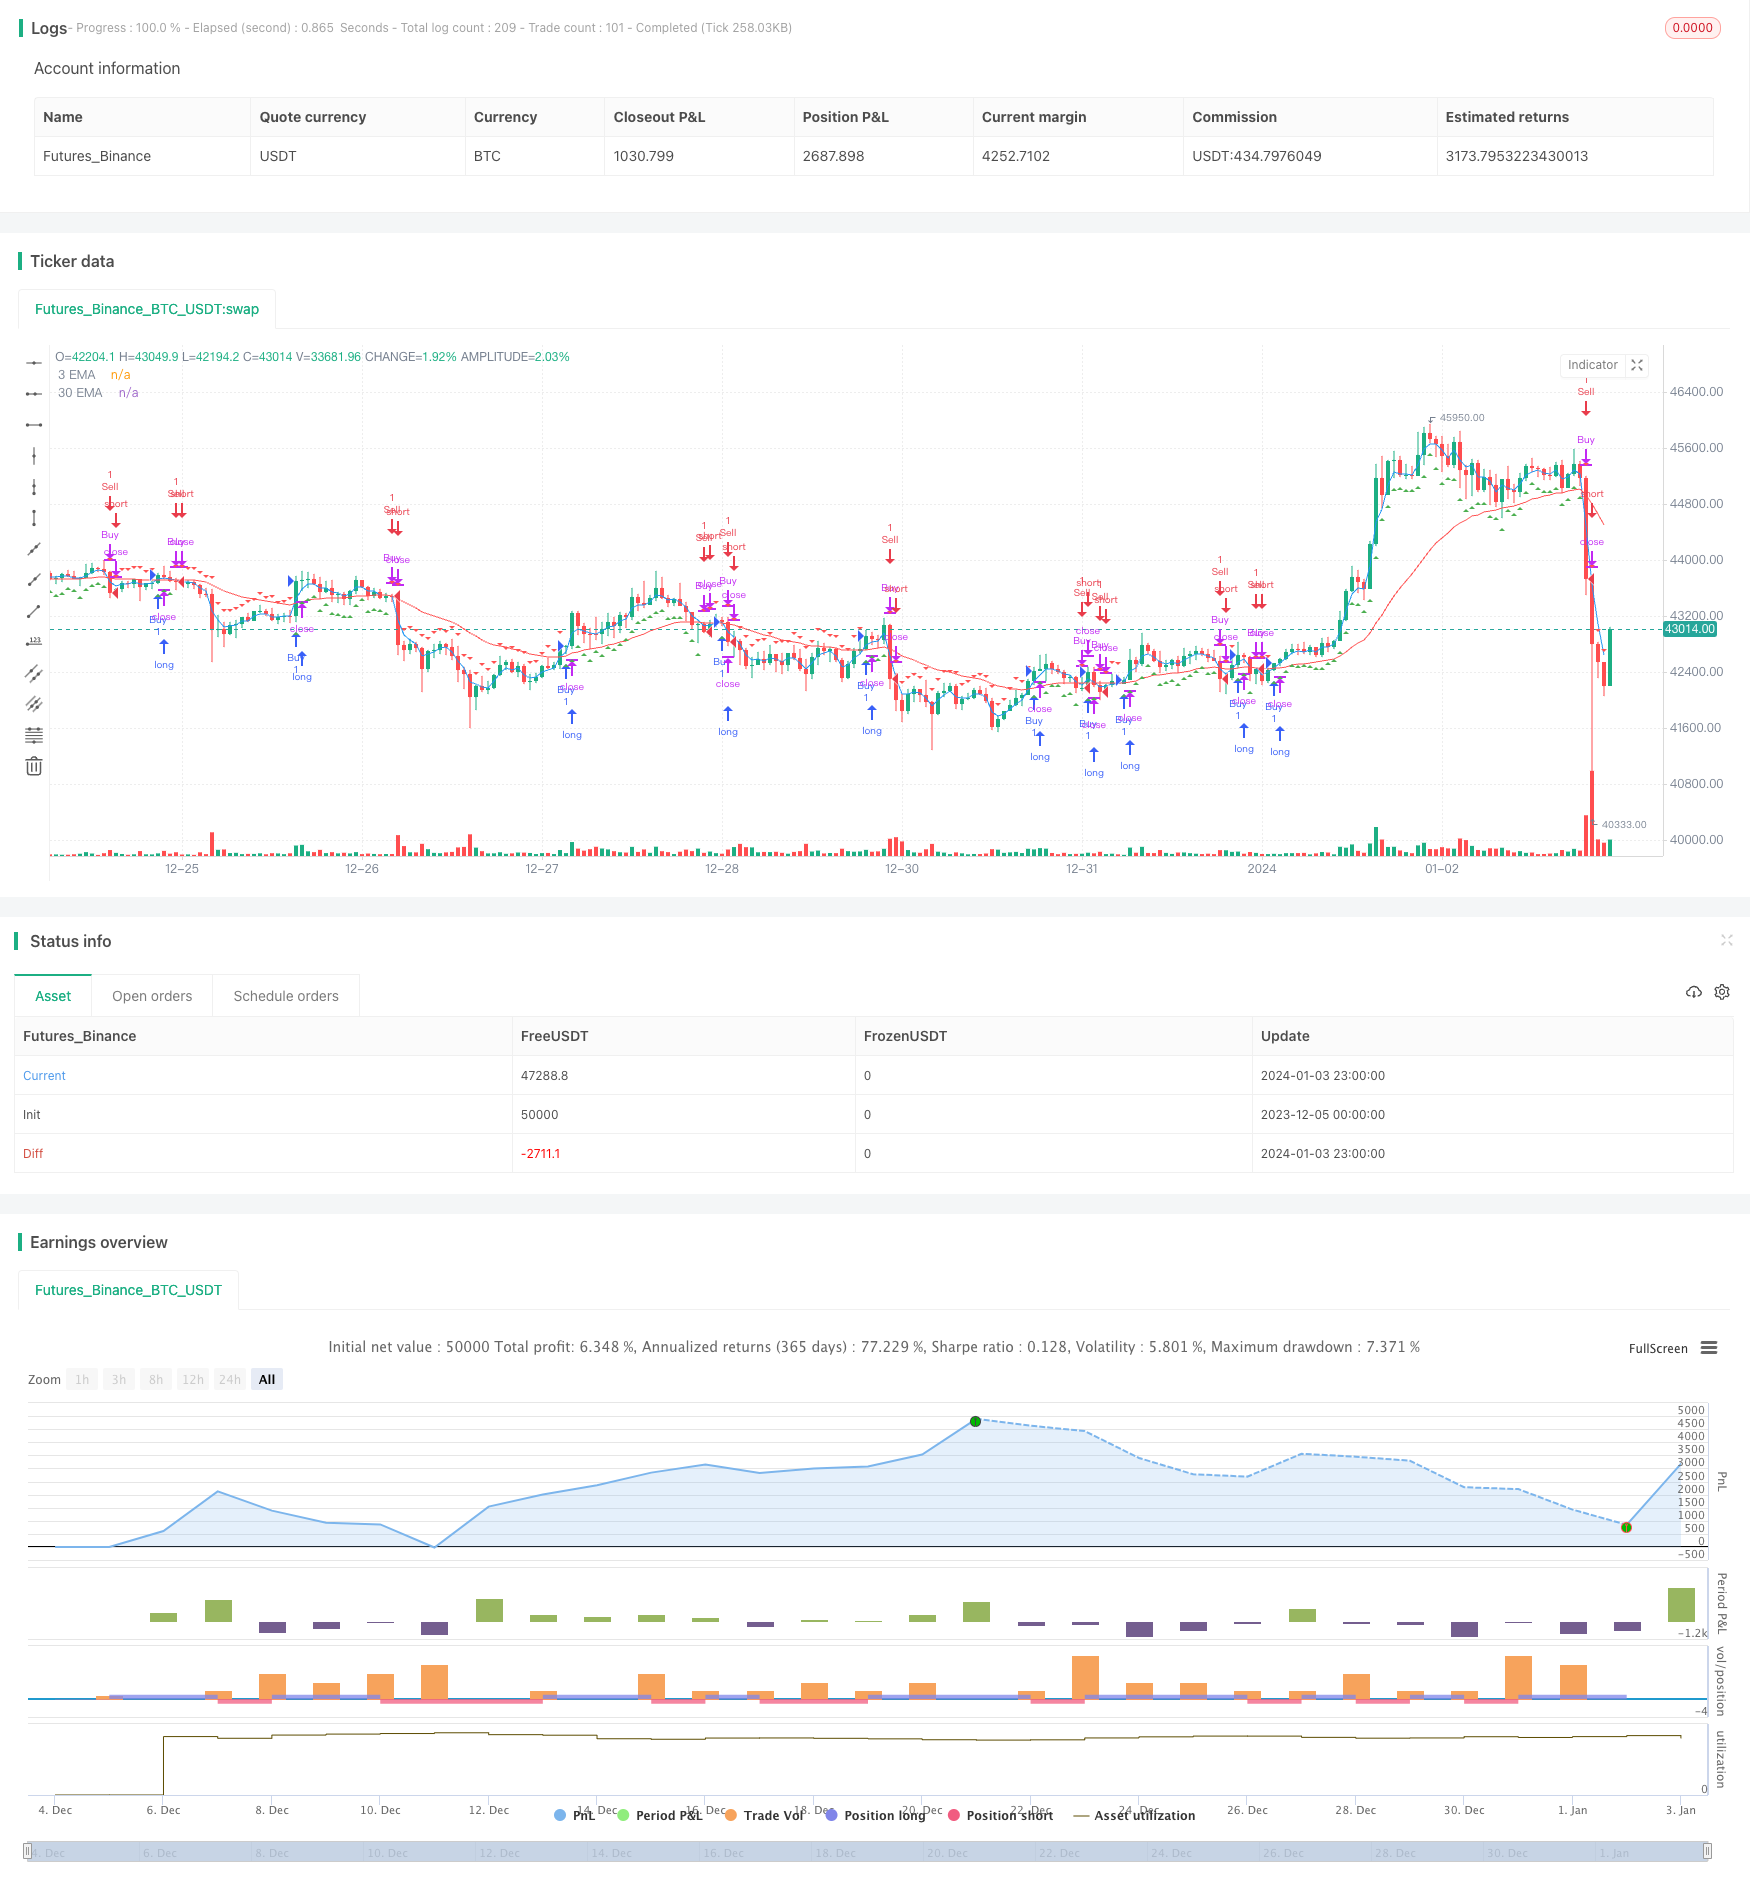
该策略的主要思想是利用短期EMA和长期EMA的交叉作为买入和卖出信号。具体来说,当短期EMA从下方上穿长期EMA时生成买入信号;当短期EMA从上方下穿长期EMA时生成卖出信号。
该策略首先定义了短期EMA周期为3天,长期EMA周期为30天。然后计算出这两个EMA的值。短期EMA反映近期价格变动,长期EMA反映长期价格趋势。当短期EMA上穿长期EMA时,表示近期价格开始上涨,跑赢长期趋势,这是建立多头仓位的信号。当短期EMA下穿长期EMA时,表示近期价格开始下跌,跑输长期趋势,这是建立空头仓位的时机。
具体来说,该策略定义了一个差值来判断EMA的交叉。当差值大于阈值0.0005时产生买入信号,小于阈值-0.0005时产生卖出信号。差值的正负代表短期EMA在长期EMA之上或之下。 traders以此来决定开仓方向。
该策略同时在K线图上标记了triangle up和triangle down的图形来直观显示买入卖出信号。
该策略最大的优势在于简单有效,利用EMA这一最基础指标判断市场结构,避免了过于复杂的模型带来的曲线拟合风险。
EMA作为一种趋势跟踪指标,能有效平滑随机性噪声,判断长短期趋势方向。相比长短期均线交叉等其他常见指标,EMA计算上具有指数平滑特点,能更快速地响应价格变动。
此外,该策略同时结合多个EMA周期,通过长短期EMA的交叉,能在一定程度上过滤假突破。这与单一EMA周期策略相比也更为稳健。
该策略最大的风险在于EMA本身的滞后性。当快速跳空或价格反转来袭时,EMA交叉信号往往会滞后,无法及时反映市场变化。这可能导致错过最佳开仓时机或未及时止损。
此外,EMA周期的选择也会影响策略表现。如果周期选择不当,将导致产生过多错误信号。例如短期周期过短可能导致对市场噪音过于敏感;长期周期过长则无法及时捕捉趋势转折。
最后,固定增量的进入退出阈值也可能导致仓位控制不当。当波动率较大时,应适当调整阈值以控制仓位。
该策略可从以下几个方面进行优化:
- 动态优化EMA周期。可以根据市场状态选择或自动优化最佳短长期EMA组合,提高策略稳健性。
2.引入自适应止损机制。在保证止损的同时,根据市场波动率设定合理的移动止损线,避免过于激进停损。
3.结合其他指标过滤信号。例如仓位控制指标、波动率指标等,避免EMA交叉信号在高波动时带来较大亏损。
4.引入机器学习技术。训练模型预测最佳的EMA周期参数组合。另外也可以预测EMA差值,得到更精确的交易信号。
该短期长期EMA决策合并策略总的来说非常简单直接,通过EMA这一基础指标判断多空市场结构,避免了过度优化和模型风险。同时结合多个EMA周期也提高了信号质量。但我们也要注意EMA本身的滞后性可能带来的风险,这需要后续适当优化来解决。
||
The main idea of this strategy is to use the crossovers between short-term EMA and long-term EMA as buy and sell signals. Specifically, when the short-term EMA crosses above the long-term EMA from below, a buy signal is generated. When the short-term EMA crosses below the long-term EMA from above, a sell signal is generated.
The strategy first defines the short-term EMA period as 3 days and the long-term EMA period as 30 days. Then it calculates the values of these two EMAs. The short-term EMA reflects recent price changes and the long-term EMA reflects long-term price trends. When the short-term EMA crosses above the long-term EMA, it indicates that recent prices have started to rise, outperforming the long-term trend. This is the signal to establish a long position. When the short-term EMA crosses below the long-term EMA, it indicates that recent prices have started to fall, underperforming the long-term trend. This is the timing to establish a short position.
Specifically, the strategy defines a difference to judge the crossover of EMAs. When the difference is greater than the threshold of 0.0005, a buy signal is generated. When it is less than the threshold of -0.0005, a sell signal is generated. The positivity and negativity of the difference represents that the short-term EMA is above or below the long-term EMA. Traders use this to determine the opening direction.
The strategy also marks triangle up and triangle down graphics on the candlestick chart to visually display buy and sell signals.
The biggest advantage of this strategy is that it is simple and effective. It uses the most basic indicator EMA to judge market structure and avoids the risk of overfitting from overly complicated models.
As a trend tracking indicator, EMA can effectively smooth random noise and determine long and short term trend directions. Compared with other common indicators such as long and short term moving average crossovers, EMA has an exponential smoothing feature in its calculation that can respond to price changes more quickly.
In addition, by combining multiple EMA cycles, the crossover between long and short term EMAs can filter false breakouts to some extent compared to single EMA cycle strategies, making it more robust.
The biggest risk of this strategy lies in the lag of EMA itself. When there are rapid gaps or price reversals, EMA crossover signals often lag, failing to reflect market changes in time. This may lead to missing the best opening opportunities or failing to stop loss in time.
In addition, the choice of EMA periods also affects strategy performance. If the cycles are improperly selected, it will lead to too many false signals. For example, excessively short term cycles may cause oversensitivity to market noise, while excessively long term cycles cannot capture trend turns in time.
Finally, fixed incremental entry and exit thresholds can also lead to improper position control. Thresholds should be adjusted appropriately to control positions when volatility is high.
The strategy can be optimized in the following aspects:
-
Dynamically optimize EMA cycles. Select or automatically optimize the best short and long term EMA combinations according to market conditions to improve strategy robustness.
-
Introduce adaptive stop loss mechanism. Set reasonable moving stop-loss lines based on market volatility while ensuring effective stop loss.
-
Combine with other indicators to filter signals. For example, position control indicators, volatility indicators, etc., to avoid significant losses caused by EMA crossover signals during high volatility.
-
Introduce machine learning techniques. Train models to predict optimal EMA parameter combinations. Models can also be used to predict EMA differences to obtain more accurate trading signals.
In summary, this short-term and long-term EMA merged decision strategy is very simple and direct. By using the basic EMA indicator to determine bullish and bearish market structures, it avoids excessive optimization and model risks. Meanwhile, combining multiple EMA cycles also improves signal quality. However, we also need to pay attention to the lag risk EMA itself may bring, which needs subsequent proper optimization to solve.
[/trans]
Source (PineScript)
/*backtest
start: 2023-12-05 00:00:00
end: 2024-01-04 00:00:00
period: 1h
basePeriod: 15m
exchanges: [{"eid":"Futures_Binance","currency":"BTC_USDT"}]
*/

//@version=5
strategy("Merged EMA Strategy", shorttitle="MergedEMA", overlay=true)

// Define EMA periods
shortEMA = ta.ema(close, 3)
longEMA = ta.ema(close, 30)

// Plot EMAs on the chart
plot(shortEMA, color=color.blue, title="3 EMA")
plot(longEMA, color=color.red, title="30 EMA")

// Calculate the difference between short and long EMAs
emaDifference = shortEMA - longEMA

// Set threshold for buy and sell signals
buyThreshold = 0.0005
sellThreshold = -0.0005

// Define buy and sell conditions
buyCondition = emaDifference > buyThreshold
sellCondition = emaDifference < sellThreshold

// Plot buy and sell signals on the chart
plotshape(series=buyCondition, title="Buy Signal", color=color.green, style=shape.triangleup, location=location.belowbar)
plotshape(series=sellCondition, title="Sell Signal", color=color.red, style=shape.triangledown, location=location.abovebar)

// Strategy logic
strategy.entry("Buy", strategy.long, when = buyCondition)
strategy.close("Buy", when = sellCondition)

strategy.entry("Sell", strategy.short, when = sellCondition)
strategy.close("Sell", when = buyCondition)
Detail
https://www.fmz.com/strategy/437794
Last Modified
2024-01-05 16:07:58