Name
移动平均线交叉信号策略Moving-Average-Cross-Signal-Strategy
Author
ChaoZhang
Strategy Description
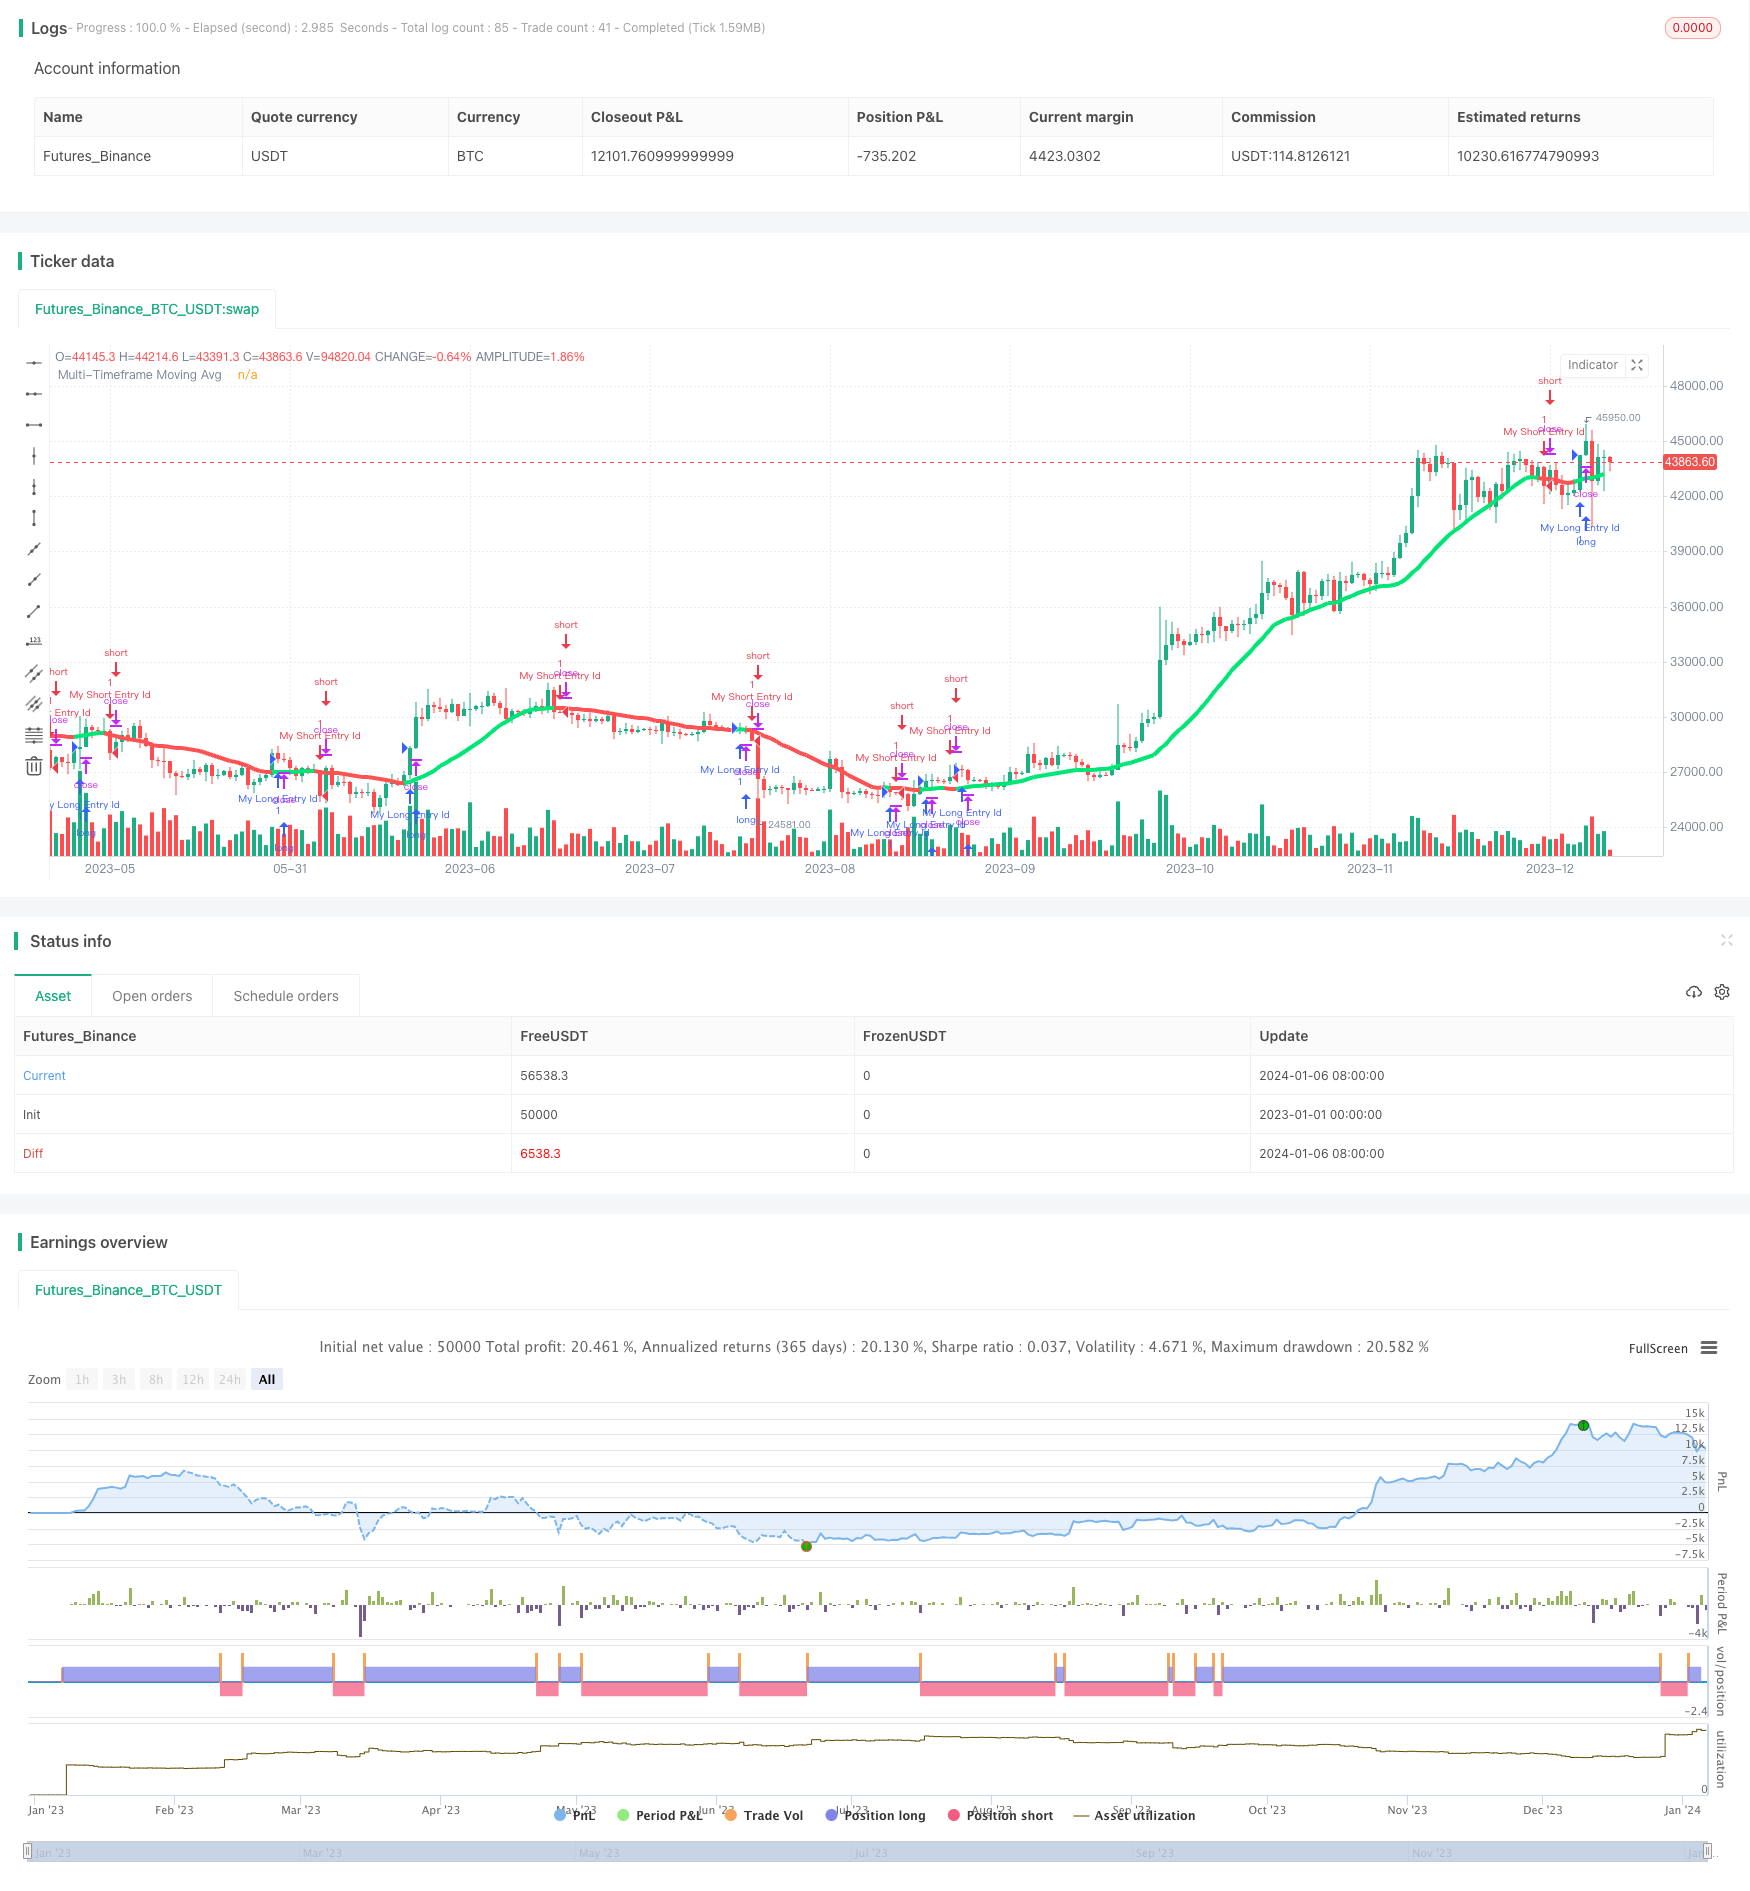
该策略通过计算并绘制不同类型的移动平均线,实现移动平均线之间的交叉信号,用于发出买入和卖出信号。
- 策略允许选择不同类型的移动平均线,包括SMA、EMA、WMA等。
- 策略计算出主要移动平均线,也允许选择第二条移动平均线。
- 通过主要移动平均线和第二移动平均线的交叉情况来判断市场的多空状态。
- 当主要移动平均线上穿其自身指定周期的移动平均线时,产生买入信号;当主要移动平均线下穿其自身指定周期的移动平均线时,产生卖出信号。
- 这样,通过移动平均线的交叉情况,可以较为清晰地判断市场的多空状态。
- 可自定义移动平均线类型,满足不同需求。
- 可添加第二条移动平均线,使信号更加清晰。
- 可自定义移动平均线周期,适用于不同时间周期。
- 可平滑颜色渲染,使图形更清晰。
- 使用了交叉信号机制,对多空态势判断准确。
- 移动平均线具有滞后性,可能出现假信号。可以适当选用曲线拟合移动平均线。
- 移动平均线周期设置不当,可能导致错失交易机会。可以测试更多组合寻找最佳参数。
- 建议结合其他指标如交易量能量指标等进行验证,可减少风险。
- 可考虑把取信号的移动平均线改为curl平均线,可提高信号准确率。
- 可结合LSTM等深度学习模型进行策略优化。
该策略总体思路清晰,使用移动平均线交叉原理判断市场多空态势,可自定义参数满足不同需求。同时也存在一些问题,但可通过优化模型和参数进行改进。总体而言,该策略是基于移动平均线的交易策略的典型代表。
||
This strategy calculates and plots different types of moving averages to implement moving average cross signals for generating buy and sell signals.
- The strategy allows the selection of different types of moving averages, including SMA, EMA, WMA, etc.
- The strategy calculates the main moving average and also allows the selection of a second moving average.
- Judge the market trend based on the cross situation between the main moving average and the second moving average.
- When the main moving average crosses above its own specified cycle moving average, a buy signal is generated; When the main moving average falls below its own specified cycle moving average, a sell signal is generated.
- Thus, by the cross situation of the moving averages, the market trend can be judged more clearly.
- Customizable types of moving averages to meet different needs.
- Add a second moving average for clearer signals.
- Customizable cycles of moving averages, suitable for different time cycles.
- Smooth color rendering for clearer graphs.
- Uses a cross signal mechanism for accurate judgment of trends.
- Moving averages have lagging properties, false signals may occur. Curve fitting moving averages can be used appropriately.
- Improper setting of moving average cycles may lead to missed trading opportunities. More combinations can be tested to find optimal parameters.
- It is recommended to use other indicators such as trading volume energy for verification to reduce risks.
- Consider changing the signal moving average to curl average to improve signal accuracy.
- Models like LSTM can be used to optimize the strategy.
The overall idea of the strategy is clear, using the principle of moving average cross to judge market trend, customizable parameters to meet different needs. There are also some problems, but they can be improved by optimizing models and parameters. Overall, this strategy is a typical representative of trading strategies based on moving averages.
[/trans]
Strategy Arguments
| Argument | Default | Description |
|---|---|---|
| v_input_1 | true | Use Current Chart Resolution? |
| v_input_2 | D | Use Different Timeframe? Uncheck Box Above |
| v_input_3 | 20 | Moving Average Length - LookBack Period |
| v_input_4 | true | 1=SMA, 2=EMA, 3=WMA, 4=HullMA, 5=VWMA, 6=RMA, 7=TEMA |
| v_input_5 | true | Change Color Based On Direction? |
| v_input_6 | 2 | Color Smoothing - 1 = No Smoothing |
| v_input_7 | false | Optional 2nd Moving Average |
| v_input_8 | 50 | Moving Average Length - Optional 2nd MA |
| v_input_9 | true | 1=SMA, 2=EMA, 3=WMA, 4=HullMA, 5=VWMA, 6=RMA, 7=TEMA |
| v_input_10 | true | Change Color Based On Direction 2nd MA? |
| v_input_11 | false | You Can Turn On The Show Dots Parameter Below Without Plotting 2nd MA to See Crosses |
| v_input_12 | false | If Using Cross Feature W/O Plotting 2ndMA - Make Sure 2ndMA Parameters are Set Correctly |
| v_input_13 | false | Show Dots on Cross of Both MA's |
Source (PineScript)
/*backtest
start: 2023-01-01 00:00:00
end: 2024-01-07 00:00:00
period: 1d
basePeriod: 1h
exchanges: [{"eid":"Futures_Binance","currency":"BTC_USDT"}]
*/

//@version=3
strategy("Moving averages-Strategy", overlay=true)
//Created by user ChrisMoody 4-24-2014
//Plots The Majority of Moving Averages
//Defaults to Current Chart Time Frame --- But Can Be Changed to Higher Or Lower Time Frames
//2nd MA Capability with Show Crosses Feature

//inputs
src = close
useCurrentRes = input(true, title="Use Current Chart Resolution?")
resCustom = input(title="Use Different Timeframe? Uncheck Box Above",defval="D")
len = input(20, title="Moving Average Length - LookBack Period")
atype = input(1,minval=1,maxval=7,title="1=SMA, 2=EMA, 3=WMA, 4=HullMA, 5=VWMA, 6=RMA, 7=TEMA")
cc = input(true,title="Change Color Based On Direction?")
smoothe = input(2, minval=1, maxval=10, title="Color Smoothing - 1 = No Smoothing")
doma2 = input(false, title="Optional 2nd Moving Average")
len2 = input(50, title="Moving Average Length - Optional 2nd MA")
atype2 = input(1,minval=1,maxval=7,title="1=SMA, 2=EMA, 3=WMA, 4=HullMA, 5=VWMA, 6=RMA, 7=TEMA")
cc2 = input(true,title="Change Color Based On Direction 2nd MA?")
warn = input(false, title="***You Can Turn On The Show Dots Parameter Below Without Plotting 2nd MA to See Crosses***")
warn2 = input(false, title="***If Using Cross Feature W/O Plotting 2ndMA - Make Sure 2ndMA Parameters are Set Correctly***")
sd = input(false, title="Show Dots on Cross of Both MA's")


res = useCurrentRes ? timeframe.period : resCustom
//hull ma definition
hullma = wma(2*wma(src, len/2)-wma(src, len), round(sqrt(len)))
//TEMA definition
ema1 = ema(src, len)
ema2 = ema(ema1, len)
ema3 = ema(ema2, len)
tema = 3 * (ema1 - ema2) + ema3

avg = atype == 1 ? sma(src,len) : atype == 2 ? ema(src,len) : atype == 3 ? wma(src,len) : atype == 4 ? hullma : atype == 5 ? vwma(src, len) : atype == 6 ? rma(src,len) : tema
//2nd Ma - hull ma definition
hullma2 = wma(2*wma(src, len2/2)-wma(src, len2), round(sqrt(len2)))
//2nd MA TEMA definition
sema1 = ema(src, len2)
sema2 = ema(sema1, len2)
sema3 = ema(sema2, len2)
stema = 3 * (sema1 - sema2) + sema3

avg2 = atype2 == 1 ? sma(src,len2) : atype2 == 2 ? ema(src,len2) : atype2 == 3 ? wma(src,len2) : atype2 == 4 ? hullma2 : atype2 == 5 ? vwma(src, len2) : atype2 == 6 ? rma(src,len2) : tema

out = avg
out_two = avg2

out1 = request.security(syminfo.tickerid, res, out)
out2 = request.security(syminfo.tickerid, res, out_two)

ma_up = out1 >= out1[smoothe]
ma_down = out1 < out1[smoothe]

col = cc ? ma_up ? lime : ma_down ? red : aqua : aqua
col2 = cc2 ? ma_up ? lime : ma_down ? red : aqua : aqua

circleYPosition = out2

plot(out1, title="Multi-Timeframe Moving Avg", style=line, linewidth=4, color = col)
plot(doma2 and out2 ? out2 : na, title="2nd Multi-TimeFrame Moving Average", style=circles, linewidth=4, color=col2)
plot(sd and cross(out1, out2) ? circleYPosition : na,style=cross, linewidth=5, color=yellow)


longCondition = crossover(out1, out1[smoothe])
if (longCondition)
    strategy.entry("My Long Entry Id", strategy.long)

shortCondition = crossunder(out1, out1[smoothe])
if (shortCondition)
    strategy.entry("My Short Entry Id", strategy.short)
Detail
https://www.fmz.com/strategy/438047
Last Modified
2024-01-08 15:54:32