Name
移动平均线交叉趋势跟踪策略Trend-Tracking-Strategy-Based-on-Moving-Average-Crossover
Author
ChaoZhang
Strategy Description
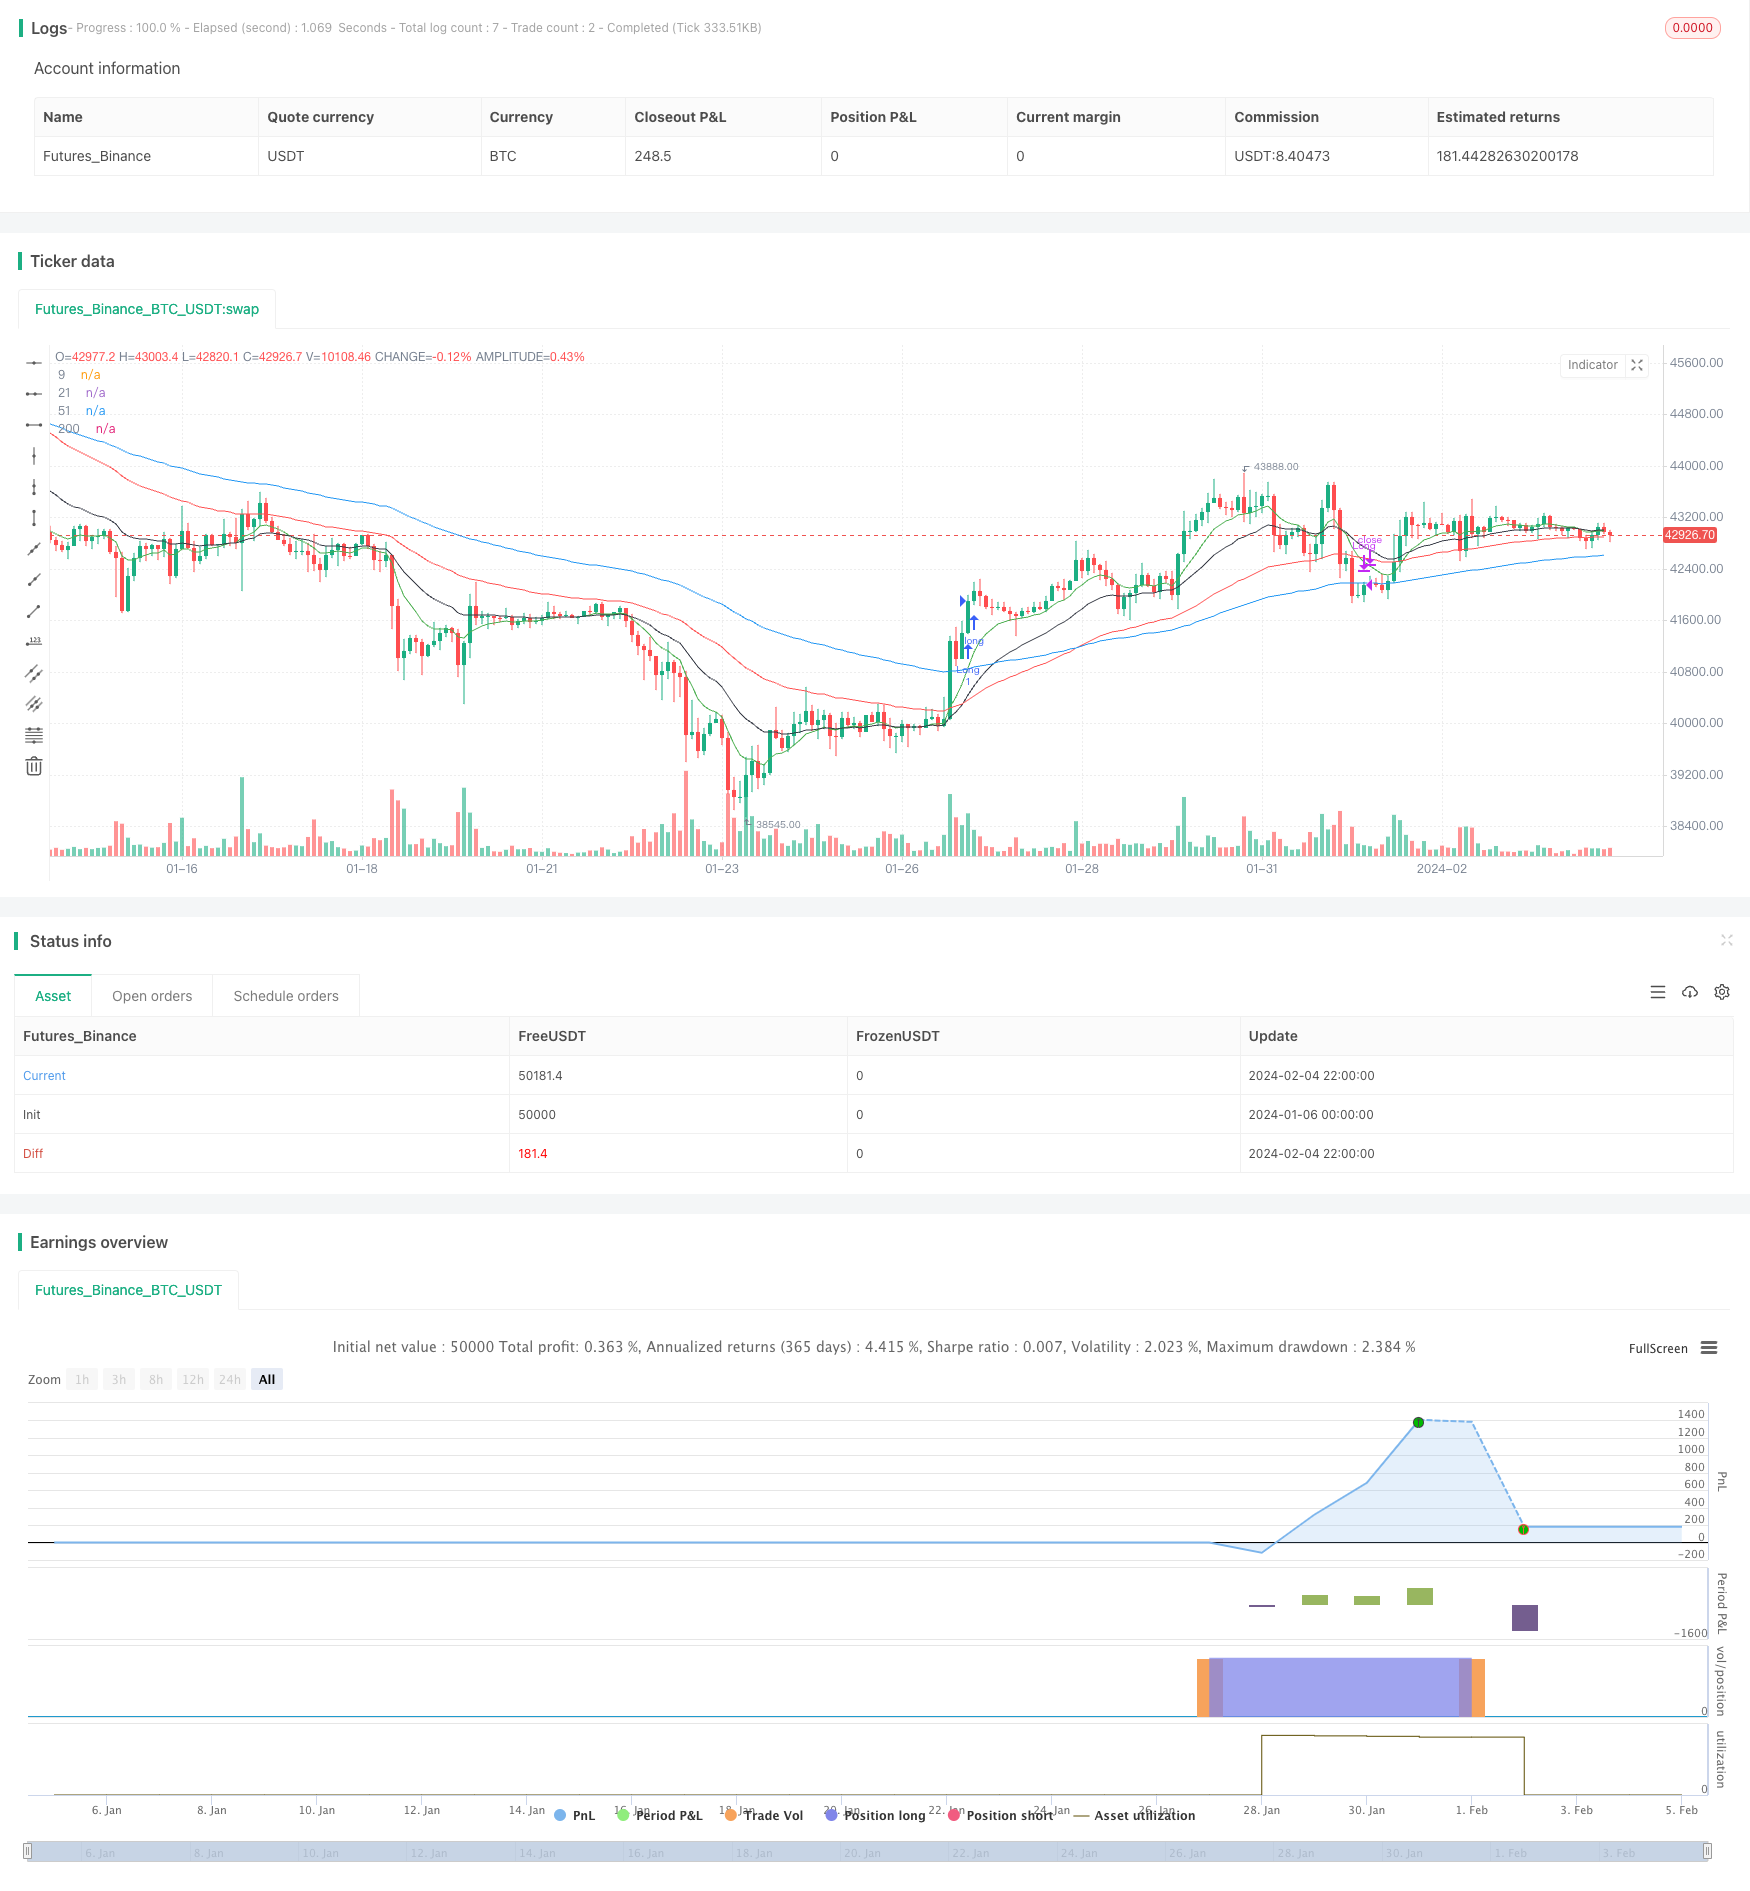
该策略通过计算不同周期的EMA移动平均线,判断它们的交叉情况,结合RSI指标判断行情趋势,实现趋势跟踪交易。其核心思想是:当短期EMA线从下方上穿较长周期的EMA线时产生买入信号;当短期EMA从上方下穿较长周期EMA线时产生卖出信号,通过这样的EMA交叉形成的交易信号,跟踪市场趋势运行。
该策略主要利用EMA的快慢特性,计算5条不同周期的EMA线,包括9日线、21日线、51日线、100日线和200日线。短周期EMA线能更快地响应价格变化,较长周期EMA线对噪声相对不敏感,能反映市场趋势。 当短周期EMA线从下方上穿较长周期EMA线时,表示价格开始上涨,属于买入信号;当短周期EMA从上方下穿较长周期EMA线时,表示价格开始下跌,属于卖出信号。因此,通过EMA线的交叉情况,可以判断行情的涨跌趋势。
此外,该策略还引入RSI指标辅助判断。只有当RSI大于65时,才会发出买入信号;只有当RSI小于40时,才会发出卖出信号。这可以过滤掉一些错误的信号,避免交易被巨大的价格震荡所误导。
该策略最大的优势在于可以有效跟踪市场趋势。通过EMA的快慢特性设定多组EMA均线,判断它们的交叉情况,形成买入和卖出信号,可以捕捉中长线的行情走势。这种趋势跟踪策略胜率较高,适合长线持有。
此外,该策略还引入RSI指标进行辅助判断,可以有效地过滤噪声,避免被短期市场波动所误导,从而提高信号的可靠性。RSI参数设置为14,可以捕捉较为明确的超买超卖情况。
总的来说,该策略融合了移动平均线的趋势跟踪和RSI的超买超卖判断,既可以捕捉行情趋势,有可以有效滤除错误信号,是一种可靠性较高的趋势跟踪策略。
该策略最大的风险在于会存在一定的滞后。EMA本身对价格变化有一定滞后性,特别是较长周期的EMA,这意味着买入和卖出信号的产生会有一定延迟。如遇到价格剧烈反转的情况,会产生较大的浮亏。
此外,当市场处于盘整震荡时,EMA均线交叉信号会频繁出现,这时RSI参数设置为14可能会过滤掉过多信号,导致错过交易机会的情况。
要降低这些风险,可以适当缩短较长EMA的周期参数,并适当放宽RSI的超买超卖阈值,使信号参数设置更加灵敏。当然也需要承担更高的误导风险。需要根据实际市场情况调整参数,寻找最佳平衡点。
该策略可以从以下几个方面进行优化:
-
EMA周期参数优化。可以测试更多种EMA周期参数的组合,寻找最佳参数对,使信号更加灵敏和可靠。
-
RSI参数优化。可以适当扩大RSI超买超卖区区间,使信号触发更加频繁,或缩小区间来减少误导风险。
-
增加止损机制。可以设置移动止损或挂单止损来锁定利润,这可以有效抑制亏损风险。
-
结合其他指标。可以引入像KDJ、MACD等其他指标来使信号更加可靠,提高策略效果。
-
优化仓位管理。可以根据市场波动程度来动态调整仓位大小,在趋势更加明确时加大仓位。
该策略通过计算多组EMA均线并判断其交叉情况,结合RSI指标进行辅助判断,实现了对市场趋势的有效捕捉和跟踪。它融合了趋势跟踪和超买超卖判断两大思路,可以捕捉中长线行情的同时有效过滤误导信号。通过参数优化和策略组合,可以形成一个稳定、高效的量化交易系统。它代表了移动平均线策略和指标融合策略的典型案例。
||
This strategy calculates EMA lines of different cycles to determine their crossover situation and uses the RSI indicator to judge the market trend, so as to implement trend tracking trading. The core idea is: generating buy signals when the short-term EMA line crosses over the longer-cycle EMA line from the bottom; generating sell signals when the short-term EMA crosses below the longer-cycle EMA line. By using such EMA crossover signals, the strategy tracks the market trend.
This strategy mainly utilizes the fast and slow properties of EMA and calculates 5 EMA lines of different cycles, including 9-day, 21-day, 51-day, 100-day and 200-day line. The short-cycle EMA line can respond to price changes faster, while longer-cycle EMA lines are relatively insensitive to noise and can reflect market trend.
When the short-cycle EMA line crosses over the longer-cycle EMA line from the bottom, it indicates the price starts rising and triggers the buy signal. When the short-cycle EMA crosses below the longer-cycle EMA, it indicates the price starts declining and triggers the sell signal. Therefore, by judging the crossover situations of EMA lines, we can determine the uptrend or downtrend of the market.
In addition, this strategy also introduces the RSI indicator for auxiliary judgement. Buy signals will only be triggered when RSI is greater than 65, and sell signals only when RSI is less than 40. This helps filter out some wrong signals and avoid being misguided by huge price swings.
The biggest advantage of this strategy is that it can effectively track the market trend. By utilizing the fast and slow properties of EMA to set up multiple groups of EMA lines and judging their crossover situations, it can capture the mid-long term trend of the market. This kind of trend tracking strategy has a relatively high winning rate and suits long-term holding.
In addition, this strategy also introduces the RSI indicator for assistance judgement, which can effectively filter out noise and avoid being misguided by short-term market fluctuations, thus improving the reliability of trading signals. The RSI parameter is set to 14 so that it can capture relatively significant overbought/oversold situations.
In conclusion, this strategy combines the strengths of moving average trend tracking and RSI overbought/oversold judgement. It can not only capture market trends but also filter out wrong signals effectively, making itself a trend tracking strategy with relatively high reliability.
The biggest risk of this strategy is there will be some lag. EMA itself has some lagging attribute when responding to price changes, especially longer-cycle EMA. This means the generation of buy and sell signals will be delayed. In case of sharp price reversion, huge floating loss may occur.
Also, when the market is fluctuating within range, crossover signals between EMA lines will occur frequently. The RSI parameter of 14 may filter out too many signals, leading to missing trading opportunities.
To reduce the risks above, we may shorten the period of longer-cycle EMA appropriately and loosen the overbought/oversold threshold of RSI to make the signal more sensitive. Of course this exposes to higher false signal risks. Adjustments on parameters need to be made based on real market situations to find the optimal balance point.
This strategy can be optimized from the following aspects:
-
Optimize EMA period parameters. Trying more combinations of EMA periods to find the best signal sensitivity and reliability.
-
Optimize RSI parameters. Properly enlarge the overbought/oversold range to trigger signals more frequently or narrow it down to reduce false signals.
-
Add stop loss mechanisms such as moving stop loss or pending orders to lock in profit and reduce loss risk.
-
Incorporate other indicators like KDJ, MACD to improve signal reliability.
-
Optimize position management dynamically based on market volatility.
This strategy calculates multiple groups of EMA lines to determine crossover situations combined with RSI indicator to effectively capture and track market trends. By integrating the ideas of trend tracking and overbought/oversold judgement, it can capture mid-long term trends with effective false signal filtering. After parameter optimization and strategy integration, it can form a steady and efficient quantitative trading system, representing a typical case of moving average strategies and indicator fusion strategies.
[/trans]
Source (PineScript)
/*backtest
start: 2024-01-06 00:00:00
end: 2024-02-05 00:00:00
period: 2h
basePeriod: 15m
exchanges: [{"eid":"Futures_Binance","currency":"BTC_USDT"}]
*/

// This source code is subject to the terms of the Mozilla Public License 2.0 at https://mozilla.org/MPL/2.0/
// © Ravikant_sharma

//@version=5

strategy('new', overlay=true)

start = timestamp(1990, 1, 1, 0, 0)
end = timestamp(2023, 12, 12, 23, 59)
ema0 = ta.ema(close, 9)
ema1 = ta.ema(close, 21)
ema2 = ta.ema(close, 51)
ema3 = ta.ema(close, 100)
ema4 = ta.ema(close, 200)

rsi2=ta.rsi(ta.sma(close,14),14)
plot(ema0, '9', color.new(color.green, 0))
plot(ema1, '21', color.new(color.black, 0))
plot(ema2, '51', color.new(color.red, 0))
plot(ema3, '200', color.new(color.blue, 0))

//plot(ema4, '100', color.new(color.gray, 0))


//LongEntry = (  ta.crossover(ema0,ema3)  or  ta.crossover(ema0,ema2) or  ta.crossunder(ema2,ema3) ) // ta.crossover(ema0,ema1) //
LongEntry=false
if ta.crossover(ema0,ema1)
    if rsi2>65
        LongEntry:=true
if ta.crossover(ema1,ema2)
    if rsi2>65
        LongEntry:=true

LongExit =  ta.crossunder(ema0,ema2) or close >(strategy.position_avg_price*1.25) or rsi2 <40 or close < (strategy.position_avg_price*0.98)


if true
    if(LongEntry and rsi2>60)
        strategy.entry('Long', strategy.long, 1)
    if(LongExit)
        strategy.close('Long')
Detail
https://www.fmz.com/strategy/441152
Last Modified
2024-02-06 11:37:23