Name
移动平均线和随机相对强弱指标策略Moving-Average-and-Stochastic-RSI-Strategy
Author
ChaoZhang
Strategy Description
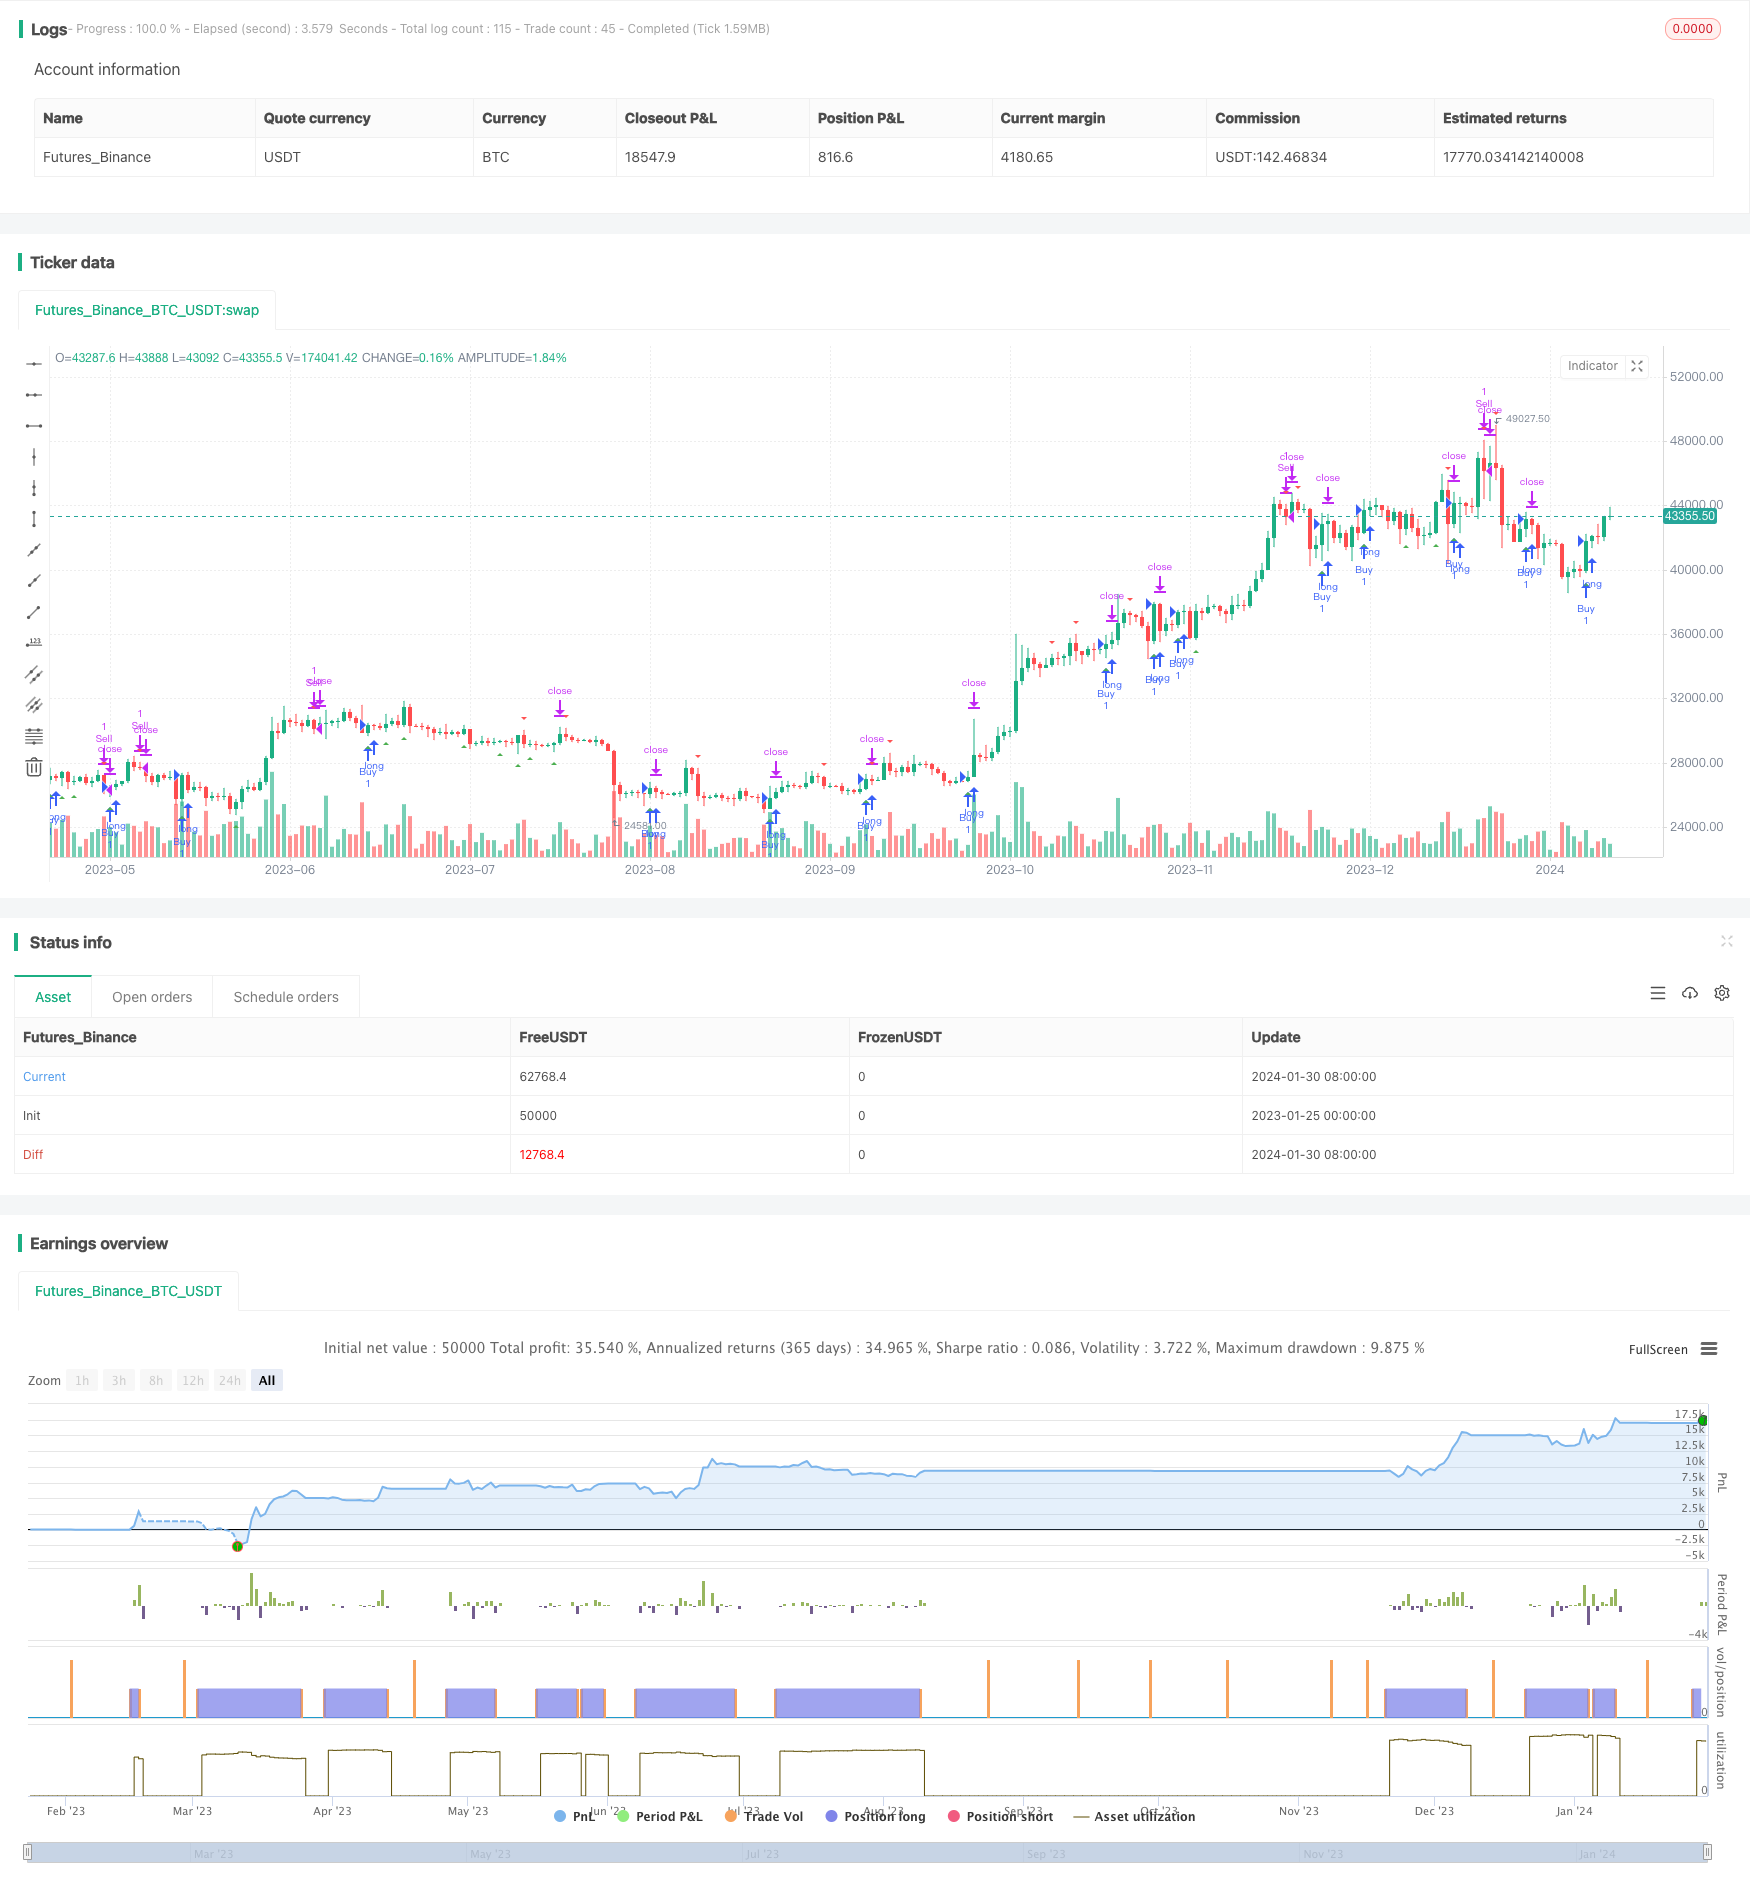
该策略是在比特币和美元的交易对(BTC/USDT)的3分钟时间框架上进行测试,并给出了非常好的结果。该策略结合使用了移动平均线和随机相对强弱指标(Stochastic RSI)来识别交易信号。
该策略使用了两个不同期限的简单移动平均线,分别是20周期和50周期。这两个平均线用来判断价格趋势,当短期移动平均线上穿长期移动平均线时为多头信号,下穿为空头信号。
Stochastic RSI指标的计算公式为:(RSI - 最低RSI)/(最高RSI - 最低RSI) * 100。该指标反映了RSI指标当前水平相对于最近一段时间内最高和最低RSI的位置。当Stochastic RSI上穿20时为超卖信号,下穿80时为超买信号。
该策略综合使用移动平均线判断趋势方向,并用Stochastic RSI来定位潜在的反转点作为入场时机。
与单一使用移动平均线或者Stochastic RSI相比,该策略结合两者优势,可以更好地识别趋势,同时定位潜在反转点,从而提高获利概率。
相比单一指标,该策略综合多种指标并设置严格的入场规则,可以有效过滤假信号,避免无谓交易。
该策略也很好地控制了风险,每次只用2%的资金做保证金交易,可以有效限制单笔损失的影响。
该策略主要依赖技术指标判定交易信号,如果指标发生失效,将可能产生错误信号导致损失。此外,指标参数设置不当也会影响策略表现。
在行情剧烈波动时,止盈止损设置可能会被突破,导致损失扩大的风险。
可以测试更多的移动平均线组合和参数,寻找最佳参数组合。也可以尝试其他势能指标如KD、RSI等与移动平均线进行组合。
可以根据不同加密货币的特性选择最佳的止盈止损模式,进一步控制风险。
可以引入机器学习算法自动优化参数设置和信号判断规则,使策略更具鲁棒性和适应性。
该策略成功结合移动平均线和Stochastic RSI指标判定交易信号。相比单一技术指标,该策略可以提供更可靠的交易信号。通过严格的风险控制和参数优化,该策略有望获得稳定利润。
||
This strategy was tested on the BTC/USDT trading pair on the 3-minute timeframe and gave wonderful results. It combines the use of moving averages and the Stochastic RSI indicator to identify trading signals.
The strategy uses two simple moving averages with different time periods, 20 periods and 50 periods respectively. These two averages are used to judge the price trend. When the short-term moving average crosses above the long-term moving average, it is a bullish signal, and when it crosses below, it is a bearish signal.
The calculation formula of Stochastic RSI indicator is: (RSI - Lowest RSI) / (Highest RSI - Lowest RSI) * 100. This indicator reflects the current level of the RSI indicator relative to the highest and lowest RSI over a recent period of time. When Stochastic RSI crosses above 20, it is an oversold signal, and when it crosses below 80, it is an overbought signal.
This strategy combines the use of moving averages to judge the trend direction and Stochastic RSI to locate potential reversal points as entry opportunities.
Compared with using moving averages or Stochastic RSI alone, this strategy combines the advantages of both to better identify trends while locating potential reversal points, thus improving the probability of profit.
Compared with a single indicator, this strategy integrates multiple indicators and sets strict entry rules, which can effectively filter out false signals and avoid unnecessary trading.
This strategy also controls risks very well by using only 2% of capital for margin trading each time, which can effectively limit the impact of a single loss.
This strategy mainly relies on technical indicators to determine trading signals. If the indicators fail, it may generate wrong signals and cause losses. In addition, improper parameter settings will also affect strategy performance.
In times of violent market fluctuations, stop-loss settings may be broken through, leading to the risk of expanding losses.
Test more moving average combinations and parameters to find the optimal parameter combination. Other potential indicators such as KD and RSI can also be combined with moving averages.
Choose the best stop-loss modes according to the characteristics of different cryptocurrencies to further control risks.
Introduce machine learning algorithms to automatically optimize parameter settings and signal judgment rules to make the strategy more robust and adaptive.
This strategy successfully combines moving averages and Stochastic RSI indicator to determine trading signals. Compared with a single technical indicator, this strategy can provide more reliable trading signals. With strict risk control and parameter optimization, this strategy has the potential to achieve stable profits.
[/trans]
Strategy Arguments
| Argument | Default | Description |
|---|---|---|
| v_input_int_1 | 20 | MA1 Length |
| v_input_int_2 | 50 | MA2 Length |
| v_input_int_3 | 14 | Stochastic RSI Length |
| v_input_int_4 | 80 | Overbought Level |
| v_input_int_5 | 20 | Oversold Level |
| v_input_float_1 | 2 | Risk Percentage |
Source (PineScript)
/*backtest
start: 2023-01-25 00:00:00
end: 2024-01-31 00:00:00
period: 1d
basePeriod: 1h
exchanges: [{"eid":"Futures_Binance","currency":"BTC_USDT"}]
*/

//@version=5
strategy("Moving Average and Stochastic RSI Strategy", shorttitle="MA+Stoch RSI", overlay=true)

// Input variables
ma1_length = input.int(20, title="MA1 Length")
ma2_length = input.int(50, title="MA2 Length")
stoch_length = input.int(14, title="Stochastic RSI Length")
overbought = input.int(80, title="Overbought Level")
oversold = input.int(20, title="Oversold Level")
risk_percentage = input.float(2.0, title="Risk Percentage")

// Calculate moving averages
ma1 = ta.sma(close, ma1_length)
ma2 = ta.sma(close, ma2_length)

// Calculate Stochastic RSI
rsi1 = ta.rsi(close, stoch_length)
rsiH = ta.highest(rsi1, stoch_length)
rsiL = ta.lowest(rsi1, stoch_length)
stoch = (rsi1 - rsiL) / (rsiH - rsiL) * 100

// Determine buy and sell signals based on Stochastic RSI
buySignal = ta.crossover(stoch, oversold)
sellSignal = ta.crossunder(stoch, overbought)

// Plot signals on the chart
plotshape(buySignal, style=shape.triangleup, location=location.belowbar, color=color.green, size=size.small)
plotshape(sellSignal, style=shape.triangledown, location=location.abovebar, color=color.red, size=size.small)

// Calculate position size based on equity and risk percentage
equity = strategy.equity
riskAmount = equity * risk_percentage / 100
positionSize = riskAmount / ta.atr(14)

// Entry and exit conditions
var float stopLoss = na
var float takeProfit = na

if buySignal
    stopLoss := low
    takeProfit := high
    strategy.entry("Buy", strategy.long)
else if sellSignal
    strategy.exit("Sell", from_entry="Buy", stop=stopLoss, limit=takeProfit)
Detail
https://www.fmz.com/strategy/440699
Last Modified
2024-02-01 11:37:40