Name
穿刺短线反转策略Piercing-Pin-Bar-Reversal-Strategy
Author
ChaoZhang
Strategy Description
穿刺短线反转策略是一个基于短线形态的趋势交易策略。它利用短线形态作为信号,结合移动平均线判断趋势方向,实现高胜率的进入。同时,它使用了独特的追踪止损机制,可实现超高收益率。
该策略入场信号为短线形态穿刺。具体来说,符合以下两个条件时产生信号:
- 形成特定短线形态:多头信号为阳线短线,空头信号为阴线短线
- 短线形态刺破移动平均线:阳线刺破向下趋势的移动平均线,或阴线刺破向上趋势的移动平均线
这样的组合信号可过滤掉大部分噪音,从而提高入场 precision。
该策略使用三条不同周期的移动平均线来判断趋势。具体来说,快线、中线和慢线同向排列时定义为趋势,否则定义为盘整。
多头入场时,要求快线 > 中线 > 慢线;空头入场时,要求快线 < 中线 < 慢线。
该策略使用了独特的追踪止损机制。开仓后,会根据用户设定的点数和偏移量来追踪最优止损点。这可锁定最大程度收益,同时控制风险。
短线穿刺信号可使策略只在高概率机会点开仓,避免过多噪音交易。同时结合趋势判断,可过滤大部分非主流方向操作。这保证了策略的高 precision。
独特的追踪止损机制是该策略最大亮点。它可在保证最大盈利的前提下,将每单止损精准控制在一个小范围,保证高胜率和超强盈利能力。
模拟结果显示,使用此机制后,多种货币对实现超过1000%以上的总收益率,最大盈利单次超过100倍,收益飙升至前所未见的新高度。
鉴于测试结果近乎“圣杯”,这很有可能是对市场的过度模拟从而产生的结果。实盘中止损机制可能无法如测试般精确生效,会面临一定回撤。
此外,测试周期仅两年,市场结构变化也可能影响实盘表现。
追踪止损过于灵敏可能造成过多止损触发。此外,市场突发事件也可能导致止损无效。这都是使用追踪止损需要面临的风险。
追踪止损是整个策略收益爆发的关键。为使其既灵敏又可靠,可以尝试适当放宽追踪止损点数,使之不那么敏感。
增加测试时间窗口也可检验参数稳健性。
当前移动平均线周期并非最优参数组合。可以通过优化测试,找到更佳参数,以产生更好效果。
例如,增加快线和中线周期差距,或调整三线交叉方式等。
穿刺短线反转策略通过高效率入场和超强止盈,取得了惊人的模拟测试指标。但是我们也要清醒认识到其中的过拟合风险,并做好风险控制准备。
通过适当调整参数或优化,这套策略也许能够在实盘中取得可观收益,成为一个强大的趋势系统。它的独特追踪止损概念,也为我们提供了宝贵启示,有可能催生更多创新型策略。
||
The Piercing Pin Bar Reversal Strategy is a trend trading strategy based on short-term price patterns. It utilizes pin bars as signals, combined with moving averages to determine trend direction, to achieve high-precision entry. It also uses a unique trailing stop mechanism to realize extremely high profitability.
The entry signal for this strategy is piercing pin bars. Specifically, a signal is triggered when:
- A particular short-term pattern forms: bullish signals from bullish pin bars, bearish signals from bearish pin bars
- The pin bar pierces through moving averages: bullish bars piercing downward trending MAs, or bearish bars piercing upward trending MAs
Such combination ensures filtering out most noise and increases entry precision.
The strategy uses three MAs of different periods to define trends. Specifically, when fast, medium and slow MAs align in one direction, it is defined as a trend. Otherwise it is considered as consolidation.
For long entries, fast MA > medium MA > slow MA is required. For short entries, fast MA < medium MA < slow MA is required.
The strategy uses a unique trailing stop loss mechanism. After entry, optimal stop loss points are tracked based on user defined values for trailing points and offset. This allows maximizing captured profit while controlling risk.
The piercing signals allow entry only at high probability opportunity points, avoiding excessive noisy trades. Combining with trend filters further avoids most countertrend operations. This ensures high precision for the strategy.
The unique trailing stop is the biggest highlight of this strategy. It precisely controls the stop loss within a small range on a per trade basis, while ensuring maximum captured profit.
Sim results show insane profitability after applying this mechanism, with total return exceeding 1000% for multiple pairs, and maximum per trade profit over 100 times of initial risk. The profitability is propelled to unprecedented new heights.
Given the almost “holy grail”-like results, it is highly likely that this is an overfitted simulation of the markets. In live trading, the stops may not trigger as precisely as tested, and drawdowns can happen.
Also, the short 2-year test period may not capture structural market regime changes that could impact real results.
Overly sensitive trailing stop values may cause excessive unwanted stop outs. Sudden market events could also invalidate trailing stop loss orders. These are intrinsic risks associated with using trailing stops.
The trailing stop is key to the insane profitability. To make it both agile and reliable, try relaxing the trailing points to avoid over-sensitivity.
Increasing test timeframe also helps examining parameter robustness.
Current MA periods are likely not the optimal parameter set. Further optimization may discover better values for even better performance.
For example, increasing the difference between fast and medium MA periods, or modifying the way MAs interact.
The Piercing Pin Bar Reversal Strategy achieved astonishing backtest results through high-efficiency entry and extreme profit taking. However we must also recognize the overfit risks, and be prepared for risk control accordingly.
With proper parameter tuning or optimization, this strategy may be able to deliver considerable profits in live trading, becoming a powerful trend following system. Its unique trailing stop concept also provides valuable inspiration, that may give rise to more innovative strategies. [/trans]
Strategy Arguments
| Argument | Default | Description |
|---|---|---|
| v_input_1 | 3 | Equity Risk (%) |
| v_input_2 | 0.5 | Stop Loss (x*ATR, Float) |
| v_input_3 | true | Stop Loss Trail Points (Pips) |
| v_input_4 | true | Stop Loss Trail Offset (Pips) |
| v_input_5 | 50 | Slow SMA (Period) |
| v_input_6 | 18 | Medm EMA (Period) |
| v_input_7 | 6 | Fast EMA (Period) |
| v_input_8 | 14 | ATR (Period) |
| v_input_9 | 3 | Cancel Entry After X Bars (Period) |
Source (PineScript)
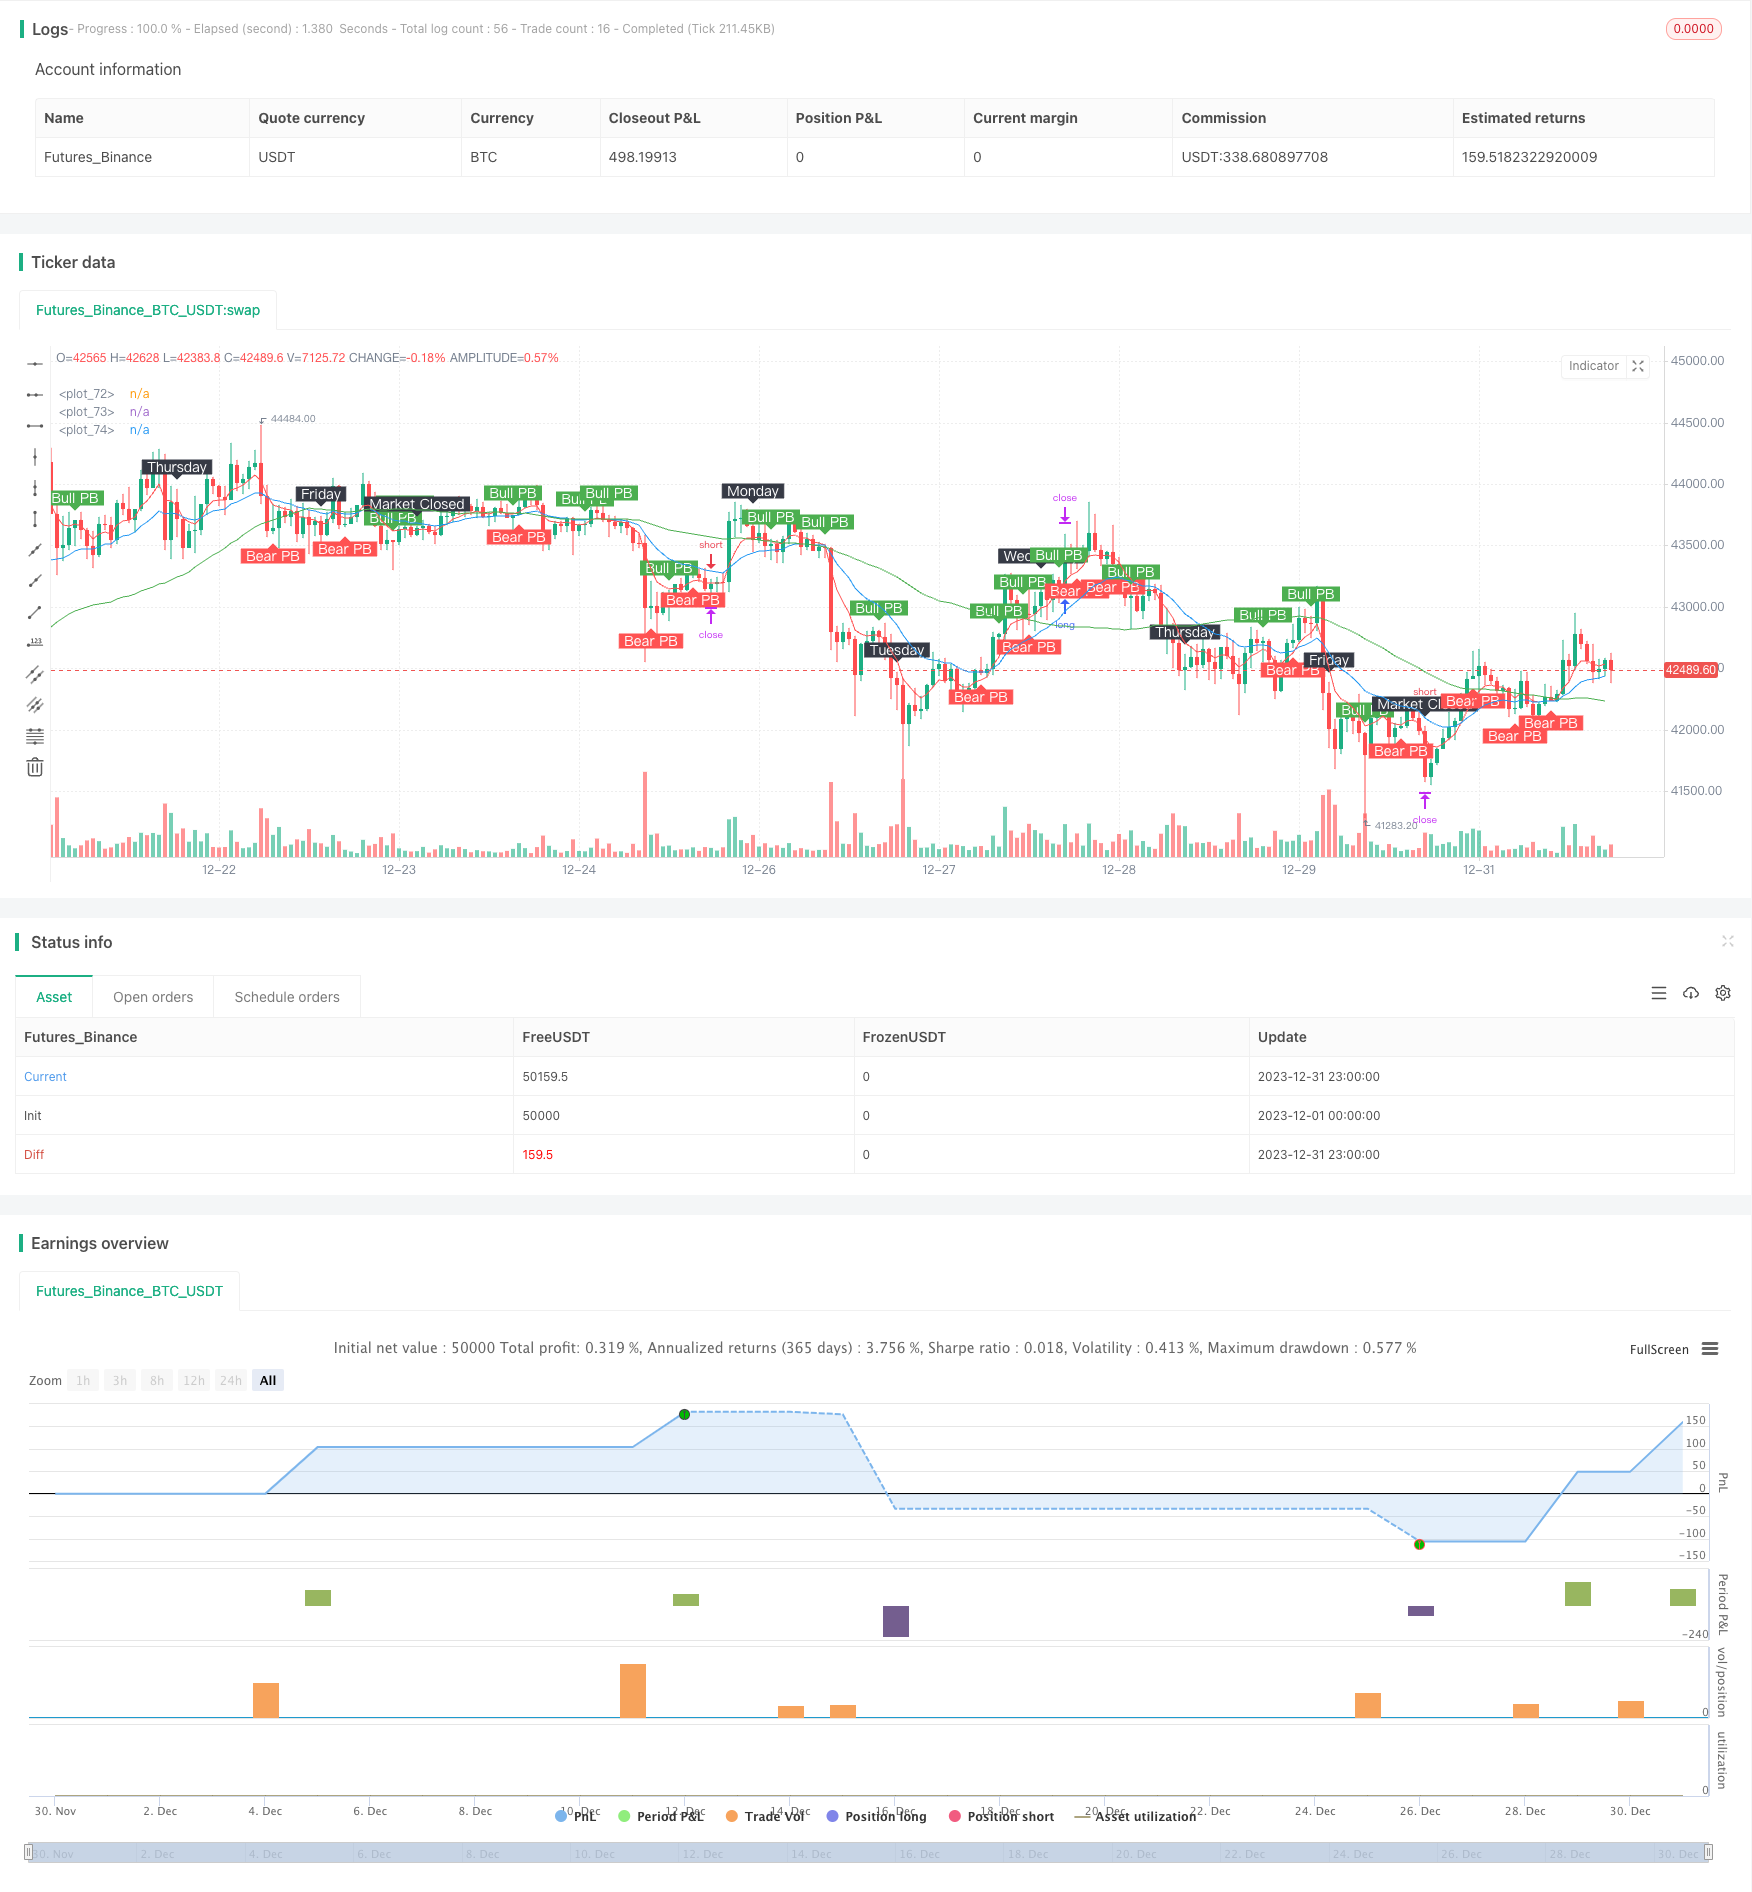
/*backtest
start: 2023-12-01 00:00:00
end: 2023-12-31 23:59:59
period: 1h
basePeriod: 15m
exchanges: [{"eid":"Futures_Binance","currency":"BTC_USDT"}]
*/

//@version=4
//Time Frame: H1
strategy("Pin Bar Magic v1", overlay=true)

// User Input
usr_risk = input(title="Equity Risk (%)",type=input.integer,minval=1,maxval=100,step=1,defval=3,confirm=false)
atr_mult = input(title="Stop Loss (x*ATR, Float)",type=input.float,minval=0.1,maxval=100,step=0.1,defval=0.5,confirm=false)
slPoints = input(title="Stop Loss Trail Points (Pips)",type=input.integer,minval=1,maxval=1000,step=1,defval=1,confirm=false)
slOffset = input(title="Stop Loss Trail Offset (Pips)",type=input.integer,minval=1,maxval=1000,step=1,defval=1,confirm=false)
sma_slow = input(title="Slow SMA (Period)",type=input.integer,minval=1,maxval=500,step=1,defval=50,confirm=false)
ema_medm = input(title="Medm EMA (Period)",type=input.integer,minval=1,maxval=500,step=1,defval=18,confirm=false)
ema_fast = input(title="Fast EMA (Period)",type=input.integer,minval=1,maxval=500,step=1,defval=6,confirm=false)
atr_valu = input(title="ATR (Period)",type=input.integer,minval=1,maxval=500,step=1,defval=14,confirm=false)
ent_canc = input(title="Cancel Entry After X Bars (Period)",type=input.integer,minval=1,maxval=500,step=1,defval=3,confirm=false)

// Create Indicators
slowSMA = sma(close, sma_slow)
medmEMA = ema(close, ema_medm)
fastEMA = ema(close, ema_fast)
bullishPinBar = ((close > open) and ((open - low) > 0.66 * (high - low))) or ((close < open) and ((close - low) > 0.66 * (high - low)))
bearishPinBar = ((close > open) and ((high - close) > 0.66 * (high - low))) or ((close < open) and ((high - open) > 0.66 * (high - low)))
atr = atr(atr_valu)

// Specify Trend Conditions
fanUpTrend = (fastEMA > medmEMA) and (medmEMA > slowSMA)
fanDnTrend = (fastEMA < medmEMA) and (medmEMA < slowSMA)

// Specify Piercing Conditions
bullPierce = ((low < fastEMA) and (open > fastEMA) and (close > fastEMA)) or ((low < medmEMA) and (open > medmEMA) and (close > medmEMA)) or ((low < slowSMA) and (open > slowSMA) and (close > slowSMA))
bearPierce = ((high > fastEMA) and (open < fastEMA) and (close < fastEMA)) or ((high > medmEMA) and (open < medmEMA) and (close < medmEMA)) or ((high > slowSMA) and (open < slowSMA) and (close < slowSMA))

// Specify Entry Conditions
longEntry = fanUpTrend and bullishPinBar and bullPierce
shortEntry = fanDnTrend and bearishPinBar and bearPierce

// Long Entry Function
enterlong() =>
    risk = usr_risk * 0.01 * strategy.equity
    stopLoss = low[1] - atr[1] * atr_mult
    entryPrice = high[1]
    units = risk / (entryPrice - stopLoss)
    strategy.entry("long", strategy.long, units, stop=entryPrice)
    strategy.exit("exit long", from_entry="long", trail_points=slPoints, trail_offset=slOffset)

// Short Entry Function
entershort() =>
    risk = usr_risk * 0.01 * strategy.equity
    stopLoss = high[1] + atr[1] * atr_mult
    entryPrice = low[1]
    units = risk / (stopLoss - entryPrice)
    strategy.entry("short", strategy.short, units, stop=entryPrice)
    strategy.exit("exit short", from_entry="short", trail_points=slPoints, trail_offset=slOffset)

// Execute Long Entry
if (longEntry)
    enterlong()

// Execute Short Entry
if (shortEntry)
    entershort()

// Cancel the Entry if Bar Time is Exceeded
strategy.cancel("long", barssince(longEntry) > ent_canc)
strategy.cancel("short", barssince(shortEntry) > ent_canc)

// Force Close During Certain Conditions
strategy.close_all(when = hour==16 and dayofweek==dayofweek.friday, comment = "exit all, market-closed")
strategy.close_all(when = crossunder(fastEMA, medmEMA), comment = "exit long, re-cross")
strategy.close_all(when = crossover(fastEMA, medmEMA), comment = "exit short, re-cross")

// Plot Moving Averages to Chart
plot(fastEMA, color=color.red)
plot(medmEMA, color=color.blue)
plot(slowSMA, color=color.green)

// Plot Pin Bars to Chart
plotshape(bullishPinBar, text='Bull PB', style=shape.labeldown, location=location.abovebar, color=color.green, textcolor=color.white, transp=0)
plotshape(bearishPinBar, text='Bear PB', style=shape.labelup, location=location.belowbar, color=color.red, textcolor=color.white, transp=0)

// Plot Days of Week
plotshape(hour==0 and dayofweek==dayofweek.monday, text='Monday', style=shape.labeldown, location=location.abovebar, color=color.black, textcolor=color.white, transp=0)
plotshape(hour==0 and dayofweek==dayofweek.tuesday, text='Tuesday', style=shape.labeldown, location=location.abovebar, color=color.black, textcolor=color.white, transp=0)
plotshape(hour==0 and dayofweek==dayofweek.wednesday, text='Wednesday', style=shape.labeldown, location=location.abovebar, color=color.black, textcolor=color.white, transp=0)
plotshape(hour==0 and dayofweek==dayofweek.thursday, text='Thursday', style=shape.labeldown, location=location.abovebar, color=color.black, textcolor=color.white, transp=0)
plotshape(hour==0 and dayofweek==dayofweek.friday, text='Friday', style=shape.labeldown, location=location.abovebar, color=color.black, textcolor=color.white, transp=0)
plotshape(hour==16 and dayofweek==dayofweek.friday, text='Market Closed', style=shape.labeldown, location=location.abovebar, color=color.black, textcolor=color.white, transp=0)
Detail
https://www.fmz.com/strategy/439959
Last Modified
2024-01-25 12:29:29