Name
趋势追踪移动平均线交易策略Trend-Following-Moving-Average-Trading-Strategy
Author
ChaoZhang
Strategy Description
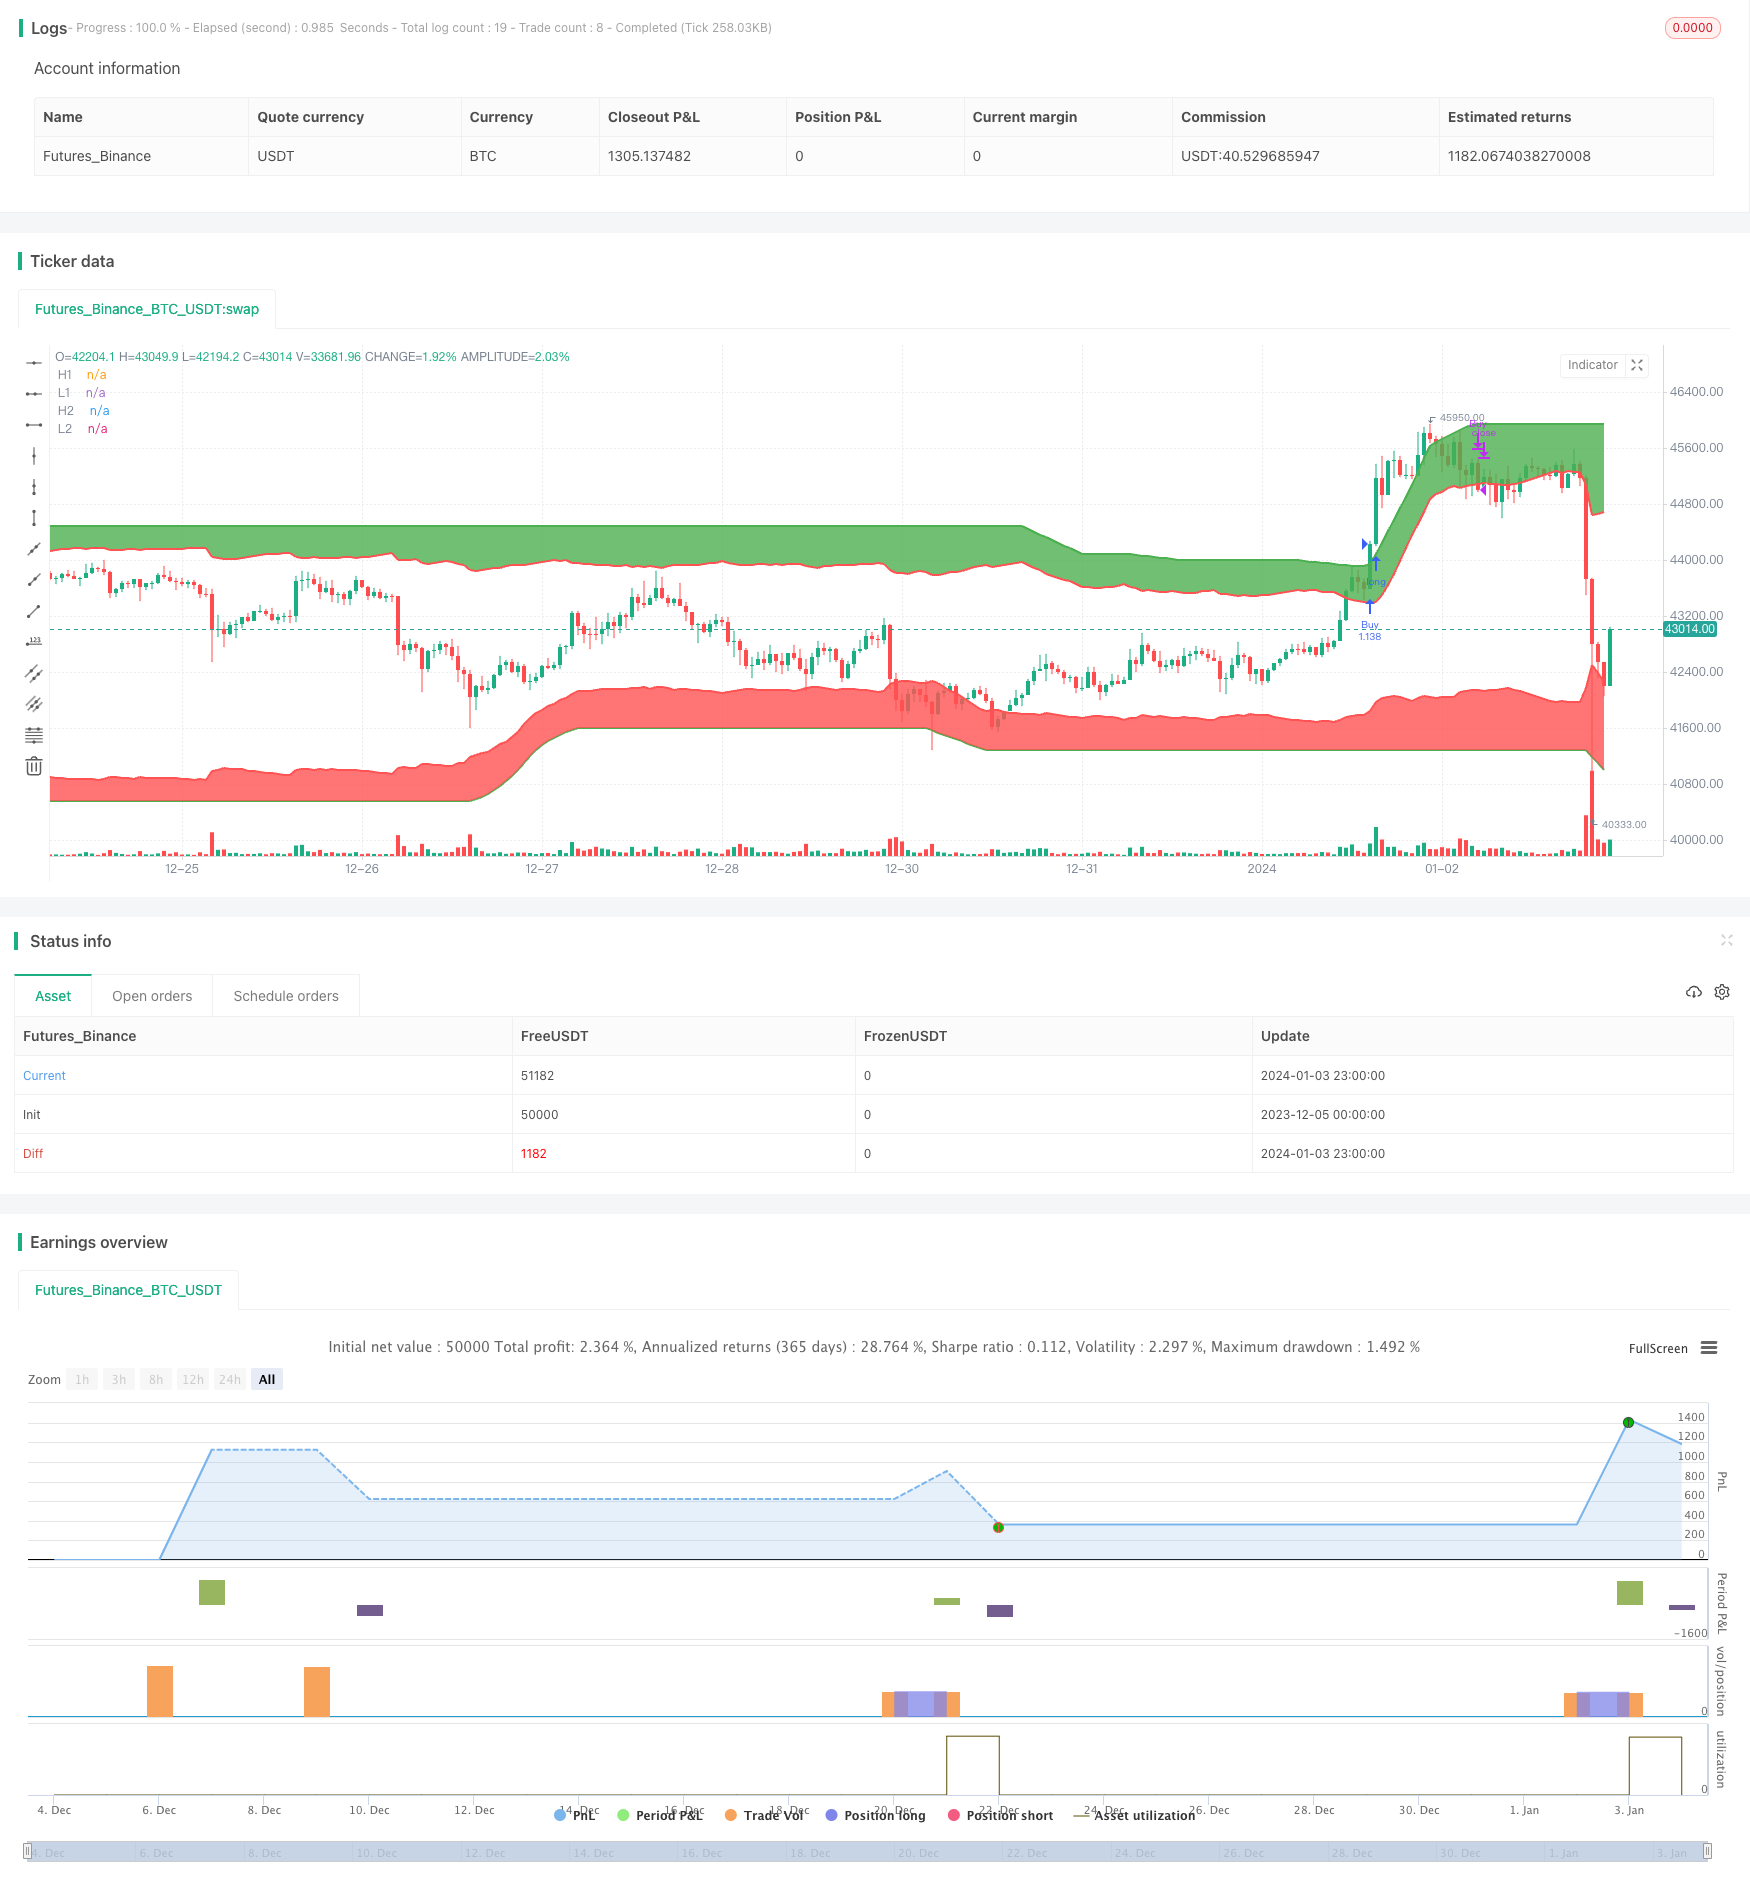
该策略是一种基于趋势追踪移动平均线的交易策略。它利用不同参数设置的最高价和最低价的移动平均线来判断市场趋势,并在趋势转折点 generating 对应的交易信号。当价格突破向上追踪的移动平均线时,做多;当价格跌破向下追踪的移动平均线时,做空。该策略同时利用ATR来设置止损和止盈水平。
该策略使用不同参数设置的最高价和最低价的简单移动平均线来判断市场趋势。具体来说,它创建了两个组追踪移动平均线:
-
h1 和 l1 组成的向上追踪移动平均系统。h1 是最高价的简单移动平均线,表示市场趋势的上轨;l1 是 h1减去ATR值构成的下轨。当价格上穿h1时产生做多信号;当价格下穿l1时产生平仓信号。
-
h2 和 l2 组成的向下追踪移动平均系统。h2 是最低价的简单移动平均线,表示市场趋势的下轨;l2 是 h2加上ATR值构成的上轨。当价格下穿h2时产生做空信号;当价格上穿l2时产生平仓信号。
利用双轨系统可以更准确地判断趋势转折点,过滤掉部分噪音交易。同时,ATR值被用来设置止损和止盈水平,控制每单的风险收益比。
该策略主要有以下几个优势:
- 利用双轨系统过滤噪音,识别趋势转折点更加准确。
- ATR动态跟踪波动率,可以有效控制单笔止损。
- 策略逻辑简单清晰,容易理解实现,适合新手学习。
- 可灵活调整参数,适应不同市场环境。
该策略也存在一些风险:
- 双轨突破产生信号可能滞后,无法充分捕捉趋势开始阶段的机会。
- 追踪移动平均线对曲线形趋势的识别能力较弱。
- 未考虑交易费用的影响。高频交易时交易费用可能比较大。
对策:
- 适当缩短移动平均线周期,使信号更加灵敏。
- 结合其他指标如MACD等判断走势类型,避免在震荡区间高频交易。
- 调整仓位规模,降低交易频率。
该策略可以从以下几个方面进行优化:
- 利用机器学习算法自动优化参数,适应市场环境。
- 结合交易量指标避免假突破。
- 增加微调仓位的规则,让仓位大小与趋势强度挂钩。
- 优化止损机制,运用trailer stop等方式。
该策略整体来说是一个简单实用的趋势追踪策略,核心理念是通过双轨过滤和ATR动态止损来识别趋势转折并限制单笔损失。具有一定的实战价值,同时也有较大的优化空间。通过参数调优、结合其他指标等方式可以获得更好的效果。
||
This strategy is a trend following moving average trading strategy. It uses moving averages of highest and lowest prices with different parameter settings to determine market trends and generate trading signals at turning points. It goes long when price breaks above the upward-tracking moving average line and goes short when price breaks below the downward-tracking line. The strategy also utilizes ATR to set stop loss and take profit levels.
The strategy employs simple moving averages of highest and lowest prices with different parameters to define market trends. Specifically, it creates two sets of tracking moving average systems:
-
The h1 and l1 system tracks the trend from upside. h1 is the simple moving average of highest prices, acting as the upper band of the trend; l1 is constructed by h1 minus the ATR value, serving as the lower band. A long signal is generated when price breaks above h1, and a close signal is generated when price falls below l1.
-
The h2 and l2 system tracks the trend from downside. h2 is the simple moving average of lowest prices, acting as the lower band; l2 is constructed by h2 plus the ATR value, serving as the upper band. A short signal is generated when price breaks below h2, and a close signal is generated when price rises above l2.
The dual-band systems can more accurately identify trend turning points and filter out some noisy trades. Meanwhile, the ATR value is used to set stop loss and take profit levels to control risk-reward ratio per trade.
The main advantages of this strategy include:
- The dual-band system filters noise and identifies turning points more precisely.
- ATR dynamically tracks volatility, enabling effective per trade stop loss control.
- The logic is simple and easy to understand, suitable for beginners to learn.
- Parameters can be flexibly tuned for adapting to different market environments.
There are also some risks associated with this strategy:
- Breakout signals from the bands could lag, missing opportunities at early trend stages.
- Tracking moving averages have weaker ability in catching curved trends.
- Trading costs are not considered. They could be high with high frequency trading.
Solutions:
- Shorten moving average periods for more sensitive signals.
- Incorporate other indicators like MACD to determine trend types, avoiding over-trading in ranging zones.
- Adjust position sizing to lower trading frequency.
The strategy can be optimized from the following aspects:
- Utilize machine learning algorithms to auto-tune parameters for adapting to changing markets.
- Incorporate trading volume to avoid false breakouts.
- Add micro position sizing rules to link position size with trend strength.
- Optimize stop loss mechanisms with trailing stops etc.
In conclusion, this is a simple and practical trend following strategy. The core philosophy is to identify trend turning points and control per trade loss through dual-band filtering and dynamic ATR stops. It has definite practical merits and also large room for optimization. Better performances could be achieved through parameter tuning, incorporating other indicators etc.
[/trans]
Strategy Arguments
| Argument | Default | Description |
|---|---|---|
| v_input_1 | 200 | Highest Length |
| v_input_2 | 10 | Highest Average Length |
| v_input_3 | 200 | Lowest Length |
| v_input_4 | 10 | Lowest Average Length |
| v_input_5 | 14 | ATR Length |
| v_input_6 | 2 | ATR Multiplier |
Source (PineScript)
/*backtest
start: 2023-12-05 00:00:00
end: 2024-01-04 00:00:00
period: 1h
basePeriod: 15m
exchanges: [{"eid":"Futures_Binance","currency":"BTC_USDT"}]
*/

//@version=4
strategy("I Like Winners And Love Loosers!", overlay=true, default_qty_type=strategy.percent_of_equity, default_qty_value=100)

highest_length = input(200, type=input.integer, minval=1, title="Highest Length")
highest_average = input(10, type=input.integer, minval=1, title="Highest Average Length")

lowest_length = input(200, type=input.integer, minval=1, title="Lowest Length")
lowest_average = input(10, type=input.integer, minval=1, title="Lowest Average Length")

atr_length = input(14, type=input.integer, minval=1, title="ATR Length")
atr_multiplier = input(2, type=input.integer, minval=1, title="ATR Multiplier")
a = atr(atr_length) * atr_multiplier

h1 = sma(highest(high, highest_length), highest_average)
l1 = h1 - a

h2 = sma(lowest(low, lowest_length), lowest_average)
l2 = h2 + a

buy1_signal = crossover(close, h1)
sell1_signal = crossunder(close, l1)
strategy.entry("Buy", strategy.long, when=buy1_signal)
strategy.close("Buy", when=sell1_signal)

buy2_signal = crossunder(close, h2)
sell2_signal = crossover(close, l2)
strategy.entry("Sell", strategy.short, when=buy2_signal)
strategy.close("Sell", when=sell2_signal)

y1 = plot(h1, title="H1", color=color.green, transp=50, linewidth=2)
y2 = plot(l1, title="L1", color=color.red, transp=50, linewidth=2)
y3 = plot(h2, title="H2", color=color.green, transp=50, linewidth=2)
y4 = plot(l2, title="L2", color=color.red, transp=50, linewidth=2)

fill(y1,y2,color=color.green)
fill(y3,y4,color=color.red)
Detail
https://www.fmz.com/strategy/437761
Last Modified
2024-01-05 13:48:07