Name
阻力与支撑带动的拉里金叉RSI策略RSIndex-and-Moving-Average-Combination-Strategy
Author
ChaoZhang
Strategy Description
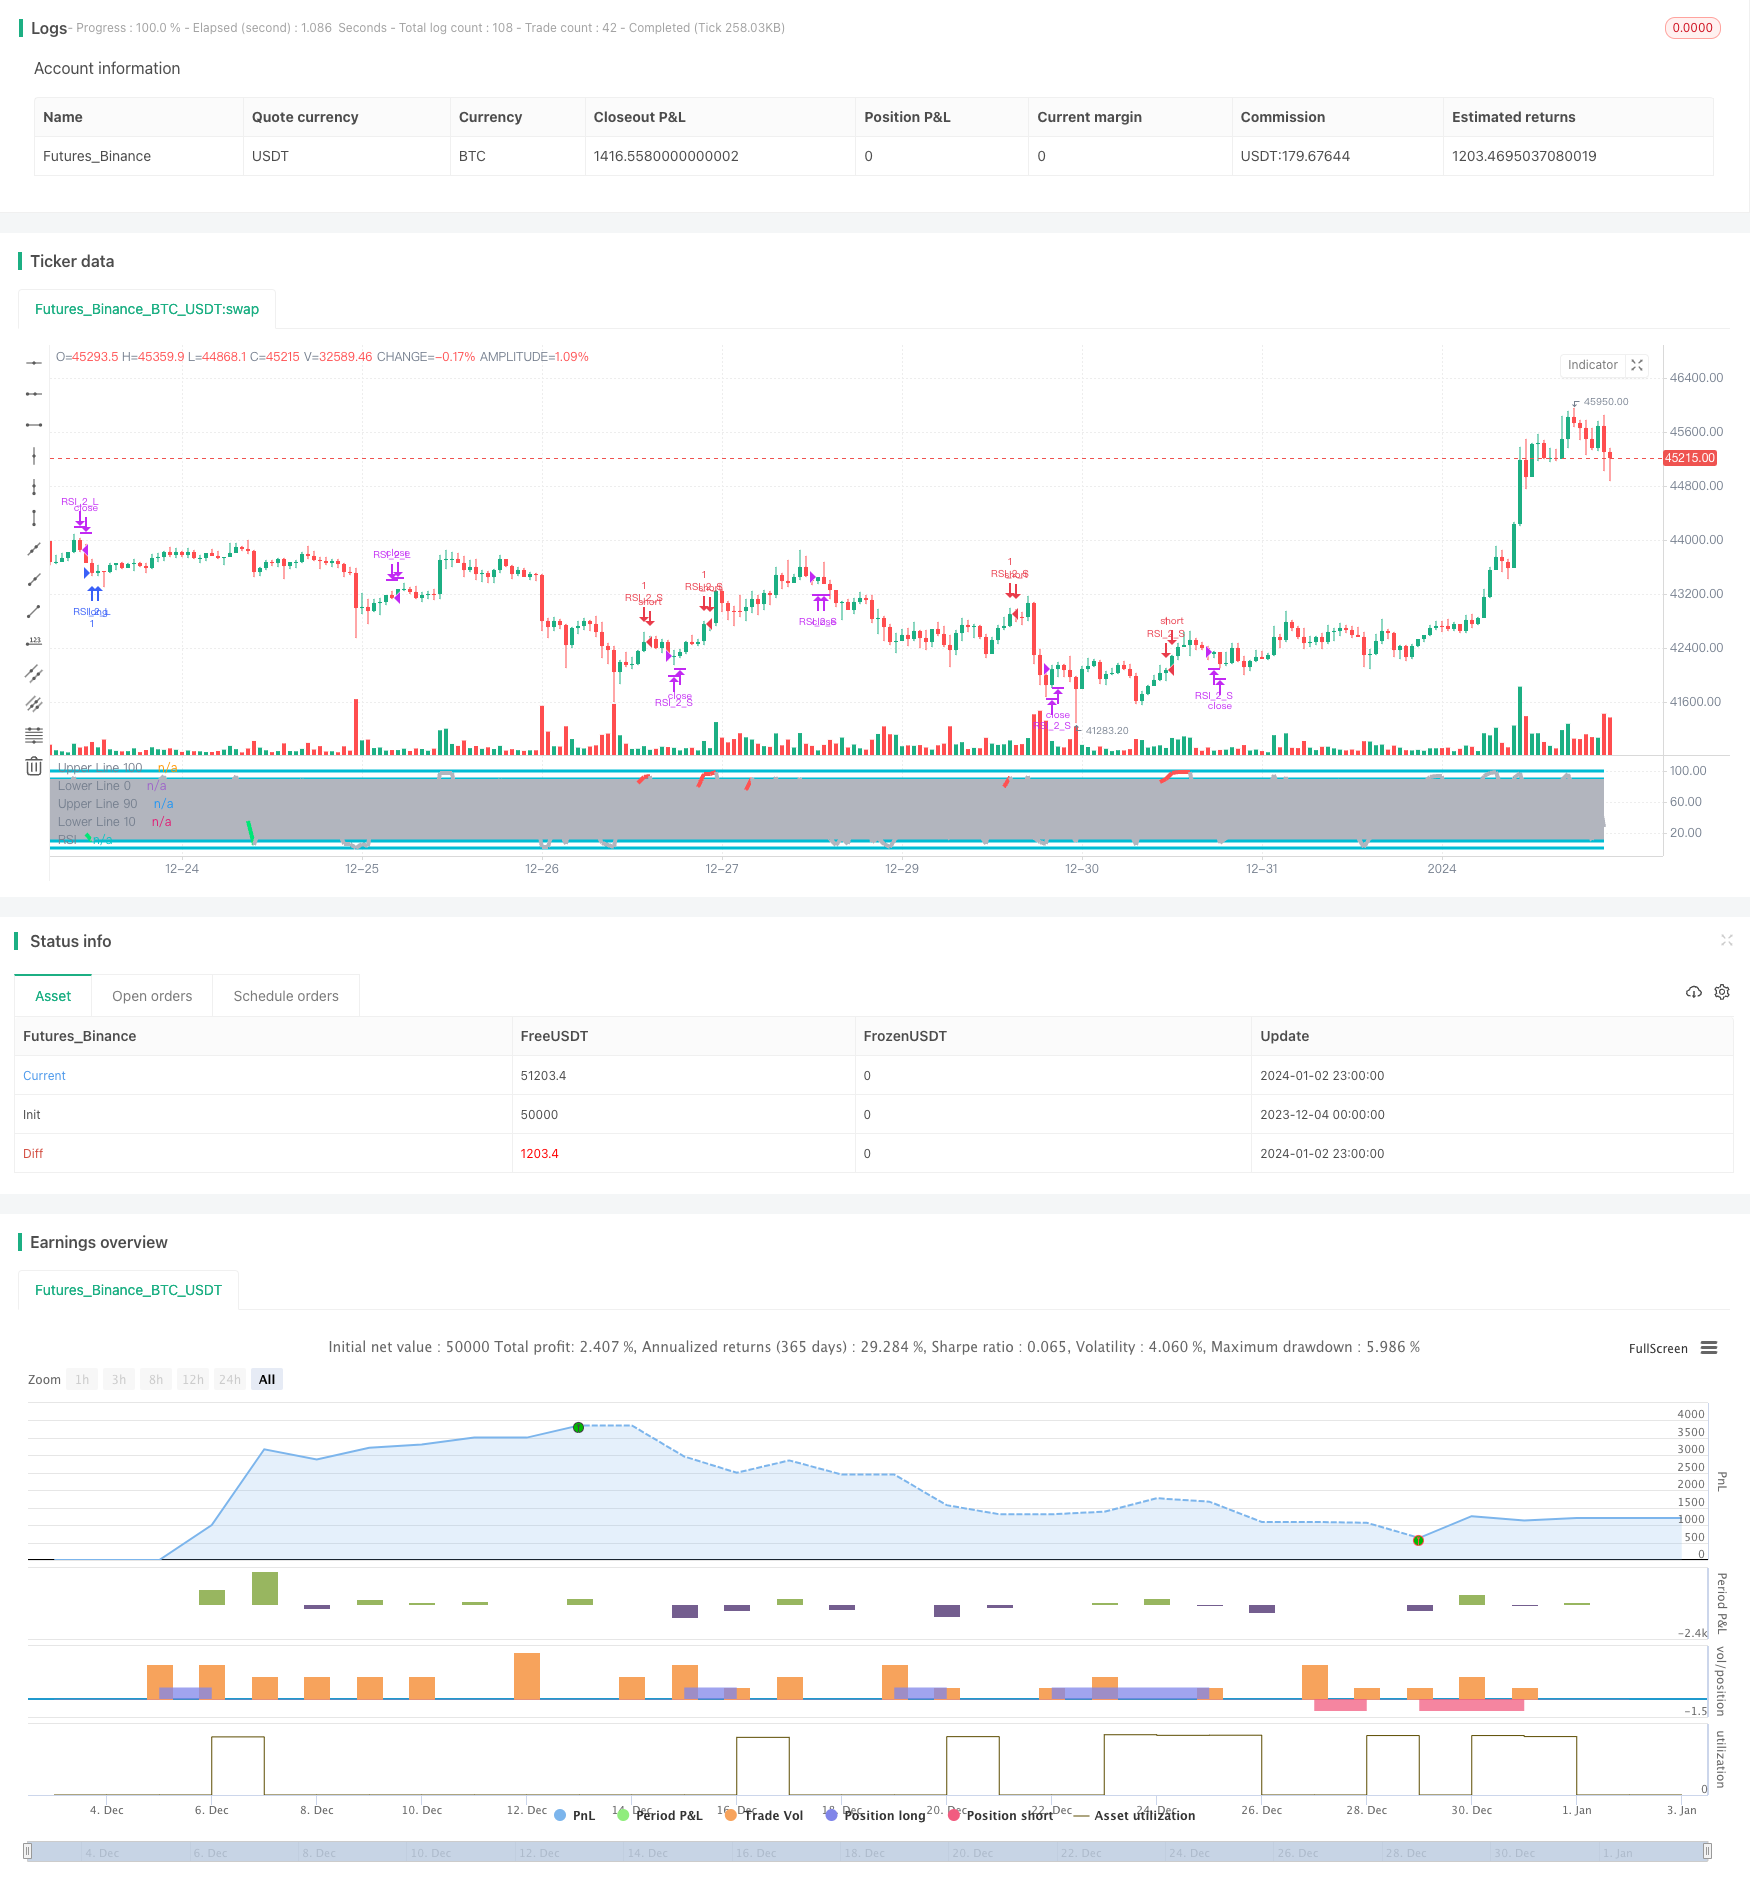
该策略通过计算价格的移动平均线以及相对强弱指标RSI来寻找买卖点,在RSI指标处于超买超卖状态时,发出买入和卖出信号,同时使用 Bollinger Bands 来确定价格的支撑和阻力区域,从而过滤掉一些噪音交易信号。
该策略主要基于 RSI 指标和多条不同周期的移动平均线的组合使用。具体来说,它计算了1日线到200日线等多条MA,以及 RSI 指标。当价格上穿 200日移動平均线,并且 RSI 指标小于 10 时产生买入信号。当价格下破 5 日移动平均线,并且 1 日线下穿 3 日线时产生卖出信号。
该策略同时使用 Bollinger Bands 来确定价格的支撑和阻力区域。 Bollinger Bands 由中轨、上轨和下轨组成。当价格接近上轨时被视为股票高估区域,当价格接近下轨时被视为股票低估区域。所以 Bollinger Bands 能很好地判断目前股票的相对价值。
-
使用 RSI 指标判断超买超卖区域,这是个经典的计量经济学策略,可以捕捉价格反转机会。
-
结合多条 MA 平均线,能增强FILTER FILTERING功能,避免被套。
-
增加 Bollinger Bands 来确定支撑和阻力区域,这能进一步避免在高位追高和在低位追低,过滤噪音交易信号。
-
RSI 指标容易产生误差信号,需要结合价格实体行情判断。
-
MA 移动平均线常被用来判定趋势,但是价格与 MA 发散时会错误判断趋势转折点。
-
Bollinger Bands 上下轨支撑阻力确定具有滞后性,不能准确判定 extrema 临时高点和低点。
-
本策略采取较短持仓时间,可能容易受到短期市场噪音的干扰。
-
可以测试适当延长持仓周期,如将平仓线改为 10 日线或 20 日线。
-
可以测试调整 RSI 参数,如改为 (3,5) 参数或 (2,8) 参数。
-
可以尝试增大 Bollinger Bands 参数来获得更加明显的支撑和阻力区间。
-
可以测试其他指标与 RSI 指标的组合,如 KDJ 指标、MACD 指标等。
-
可以测试 RSI 与量能指标 OBV 的组合。
该策略整体来说较为经典和稳健,运用了多种不同指标的优势,使买卖信号更加准确可靠,同时也存在一些需要优化的方向。关键是要把握住 RSI 指标的趋势判断功能,以及 Bollinger Bands 对支撑和阻力区域的判断。通过适当参数调整和指标组合优化,该策略可以获得更好的效果。
||
This strategy generates trading signals by calculating the moving average lines and the relative strength index (RSI) of prices to identify buying and selling points. It issues buy and sell signals when the RSI indicator reaches overbought or oversold levels. Meanwhile, it uses Bollinger Bands to determine the support and resistance levels of prices to filter out some noisy trading signals.
This strategy is mainly based on the combination of the RSI indicator and multiple moving average lines with different periods. Specifically, it calculates multiple MAs from 1-day to 200-day and the RSI indicator. It generates a buy signal when the price crosses above the 200-day moving average and the RSI indicator drops below 10. It generates a sell signal when the price breaks below the 5-day moving average and the 1-day MA crosses below the 3-day MA.
This strategy also uses Bollinger Bands to determine the support and resistance levels of prices. Bollinger Bands consist of a middle band, an upper band and a lower band. When the price approaches the upper band, the stock is viewed as overvalued. When the price approaches the lower band, the stock is viewed as undervalued. So Bollinger Bands can effectively judge the relative value of the stock.
-
Using the RSI indicator to determine overbought and oversold levels is a classic econometric strategy that can capture price reversal opportunities.
-
Combining multiple MA lines can enhance the filtering function and avoid being trapped.
-
Adding Bollinger Bands to determine support and resistance levels can further avoid chasing high prices and chasing low prices, filtering out noisy trading signals.
-
RSI indicators can easily generate erroneous signals and need to be combined with price action to determine.
-
MA lines are often used to determine trends, but divergence between price and MA may wrongly judge turning points.
-
Determining support and resistance levels using Bollinger Bands upper and lower rails has lagging features and may not accurately determine temporary high and low extrema points.
-
This strategy adopts a relatively short holding period and may be easily disturbed by short-term market noise.
-
Can test appropriately extending the holding period, such as changing the closing line to 10-day or 20-day line.
-
Can test adjusting RSI parameters, such as changing to (3,5) parameters or (2,8) parameters.
-
Can try increasing Bollinger Bands parameters to obtain more obvious support and resistance intervals.
-
Can test combinations of other indicators with RSI, such as KDJ indicator, MACD indicator, etc.
-
Can test the combination of RSI and the volume indicator OBV.
The strategy is relatively classic and robust as a whole, taking advantage of different indicators to make trading signals more accurate and reliable. There are also some directions that need optimization. The key is to grasp the trend judgment function of the RSI indicator and Bollinger Bands' judgement on support and resistance levels. Through appropriate parameter adjustment and indicator combination optimization, this strategy can achieve better results.
[/trans]
Source (PineScript)
/*backtest
start: 2023-12-04 00:00:00
end: 2024-01-03 00:00:00
period: 1h
basePeriod: 15m
exchanges: [{"eid":"Futures_Binance","currency":"BTC_USDT"}]
*/

//@version=2
//Created by ChrisMoody
//Based on Larry Connors RSI-2 Strategy - Lower RSI
strategy(title="_CM_RSI_2_Strat_Low", shorttitle="_CM_RSI_2_Strategy_Lower", overlay=false)
src = close,

//RSI CODE
up = rma(max(change(src), 0), 2)
down = rma(-min(change(src), 0), 2)
rsi = down == 0 ? 100 : up == 0 ? 0 : 100 - (100 / (1 + up / down))
//Criteria for Moving Avg rules
ma1 = sma(close,1)
ma2 = sma(close,2)
ma3 = sma(close,3)
ma4 = sma(close,4)
ma5 = sma(close,5)
ma6 = sma(close,6)
ma7 = sma(close,7)
ma8 = sma(close,8)
ma9 = sma(close,9)
ma200= sma(close, 120)

//Rule for RSI Color
col = close > ma200 and close < ma5 and rsi < 10 ? lime : close < ma200 and close > ma5 and rsi > 90 ? red : silver

plot(rsi, title="RSI", style=line, linewidth=4,color=col)
plot(100, title="Upper Line 100",style=line, linewidth=3, color=aqua)
plot(0, title="Lower Line 0",style=line, linewidth=3, color=aqua)

band1 = plot(90, title="Upper Line 90",style=line, linewidth=3, color=aqua)
band0 = plot(10, title="Lower Line 10",style=line, linewidth=3, color=aqua)
fill(band1, band0, color=silver, transp=90)

///////////// RSI + Bollinger Bands Strategy


if (close > ma200 and rsi < 10 and rsi >1)
    strategy.entry("RSI_2_L", strategy.long, comment="Bullish")
if (close < ma200 and rsi > 90 and rsi <98)
    strategy.entry("RSI_2_S", strategy.short, comment="Bearish")


strategy.close("RSI_2_L", when = close > ma5 and ma1 < ma3)
strategy.close("RSI_2_S", when = close < ma5 and ma1 > ma2)
Detail
https://www.fmz.com/strategy/437685
Last Modified
2024-01-04 17:46:07