Name
高级RSI指标交易策略Advanced-RSI-Indicator-Trading-Strategy
Author
ChaoZhang
Strategy Description
S&P500高级RSI指标交易策略(S&P500 Advanced RSI Indicator Trading Strategy)是一个用于S&P500指数的中长期趋势跟踪策略。该策略结合多种过滤器,在RSI超买超卖信号的基础上进行交易,以控制风险并减少假信号。
该策略的核心指标是RSI,以2周期RSI值为基础判断价格超买超卖。当RSI指标低于设置的超卖线时做多,当RSI指标高于设置的超卖线时平仓。此外,策略还设置了一系列辅助过滤器进行风险控制:
-
每周RSI过滤器:要求每周RSI低于设置线,避免在牛市中过于激进做多
-
MA过滤器:要求价格高于指定周期MA,确保只在趋势启动后买入
-
二次RSI过滤器:要求二次RSI指标也低于超卖线,避免假突破
-
ATR突破过滤器:避免价格快速下跌后仍做多,控制风险
以上多重过滤器结合使用,可有效识别价格中长线反转点,控制交易频率并降低风险。
S&P500高级RSI指标交易策略具有以下几点优势:
-
结合多种辅助指标过滤,减少假信号,可靠性较高
-
通过ATR突破过滤器控制风险,避免价格急跌后追买
-
每周RSI过滤器可避免在牛市中买入,防止过于激进
-
MA过滤器要求价格高于趋势均线后买入,确保趋势启动后再入场
-
二次RSI过滤器避免RSI指标产生假突破做多
-
适用于中长线持仓,不会过于频繁交易
该策略的主要风险来自以下几个方面:
-
使用RSI作为主要指标,会存在一定的滞后性
-
过滤条件过于严格,可能错过部分机会
-
在特大行情中,止损条件可能会被突破
-
基于简单的RSI指标和过滤器,对复杂行情的判断能力较弱
对应缓解方法如下:
-
适当调整参数,防止错过机会
-
加大仓位规模,以弥补一定的漏买概率
-
可适当放宽过滤条件,增加交易频率
-
可考虑结合更多指标判断复杂行情
该策略还可从以下几个方向进行优化:
-
测试调整RSI参数,寻找最优超买超卖线
-
测试MA均线周期参数,确定最优的参数
-
测试调整ATR参数,优化价格突破过滤判断
-
尝试结合其他指标判断,提高对复杂行情的判断能力
-
优化每周RSI参数,确定每周RSI的最优参数
-
优化二次RSI的参数,寻找最佳的二次RSI周期和超买超卖线
S&P500高级RSI指标交易策略通过RSI指标判断价格中长线趋势反转点,并设置多种过滤器条件控制风险。该策略充分利用RSI指标的效用之处,可有效锁定中长线趋势,避免过于频繁出入场。随着参数不断优化,策略表现有望不断改进。总体来说,该策略适用于中长线价值投资,是一种相对稳定的量化策略。
||
The S&P500 Advanced RSI Indicator Trading Strategy is a medium to long term trend following strategy for trading the S&P500 index. This strategy combines multiple filters with RSI overbought and oversold signals to control risk and reduce false signals.
The core indicator of this strategy is RSI, using 2 period RSI to determine price overbought and oversold levels. It goes long when RSI drops below the oversold line and closes position when RSI rises above the overbought line. In addition, the strategy has a series of auxiliary filters to control risk:
-
Weekly RSI Filter: Requires weekly RSI to be below a threshold to avoid overly aggressive longs in a bull market.
-
MA Filter: Requires price to be above a certain MA period to ensure entering after an uptrend has started.
-
Secondary RSI Filter: Requires the secondary RSI indicator also drops below oversold line to avoid false breakouts.
-
ATR Breakout Filter: Avoids going long after a sharp price drop to control risk.
The combination of these multiple filters can effectively identify medium to long term price reversal points, control trade frequency and reduce risk.
The S&P500 Advanced RSI Indicator Trading Strategy has the following advantages:
-
Combining multiple auxiliary indicators reduces false signals and improves reliability.
-
The ATR breakout filter controls risk by avoiding buying after a price crash.
-
Weekly RSI filter prevents overly aggressive longs in a bull market.
-
MA filter ensures entering after an uptrend has started.
-
Secondary RSI filter avoids false RSI breakouts.
-
Suitable for medium to long term holding and avoids overtrading.
The main risks of this strategy come from the following aspects:
-
RSI as the main indicator has some lagging.
-
Filter conditions could be too strict and miss opportunities.
-
Stop loss could be taken out during flash crashes.
-
Simple RSI and filters have limited capabilities in complex market conditions.
Corresponding mitigations:
-
Adjust parameters to avoid missing trades.
-
Increase position sizing to account for some missed trades.
-
Relax filter conditions moderately to increase trade frequency.
-
Consider combining more indicators for complex market analysis.
The strategy can be further optimized in the following directions:
-
Test adjusting RSI parameters to find optimal overbought/oversold lines.
-
Test MA period parameters to determine optimal values.
-
Test adjusting ATR parameters to optimize price breakout filters.
-
Try combining other indicators for better analysis of complex markets.
-
Optimize weekly RSI parameters to find optimal settings.
-
Optimize secondary RSI parameters including period and overbought/oversold lines.
The S&P500 Advanced RSI Indicator Trading Strategy identifies medium to long term trend reversal points using RSI and multiple filter conditions to control risk. It utilizes the strengths of RSI effectively to lock in medium/long term trends and avoid overtrading. As parameters continue to be optimized, strategy performance can continue improving. Overall it is suitable for medium to long term value investing and is a relatively stable quantitative strategy.
[/trans]
Strategy Arguments
| Argument | Default | Description |
|---|---|---|
| v_input_1 | 2 | Base RSI Length |
| v_input_2 | 10 | Overbought Level |
| v_input_3 | 90 | Oversold Level |
| v_input_4 | 70 | Overbought Level Exit |
| v_input_5 | true | Enable Weekly RSI Filter |
| v_input_6 | 30 | Weekly Oversold Level |
| v_input_7 | 70 | Weekly OverOverbought Level |
| v_input_8 | 2 | weeklyRsiLength |
| v_input_9 | false | Enable MA Filter |
| v_input_10 | 100 | WMA Length |
| v_input_11 | 4 | Exit RSI Length |
| v_input_12 | 4 | Daily RSI Length |
| v_input_13 | false | Enable 2nd RSI Filter |
| v_input_14 | 14 | 2nd RSI Filter Length |
| v_input_15 | 20 | 2nd RSI Filter Oversold Level |
| v_input_16 | true | Enable ATR Filter |
| v_input_17 | 14 | Number of Days ATR Average |
| v_input_18 | 2 | ATR Filter Factor |
Source (PineScript)
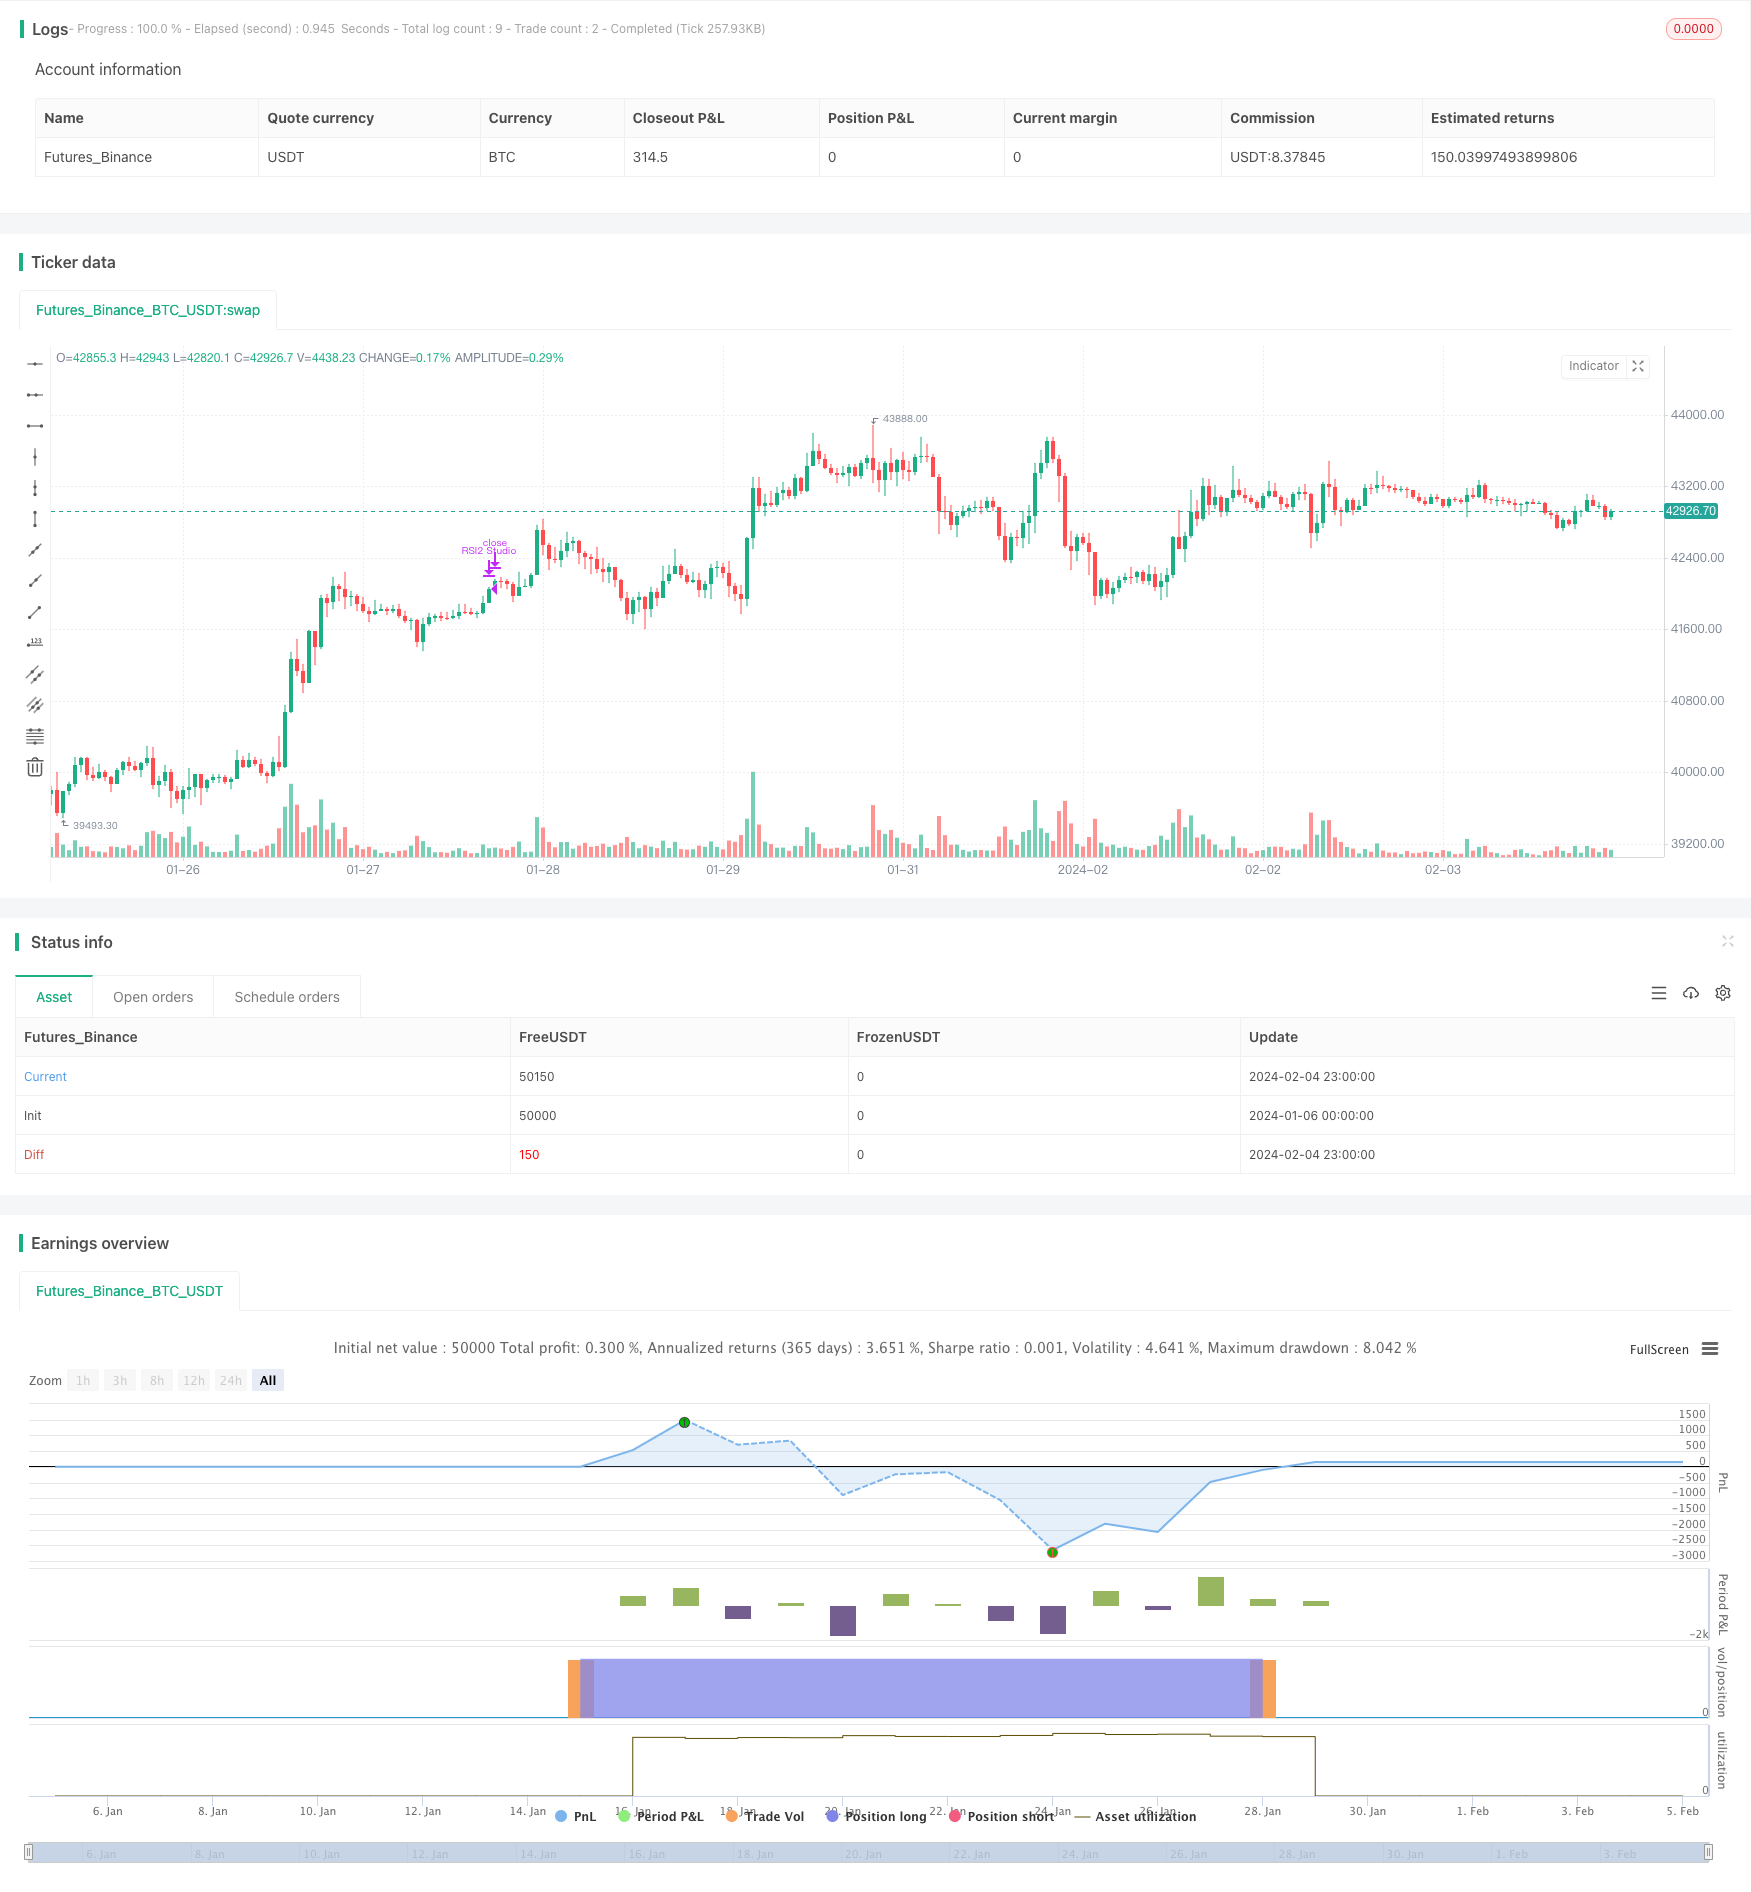
/*backtest
start: 2024-01-06 00:00:00
end: 2024-02-05 00:00:00
period: 1h
basePeriod: 15m
exchanges: [{"eid":"Futures_Binance","currency":"BTC_USDT"}]
*/

//@version=5
// Lets connect on LinkedIn (https://www.linkedin.com/in/lets-grow-with-quality/)
// Optimized for S&P500 Daily. Use it as a buy confirmation on certain levels (Springs, Pullbacks, ...) or let it run
// without "Weekly RSI Filter" and pyramiding for 4 x more trades.
// This strategy is optimized for minimum drawdowns and has several filters on board for use on different securities

strategy("S&P500 RSI2 Studio", overlay=true)

baseLength = input(2, title="Base RSI Length")
overSold = input(10, title="Overbought Level")
overBought = input(90, title="Oversold Level")
overBoughtExit = input(70, title="Overbought Level Exit")
enableWeeklyRsiFilter = input(true, title="Enable Weekly RSI Filter")
weeklyOverSold = input(30, title="Weekly Oversold Level")
weeklyOverBought = input(70, title="Weekly OverOverbought Level")
weeklyRsiLength = input(2, title="weeklyRsiLength")

enableWmaFilter = input(false, title="Enable MA Filter")
wmaLength = input(100, title="WMA Length")

exitRsiLength = input(4, title="Exit RSI Length")
dailyRsiLength = input(4, title="Daily RSI Length")

enable2ndRSIFilter = input(false, title="Enable 2nd RSI Filter")
SecRSIFilterLengh = input(14, title="2nd RSI Filter Length")
SecRSIFilterOverSold = input(20, title="2nd RSI Filter Oversold Level")

enableAtrFilter = input(true, title="Enable ATR Filter")
numAtrDays = input(14, title="Number of Days ATR Average")
atrFilterFactor = input(2, title="ATR Filter Factor")

weeklyRsi = request.security(syminfo.tickerid, "W", ta.wma(ta.rsi(close, weeklyRsiLength), 1))
exitRsi = request.security(syminfo.tickerid, "D", ta.wma(ta.rsi(close, exitRsiLength), 2))
dailyRsi = request.security(syminfo.tickerid, "D", ta.wma(ta.rsi(close, dailyRsiLength), 2))
price = close

priceDropCondition = ta.atr(1) >= ta.atr(numAtrDays) * atrFilterFactor
preventEarlyEntry = not priceDropCondition

vrsi = ta.wma(ta.rsi(price, baseLength), 2)
wma = ta.wma(price, wmaLength)


buyCond1 = ta.crossunder(vrsi, overSold)
buyCond2 = enableWeeklyRsiFilter ? weeklyRsi < weeklyOverSold : true
buyCond3 = enable2ndRSIFilter ? ta.wma(ta.rsi(close, SecRSIFilterLengh),2) < SecRSIFilterOverSold : true
buyCond4 = enableWmaFilter ? price > ta.wma(close, wmaLength) : true
buyCond5 = enableAtrFilter ? preventEarlyEntry : true

buy = buyCond1 and buyCond2 and buyCond3 and buyCond4 and buyCond5

if (not na(vrsi))
    if buy
        strategy.entry("RSI2 Studio", strategy.long, comment="Long")

if (exitRsi > overBoughtExit)
    strategy.close("RSI2 Studio", comment="Close Long")
Detail
https://www.fmz.com/strategy/441158
Last Modified
2024-02-06 11:47:59