Name
10SMA与MACD双重趋势跟踪交易策略-10SMA-and-MACD-Dual-Trend-Following-Trading-Strategy
Author
ChaoZhang
Strategy Description
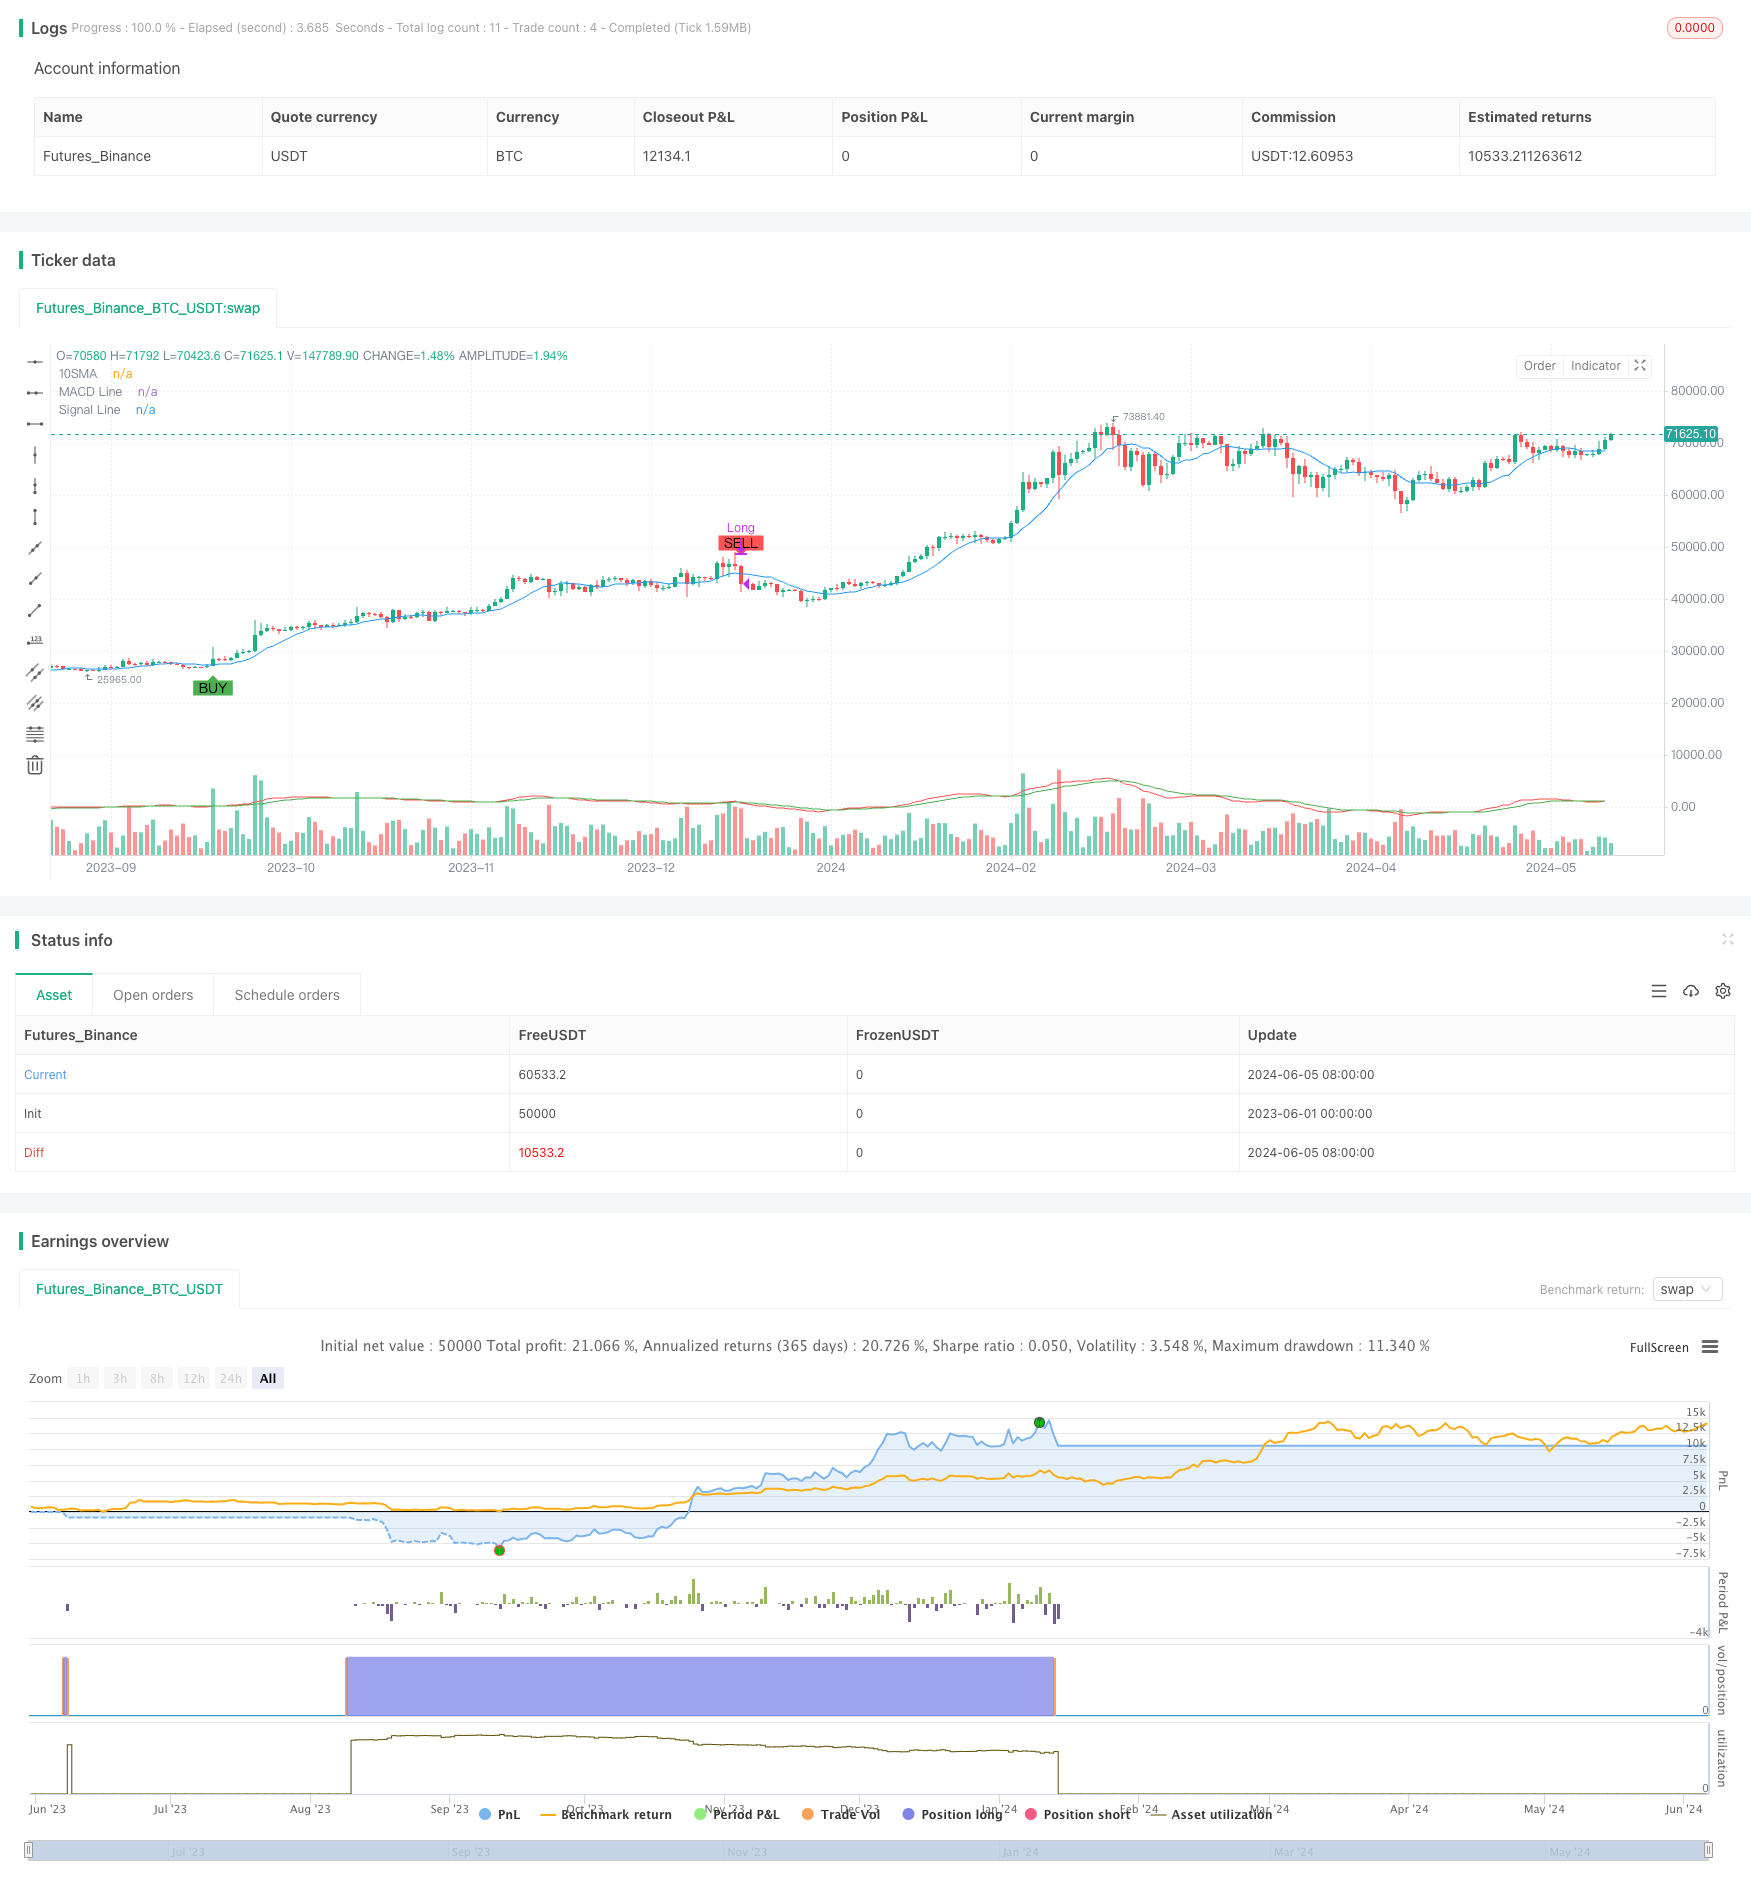
该策略利用10日简单移动平均线(10SMA)和移动平均线收敛散度指标(MACD)两个技术指标,通过它们的交叉信号来判断价格的趋势方向,从而进行交易决策。当价格上穿10SMA且MACD快线上穿慢线时,产生做多信号;当价格下穿10SMA且MACD快线下穿慢线时,平仓多单。该策略试图捕捉市场的趋势性机会,同时通过两个指标的共同确认来提高信号的可靠性。
- 计算10日简单移动平均线(10SMA),作为判断价格趋势的参考。当价格在10SMA上方运行时,意味着多头趋势占优;反之则意味着空头趋势占优。
- 计算MACD指标,包括MACD快线、慢线和柱状图。MACD指标通过对短期和长期移动平均线的差值进行double smoothing来反映价格的趋势强度和方向。
- 产生交易信号:
- 做多信号:当前收盘价上穿10SMA,且MACD快线上穿MACD慢线
- 平多信号:当前收盘价下穿10SMA,且MACD快线下穿MACD慢线
- 根据交易信号执行交易:
- 做多信号出现时,开多仓
- 平多信号出现时,平掉所有多仓
该策略的核心是利用价格与10SMA的位置关系以及MACD快慢线的交叉来判断趋势,两个指标的共同确认可以一定程度上提高信号的有效性和可靠性。
- 简单易用:该策略只使用了两个常见技术指标,原理简单,计算和应用都比较容易。
- 趋势跟踪:通过10SMA和MACD的结合使用,该策略能够较好地捕捉和跟踪市场的中长期趋势。
- 过滤噪音:相比单独使用价格或者某一指标产生信号,两个指标的共同确认可以在一定程度上过滤掉市场噪音和虚假信号。
- 适应性强:该策略对参数的选择不是非常敏感,适应性较强,可以应用于不同的市场和品种。
- 滞后风险:移动平均线和MACD都是滞后指标,交易信号相对于市场走势可能存在一定的滞后,导致错失最佳入场时机或者盈利空间的减少。
- 振荡市风险:在振荡市场中,价格和指标可能出现频繁的交叉,产生交易信号,导致过度交易和手续费的增加。
- 突发事件风险:该策略主要基于技术指标产生交易信号,并没有考虑基本面因素和突发事件的影响,面对黑天鹅事件可能会出现较大回撤。
- 参数优化风险:该策略的表现会受到参数选择的影响,不同参数可能产生不同结果,存在参数优化的风险。
- 加入其他过滤条件:可以考虑加入其他技术指标或者条件,如交易量、波动率等,以进一步提高信号的可靠性和有效性。
- 优化止盈止损:可以根据市场特点和个人风险偏好,设置适当的止盈止损条件,以控制单次交易的风险敞口和盈亏比。
- 动态参数优化:可以通过参数优化的方法,根据不同市场状态和品种特点,动态调整指标参数,以适应市场的变化。
- 结合基本面分析:将技术分析与基本面分析相结合,考虑重要的经济数据、政策事件等因素对市场的影响,以提高策略的全面性和有效性。
10SMA与MACD双重趋势跟踪交易策略通过两个常用技术指标的结合使用,以简单易用的方式来捕捉市场的中长期趋势性机会。相比单独使用某一指标,两个指标的共同确认可以一定程度上提高信号的可靠性和有效性,同时也具有一定的适应性。但是,该策略也存在滞后、振荡市和突发事件等风险,实际应用中需要根据市场特点和个人偏好进行适当的优化和改进,如加入其他过滤条件、优化止盈止损、动态参数优化和结合基本面分析等,以进一步提升策略的稳健性和盈利能力。
||
This strategy utilizes two technical indicators, the 10-day Simple Moving Average (10SMA) and the Moving Average Convergence Divergence (MACD), to determine the trend direction of the price and make trading decisions based on their crossover signals. When the price crosses above the 10SMA and the MACD fast line crosses above the slow line, a long signal is generated; when the price crosses below the 10SMA and the MACD fast line crosses below the slow line, the long position is closed. The strategy aims to capture trending opportunities in the market while improving the reliability of signals through the confirmation of two indicators.
- Calculate the 10-day Simple Moving Average (10SMA) as a reference for determining the price trend. When the price is running above the 10SMA, it indicates a bullish trend; otherwise, it indicates a bearish trend.
- Calculate the MACD indicator, including the MACD fast line, slow line, and histogram. The MACD indicator reflects the strength and direction of the price trend by performing double smoothing on the difference between the short-term and long-term moving averages.
- Generate trading signals:
- Long signal: The current closing price crosses above the 10SMA, and the MACD fast line crosses above the MACD slow line.
- Close long signal: The current closing price crosses below the 10SMA, and the MACD fast line crosses below the MACD slow line.
- Execute trades based on the trading signals:
- When a long signal appears, open a long position.
- When a close long signal appears, close all long positions.
The core of this strategy is to determine the trend using the relationship between the price and the 10SMA, as well as the crossover of the MACD fast and slow lines. The confirmation from both indicators can improve the validity and reliability of signals to a certain extent.
- Simple and easy to use: The strategy only uses two common technical indicators, with simple principles that are easy to calculate and apply.
- Trend following: By combining the 10SMA and MACD, the strategy can effectively capture and follow the medium to long-term trends in the market.
- Noise filtering: Compared to using price or a single indicator alone to generate signals, the confirmation from two indicators can filter out market noise and false signals to a certain extent.
- High adaptability: The strategy is not very sensitive to parameter selection and has strong adaptability, making it applicable to different markets and instruments.
- Lag risk: Moving averages and MACD are lagging indicators, and trading signals may have a certain lag relative to market movements, resulting in missing the best entry timing or reduced profit potential.
- Choppy market risk: In choppy markets, the price and indicators may experience frequent crossovers, generating trading signals that lead to overtrading and increased transaction costs.
- Unexpected event risk: The strategy mainly generates trading signals based on technical indicators and does not consider the impact of fundamental factors and unexpected events, which may result in significant drawdowns in the face of black swan events.
- Parameter optimization risk: The performance of the strategy will be affected by the selection of parameters, and different parameters may produce different results, leading to the risk of parameter optimization.
- Add other filtering conditions: Consider adding other technical indicators or conditions, such as trading volume, volatility, etc., to further improve the reliability and effectiveness of signals.
- Optimize take profit and stop loss: Set appropriate take profit and stop loss conditions based on market characteristics and personal risk preferences to control the risk exposure and risk-reward ratio of each trade.
- Dynamic parameter optimization: Use parameter optimization methods to dynamically adjust indicator parameters based on different market conditions and instrument characteristics to adapt to market changes.
- Combine with fundamental analysis: Combine technical analysis with fundamental analysis, considering the impact of important economic data, policy events, and other factors on the market to improve the comprehensiveness and effectiveness of the strategy.
The 10SMA and MACD Dual Trend Following Trading Strategy combines two commonly used technical indicators to capture medium to long-term trending opportunities in the market in a simple and easy-to-use manner. Compared to using a single indicator, the confirmation from two indicators can improve the reliability and effectiveness of signals to a certain extent while also having a certain level of adaptability. However, the strategy also faces risks such as lag, choppy markets, and unexpected events. In practical application, appropriate optimization and improvements need to be made based on market characteristics and personal preferences, such as adding other filtering conditions, optimizing take profit and stop loss, dynamic parameter optimization, and combining with fundamental analysis to further enhance the robustness and profitability of the strategy.
[/trans]
Source (PineScript)
/*backtest
start: 2023-06-01 00:00:00
end: 2024-06-06 00:00:00
period: 1d
basePeriod: 1h
exchanges: [{"eid":"Futures_Binance","currency":"BTC_USDT"}]
*/

//@version=5
strategy("10SMA and MACD Strategy", overlay=true)

// Input parameters
length = input(10, title="SMA Length")
macdFastLength = input(12, title="MACD Fast Length")
macdSlowLength = input(26, title="MACD Slow Length")
macdSignalSmoothing = input(9, title="MACD Signal Smoothing")

// Calculate 10SMA
sma10 = ta.sma(close, length)
plot(sma10, title="10SMA", color=color.blue)

// Calculate MACD
[macdLine, signalLine, _] = ta.macd(close, macdFastLength, macdSlowLength, macdSignalSmoothing)
plot(macdLine, title="MACD Line", color=color.red)
plot(signalLine, title="Signal Line", color=color.green)

// Strategy conditions
longCondition = ta.crossover(close, sma10) and ta.crossover(macdLine, signalLine)
shortCondition = ta.crossunder(close, sma10) and ta.crossunder(macdLine, signalLine)

// Plot buy and sell signals
plotshape(series=longCondition, location=location.belowbar, color=color.green, style=shape.labelup, text="BUY")
plotshape(series=shortCondition, location=location.abovebar, color=color.red, style=shape.labeldown, text="SELL")

// Strategy execution
if (longCondition)
    strategy.entry("Long", strategy.long)

if (shortCondition)
    strategy.close("Long")
Detail
https://www.fmz.com/strategy/453645
Last Modified
2024-06-07 14:46:36