Name
15分钟图表吞没突破多重确认策略-15-Minute-Engulfing-Breakout-Multi-Confirmation-Strategy
Author
ianzeng123
Strategy Description
[trans]
15分钟图表吞没突破多重确认策略是一种基于价格行为和烛台形态的技术分析交易系统,专为15分钟时间周期设计。该策略核心依据是识别吞没形态,并结合多重确认条件触发交易信号,据统计其胜率可达76%。策略通过检测看涨和看跌吞没形态,然后验证价格是否突破之前两个相反方向的吞没形态水平,以此过滤掉低质量信号,提高交易成功率。该策略同时内置止损和止盈机制,有效控制风险,提高资金管理效率。
该吞没突破多重确认策略的核心原理基于几个关键技术要素:
-
吞没形态识别:
- 看涨吞没形态:当前蜡烛为阳线,前一根蜡烛为阴线,且当前蜡烛的开盘价低于前一蜡烛的收盘价,收盘价高于前一蜡烛的开盘价
- 看跌吞没形态:当前蜡烛为阴线,前一根蜡烛为阳线,且当前蜡烛的开盘价高于前一蜡烛的收盘价,收盘价低于前一蜡烛的开盘价
-
多重确认系统:
- 策略使用数组存储最近10个吞没形态的价格水平(看涨吞没高点和看跌吞没低点)
- 交易信号必须通过突破至少两个之前相反吞没形态的价格水平来确认
-
交易区域设定:
- 看涨信号:当检测到看涨吞没形态且突破至少两个之前的看跌吞没低点时,设定买入区域
- 看跌信号:当检测到看跌吞没形态且突破至少两个之前的看涨吞没高点时,设定卖出区域
-
入场条件:
- 多头入场:价格低点触及买入区域高点并且收盘价高于买入区域低点
- 空头入场:价格高点触及卖出区域低点并且收盘价低于卖出区域高点
-
风险管理:
- 使用基于吞没区域的动态止损位,加上额外的点差保护(30倍点差大小)
- 同样基于吞没区域设置动态止盈位,确保风险回报比合理
通过这种多层次的确认机制,策略能够有效过滤市场噪音,捕捉高概率交易机会。
深入分析代码结构和逻辑,该策略具有以下显著优势:
-
多重确认过滤机制:通过要求突破至少两个之前相反方向的吞没形态,显著提高了信号质量,减少了假突破带来的亏损风险。
-
动态交易区域:不同于固定价格水平的策略,此策略根据实时价格形态动态调整交易区域,更好地适应市场变化。
-
高胜率表现:代码注释中提到的76%胜率表明该策略在15分钟图表上有稳定的表现,远高于大多数交易系统的平均水平。
-
智能风险管理:通过设定与交易区域相关的止损止盈位置,每笔交易都有明确的退出计划,规避了情绪化交易的风险。
-
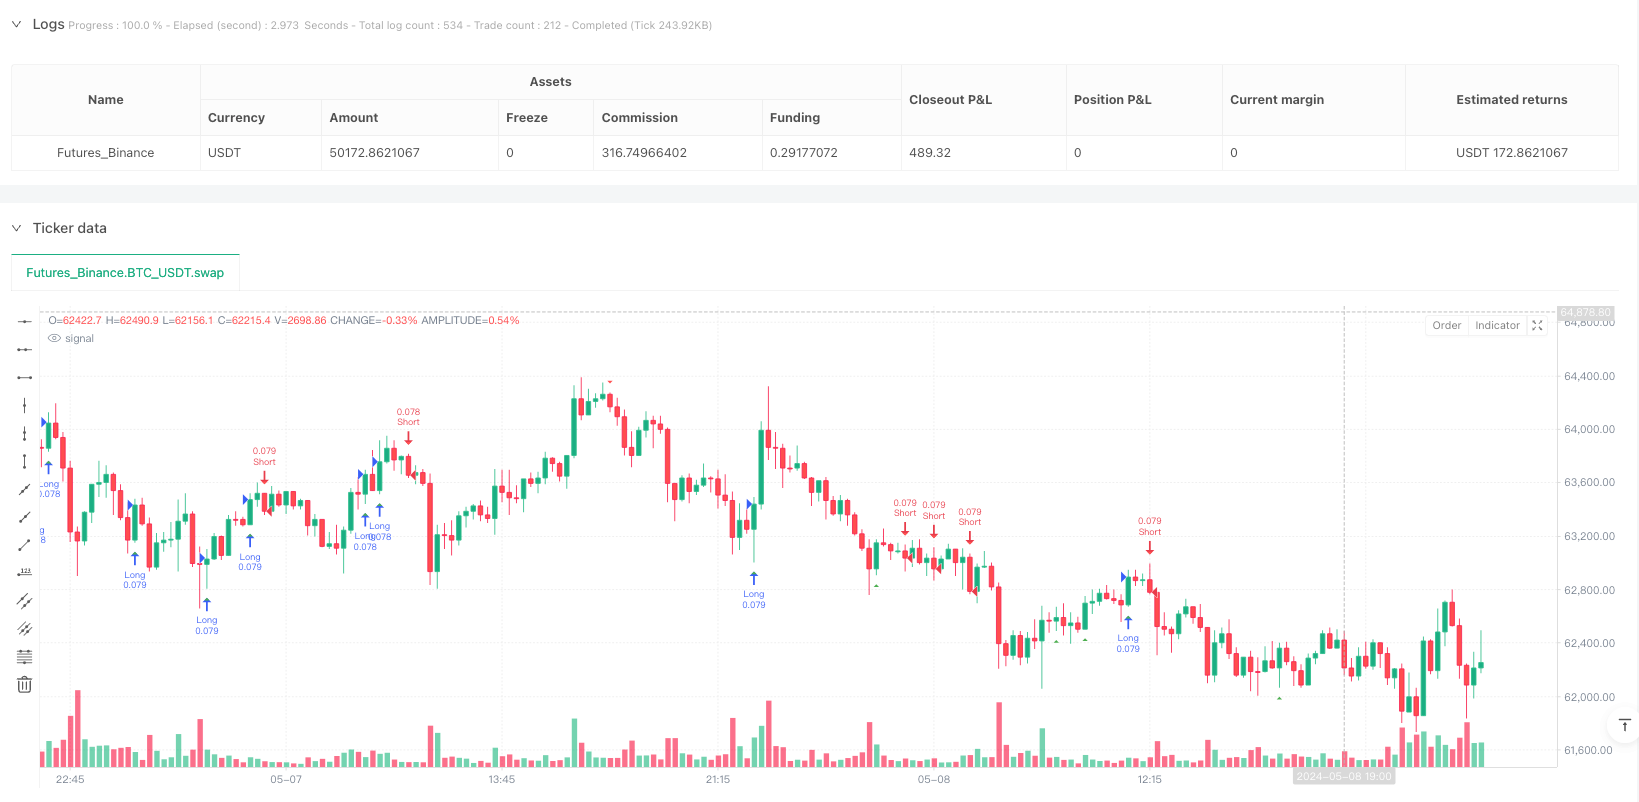
清晰的可视化:通过在图表上标记吞没形态(三角形标记),交易者可以直观理解策略的运作原理和信号生成过程。
-
灵活的资金管理:策略默认使用账户权益的百分比(10%)进行头寸管理,有助于保持风险敞口的一致性,并支持账户的长期增长。
-
适应市场转向:由于策略同时监控看涨和看跌吞没形态,能够自适应地在上升趋势和下降趋势中表现良好。
尽管该策略有许多优势,通过代码分析,我们也发现了一些潜在风险点:
-
快速波动市场的风险:在高波动市场中,价格可能迅速突破吞没区域然后反转,导致止损被触发。解决方法:可以考虑在波动性指标(如ATR)较高时调整止损距离或暂停交易。
-
错过大趋势:由于策略在每次信号触发后就重置相应的交易区域(设为na),可能会错过大趋势中的连续机会。解决方法:可以添加趋势过滤器,在强趋势中保持方向性偏好。
-
资金管理固定化:策略设定了固定的权益百分比(10%)用于每笔交易,没有根据交易情况的不同风险特征调整头寸大小。解决方法:考虑根据止损距离或市场波动性动态调整头寸规模。
-
点差设置优化:策略使用固定的点差(30×点差大小)来调整止损和止盈位置,这在不同交易品种上可能需要调整。解决方法:将点差大小参数化,根据不同交易品种的特性进行优化。
-
回撤风险:连续失败的交易可能导致账户出现显著回撤,尤其是在市场结构发生变化时。解决方法:考虑添加整体市场健康度的过滤器,或在连续亏损后自动降低交易规模。
-
过度优化风险:代码中没有明显的时间过滤或其他市场状态过滤,可能在某些市场状态下表现欠佳。解决方法:测试不同的市场条件过滤器,如交易时段限制、波动率过滤等。
基于代码的深入分析,该策略可以从以下几个方向进行优化:
-
添加趋势过滤器: 整合移动平均线、ADX或其他趋势指标,仅在趋势方向与信号一致时入场。这样可以显著提高策略的胜率,因为吞没形态在趋势方向上的有效性通常更高。
-
动态止损优化: 引入ATR指标来动态调整止损距离,而不是使用固定的点差乘数。市场波动性变化时,这种方法能更好地适应市场条件,减少因过紧止损导致的不必要出局。
-
增加交易时间过滤: 添加交易时间窗口限制,避开低流动性时段和重大新闻发布时间。这可以减少意外跳空和极端波动带来的风险,提高交易质量。
-
整合成交量确认: 将成交量作为额外的确认指标,只在成交量显著增加时确认入场信号。这有助于识别真正的市场突破,而非随机波动。
-
开发金字塔式加仓功能: 在趋势方向上持续走强时,允许策略在有利位置增加头寸,以最大化成功趋势的收益。同时,可以移动止损到盈亏平衡点以保护已获利润。
-
增加市场情绪指标: 整合RSI、MACD等市场情绪指标,作为额外的入场确认条件,只在这些指标与价格动作同步时入场。这将提供更多的信号确认层次。
-
开发自适应参数系统: 创建参数自适应机制,根据近期市场表现自动调整关键参数(如确认数量、止损距离等)。这可以帮助策略随着市场状态变化而自我优化。
15分钟图表吞没突破多重确认策略是一种结合了吞没形态识别与多重价格确认的高效交易系统。通过要求价格突破至少两个之前相反方向的吞没形态水平,该策略有效过滤了大量低质量信号,显著提高了交易成功率。
策略的核心优势在于其多层次的确认机制和动态交易区域设定,使其能够适应不同市场状态并保持较高的胜率。内置的风险管理系统通过与交易区域关联的止损和止盈设置,为每笔交易提供了明确的风险控制框架。
然而,该策略仍存在一些优化空间,特别是在趋势过滤、动态止损调整和市场状态识别方面。通过整合趋势指标、波动性测量和市场情绪指标,可以进一步提高策略的稳健性和长期表现。
对于希望在中等时间周期(15分钟图表)上交易的投资者,该策略提供了一种基于明确规则、易于理解且具有统计优势的交易方法。通过理解并应用其背后的原理,交易者可以在市场中获得一致性的边际优势。 ||
The 15-Minute Engulfing Breakout Multi-Confirmation Strategy is a technical analysis trading system based on price action and candlestick patterns, specifically designed for the 15-minute timeframe. The core of this strategy relies on identifying engulfing patterns combined with multiple confirmation conditions to trigger trading signals, reportedly achieving a win ratio of 76%. The strategy detects both bullish and bearish engulfing patterns, then validates whether the price breaks through at least two previous engulfing pattern levels in the opposite direction, thereby filtering out low-quality signals and improving trade success rates. The strategy also incorporates built-in stop-loss and take-profit mechanisms to effectively control risk and enhance capital management efficiency.
The core principles of this Engulfing Breakout Multi-Confirmation Strategy are based on several key technical elements:
-
Engulfing Pattern Recognition:
- Bullish Engulfing: Current candle is bullish, previous candle is bearish, with the current candle's opening price below the previous candle's closing price, and the closing price above the previous candle's opening price
- Bearish Engulfing: Current candle is bearish, previous candle is bullish, with the current candle's opening price above the previous candle's closing price, and the closing price below the previous candle's opening price
-
Multi-Confirmation System:
- The strategy stores price levels of the 10 most recent engulfing patterns (bullish engulfing highs and bearish engulfing lows) in arrays
- Trading signals must be confirmed by breaking through at least two previous engulfing pattern price levels in the opposite direction
-
Trading Zone Setup:
- Bullish Signal: When a bullish engulfing pattern is detected and breaks through at least two previous bearish engulfing lows, a buy zone is established
- Bearish Signal: When a bearish engulfing pattern is detected and breaks through at least two previous bullish engulfing highs, a sell zone is established
-
Entry Conditions:
- Long Entry: Price low touches the buy zone high and the closing price is higher than the buy zone low
- Short Entry: Price high touches the sell zone low and the closing price is lower than the sell zone high
-
Risk Management:
- Uses dynamic stop-loss levels based on the engulfing zone, plus additional pip protection (30 times pip size)
- Similarly sets dynamic take-profit levels based on the engulfing zone, ensuring a reasonable risk-reward ratio
Through this multi-layered confirmation mechanism, the strategy can effectively filter market noise and capture high-probability trading opportunities.
After analyzing the code structure and logic, this strategy demonstrates the following significant advantages:
-
Multi-Confirmation Filtering Mechanism: By requiring breakouts through at least two previous engulfing patterns in the opposite direction, it significantly improves signal quality and reduces the risk of losses from false breakouts.
-
Dynamic Trading Zones: Unlike strategies using fixed price levels, this strategy dynamically adjusts trading zones based on real-time price patterns, better adapting to market changes.
-
High Win-Rate Performance: The 76% win rate mentioned in the code comments indicates that the strategy performs consistently on 15-minute charts, far exceeding the average performance of most trading systems.
-
Intelligent Risk Management: By setting stop-loss and take-profit positions related to the trading zone, each trade has a clear exit plan, avoiding the risks of emotional trading.
-
Clear Visualization: By marking engulfing patterns on the chart (triangle markers), traders can intuitively understand the strategy's operating principles and signal generation process.
-
Flexible Capital Management: The strategy uses a default percentage of account equity (10%) for position sizing, which helps maintain consistent risk exposure and supports long-term account growth.
-
Market Direction Adaptability: Since the strategy monitors both bullish and bearish engulfing patterns, it can perform well in both uptrends and downtrends adaptively.
Despite its many advantages, through code analysis, we've identified several potential risk points:
-
Rapid Volatility Market Risk: In highly volatile markets, prices may quickly break through the engulfing zone and then reverse, triggering stop-losses. Solution: Consider adjusting stop-loss distances or pausing trading when volatility indicators (such as ATR) are high.
-
Missing Major Trends: Since the strategy resets the corresponding trading zone after each signal trigger (setting it to na), it may miss consecutive opportunities in major trends. Solution: Add a trend filter to maintain directional preference in strong trends.
-
Fixed Capital Management: The strategy sets a fixed equity percentage (10%) for each trade without adjusting position size based on different risk characteristics of trades. Solution: Consider dynamically adjusting position size based on stop-loss distance or market volatility.
-
Pip Setting Optimization: The strategy uses a fixed pip value (30 × pip size) to adjust stop-loss and take-profit positions, which may need adjustment for different trading instruments. Solution: Parameterize the pip size and optimize based on the characteristics of different trading instruments.
-
Drawdown Risk: Consecutive failed trades may lead to significant account drawdowns, especially when market structure changes. Solution: Consider adding overall market health filters or automatically reducing trading size after consecutive losses.
-
Over-Optimization Risk: The code lacks obvious time filters or other market state filters, which may lead to suboptimal performance in certain market states. Solution: Test different market condition filters such as trading session restrictions and volatility filters.
Based on in-depth analysis of the code, this strategy can be optimized in the following directions:
-
Add Trend Filters: Integrate moving averages, ADX, or other trend indicators to only enter positions when the trend direction aligns with the signal. This can significantly improve the strategy's win rate, as engulfing patterns typically have higher efficacy in the direction of the trend.
-
Dynamic Stop-Loss Optimization: Introduce the ATR indicator to dynamically adjust stop-loss distances rather than using fixed pip multipliers. This method better adapts to market conditions when volatility changes, reducing unnecessary exits due to tight stops.
-
Add Trading Time Filters: Implement trading time window restrictions to avoid low liquidity sessions and major news release times. This can reduce the risks of unexpected gaps and extreme volatility, improving trade quality.
-
Integrate Volume Confirmation: Use volume as an additional confirmation indicator, only confirming entry signals when volume significantly increases. This helps identify genuine market breakouts rather than random fluctuations.
-
Develop Pyramid Position Building Functionality: Allow the strategy to add positions at favorable locations when the trend continues to strengthen, maximizing returns from successful trends. Simultaneously, move stops to breakeven to protect accrued profits.
-
Add Market Sentiment Indicators: Integrate RSI, MACD, or other market sentiment indicators as additional entry confirmation conditions, only entering when these indicators synchronize with price action. This provides additional layers of signal confirmation.
-
Develop Adaptive Parameter System: Create a parameter adaptation mechanism that automatically adjusts key parameters (such as confirmation count, stop-loss distance, etc.) based on recent market performance. This helps the strategy self-optimize as market conditions change.
The 15-Minute Engulfing Breakout Multi-Confirmation Strategy is an efficient trading system that combines engulfing pattern recognition with multiple price confirmations. By requiring price to break through at least two previous engulfing pattern levels in the opposite direction, the strategy effectively filters out many low-quality signals, significantly improving trade success rates.
The core advantage of the strategy lies in its multi-layered confirmation mechanism and dynamic trading zone settings, allowing it to adapt to different market states while maintaining a high win rate. The built-in risk management system provides a clear risk control framework for each trade through stop-loss and take-profit settings associated with the trading zone.
However, there remains room for optimization, particularly in trend filtering, dynamic stop-loss adjustment, and market state identification. By integrating trend indicators, volatility measurements, and market sentiment indicators, the strategy's robustness and long-term performance can be further enhanced.
For investors looking to trade on medium timeframes (15-minute charts), this strategy provides a rule-based, easy-to-understand trading method with statistical advantages. By understanding and applying the principles behind it, traders can gain a consistent edge in the market. [/trans]
Source (PineScript)
/*backtest
start: 2024-04-16 00:00:00
end: 2024-05-09 00:00:00
period: 15m
basePeriod: 15m
exchanges: [{"eid":"Futures_Binance","currency":"BTC_USDT"}]
*/

//@version=6
strategy("15Min Engulfing Break Strategy", overlay=true, default_qty_type=strategy.percent_of_equity, default_qty_value=10)

// === INPUTS ===
pipSize = input.float(0.0001, "Pip Size", step=0.0001)
pipOffset = 30 * pipSize

// === FUNCTION: Detect Engulfing Candles ===
isBullishEngulfing() =>
    cond1 = close[1] < open[1]  // previous candle bearish
    cond2 = close > open        // current candle bullish
    cond3 = open < close[1]     // open below previous close
    cond4 = close > open[1]     // close above previous open
    cond1 and cond2 and cond3 and cond4

isBearishEngulfing() =>
    cond1 = close[1] > open[1]  // previous candle bullish
    cond2 = close < open        // current candle bearish
    cond3 = open > close[1]     // open above previous close
    cond4 = close < open[1]     // close below previous open
    cond1 and cond2 and cond3 and cond4

// === VARIABLES TO TRACK ZONES ===
var float buyZoneHigh = na
var float buyZoneLow = na
var float sellZoneHigh = na
var float sellZoneLow = na

// === ARRAYS TO STORE ENGULFING LEVELS ===
var float[] bullHighs = array.new_float()
var float[] bearLows = array.new_float()

// === STORE ENGULFING LEVELS ===
if isBullishEngulfing()
    array.unshift(bullHighs, high)
    if array.size(bullHighs) > 10
        array.pop(bullHighs)

if isBearishEngulfing()
    array.unshift(bearLows, low)
    if array.size(bearLows) > 10
        array.pop(bearLows)

// === CHECK IF BREAKS 2 PRIOR ENGULFINGS ===
breaksTwoBearishEngulfings() =>
    count = 0
    arrSize = array.size(bearLows)
    if arrSize >= 2
        for i = 0 to arrSize - 1
            if high > array.get(bearLows, i)
                count += 1
            if count >= 2
                break
    count >= 2

breaksTwoBullishEngulfings() =>
    count = 0
    arrSize = array.size(bullHighs)
    if arrSize >= 2
        for i = 0 to arrSize - 1
            if low < array.get(bullHighs, i)
                count += 1
            if count >= 2
                break
    count >= 2

// === SET ENGULFING ZONES ===
if isBullishEngulfing() and breaksTwoBearishEngulfings()
    buyZoneHigh := high
    buyZoneLow := low

if isBearishEngulfing() and breaksTwoBullishEngulfings()
    sellZoneHigh := high
    sellZoneLow := low

// === TRADE ENTRIES ===
longCondition = not na(buyZoneHigh) and low <= buyZoneHigh and close > buyZoneLow
shortCondition = not na(sellZoneLow) and high >= sellZoneLow and close < sellZoneHigh

if longCondition
    strategy.entry("Long", strategy.long)
    strategy.exit("TP/SL", from_entry="Long", stop=buyZoneLow - pipOffset, limit=buyZoneHigh + pipOffset)
    buyZoneHigh := na
    buyZoneLow := na

if shortCondition
    strategy.entry("Short", strategy.short)
    strategy.exit("TP/SL", from_entry="Short", stop=sellZoneHigh + pipOffset, limit=sellZoneLow - pipOffset)
    sellZoneHigh := na
    sellZoneLow := na

// === PLOTTING ===
plotshape(isBullishEngulfing(), style=shape.triangleup, location=location.belowbar, color=color.green, size=size.small, title="Bull Engulf")
plotshape(isBearishEngulfing(), style=shape.triangledown, location=location.abovebar, color=color.red, size=size.small, title="Bear Engulf")
Detail
https://www.fmz.com/strategy/490798
Last Modified
2025-04-16 15:33:57