Name
20均线趋势突破量化交易策略-EMA-20-Breakout-Trend-Following-Quantitative-Trading-Strategy
Author
ianzeng123
Strategy Description
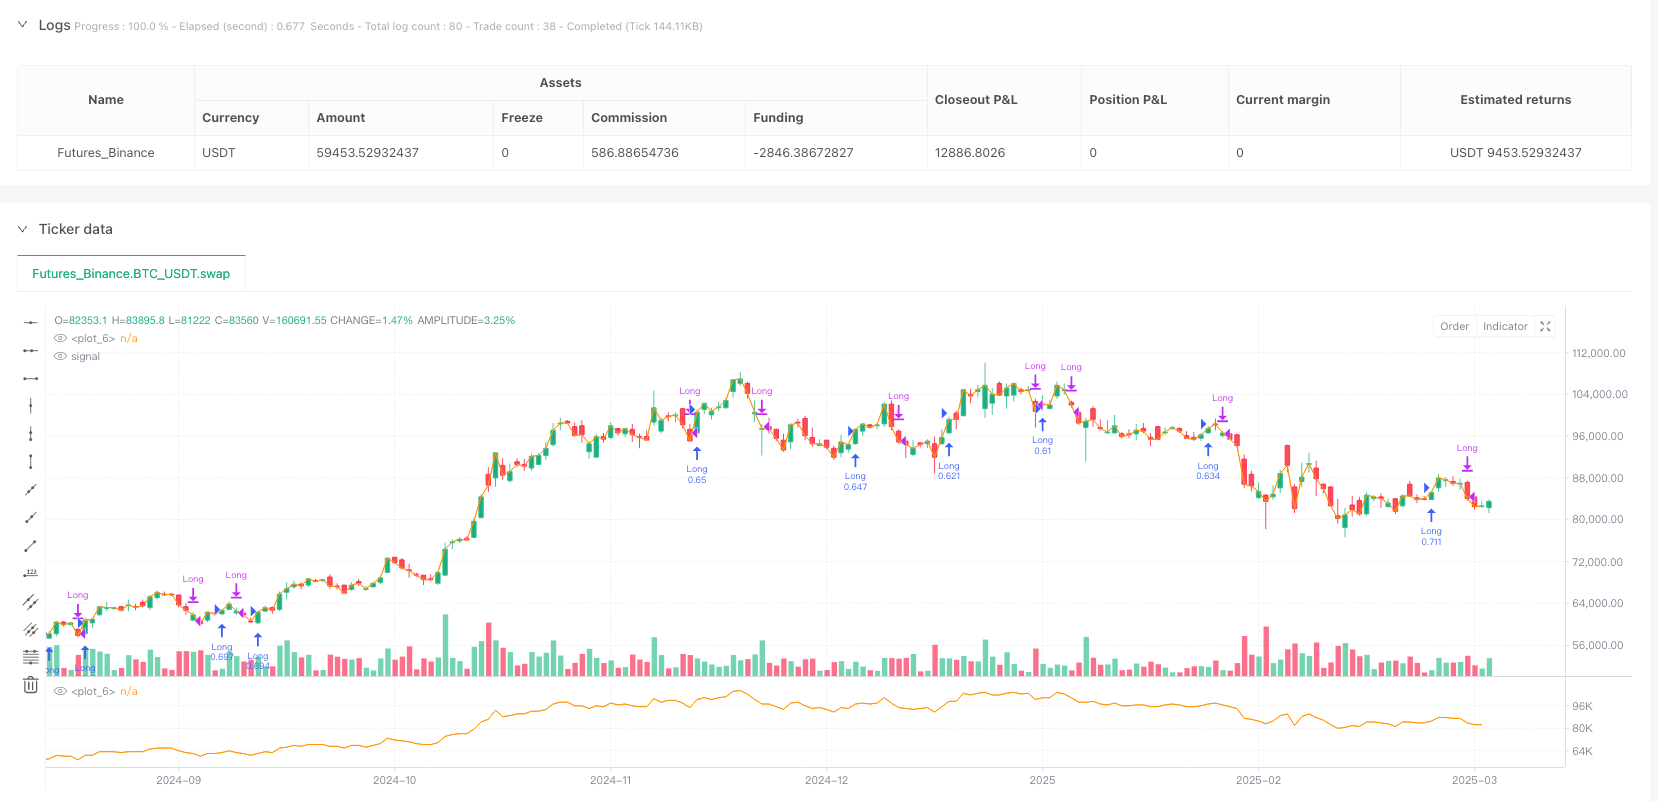
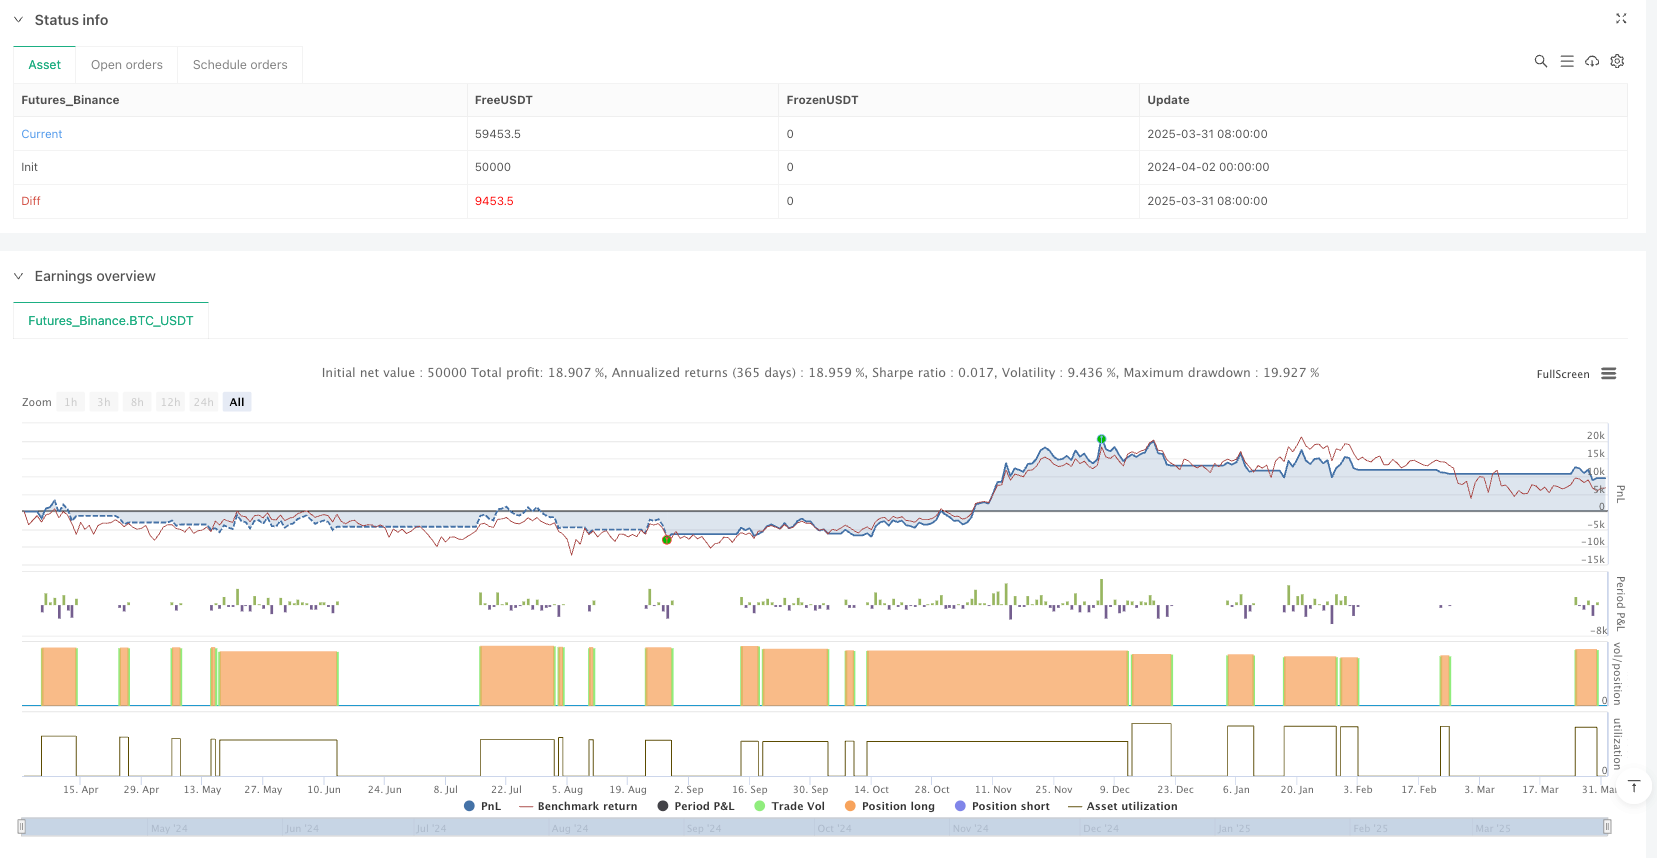
[trans]
该策略是一个基于20日指数移动平均线(EMA)的趋势跟踪交易系统。核心思路是捕捉价格突破20日均线上方的多头趋势机会,并在价格跌破均线时平仓离场,属于经典的技术分析趋势跟踪策略。该策略简单直观,适用于喜欢在日线级别上方运行的趋势性资产,能够有效捕捉中长期上涨趋势。
该策略的核心原理基于技术分析中的均线理论,具体实现逻辑如下:
- 计算20日指数移动平均线(EMA)作为关键技术参考线。
- 入场信号:当价格上穿20日EMA时,系统产生多头入场信号(ta.crossover函数检测上穿)。
- 出场信号:当价格下穿20日EMA时,系统产生平仓信号(ta.crossunder函数检测下穿)。
- 仓位管理:每次交易使用账户100%的资金。
- 策略同时统计交易胜率,在图表上实时显示胜率和总交易次数。
从代码实现上看,该策略使用Pine Script语言编写,通过TradingView的strategy模块进行回测。入场条件(longCondition)和出场条件(exitCondition)明确定义,交易执行简洁直观。策略还包含了胜率计算逻辑,通过对比平仓时的净利润是否为正来判断交易是否盈利,并在图表上动态显示胜率数据。
-
简单易懂: 策略逻辑清晰,没有复杂的指标组合,易于理解和执行,降低了交易者的心理负担。
-
趋势捕捉能力: 20日EMA是中期趋势的有效指标,能够过滤掉短期市场噪音,有效捕捉主要趋势方向。
-
自动化交易: 策略规则明确,可以完全自动化执行,消除人为情绪干扰。
-
适应性强: 该策略适用于多种趋势性资产,尤其是日线级别上有明显趋势特征的品种。
-
绩效跟踪: 内置胜率统计功能,可以实时了解策略表现,有助于交易者客观评估策略效果。
-
风险管理清晰: 有明确的出场条件,当趋势反转时能够及时止损,避免大幅回撤。
-
资金效率: 策略在确认趋势后使用满仓操作,在强势趋势中能够充分利用资金效率。
-
震荡市场表现不佳: 在横盘震荡市场中,价格频繁穿越20日EMA会导致频繁交易和"洗单"现象,产生连续小额亏损。
-
滞后性问题: 作为滞后指标,EMA在趋势转折点会有一定延迟,可能导致入场较晚或出场较晚,错过最佳价位。
-
缺乏风险控制参数: 当前策略没有设置止损和止盈参数,在极端行情下可能面临较大回撤风险。
-
资金管理过于激进: 策略默认使用100%资金进行交易,没有根据波动性调整仓位大小,风险承担较高。
-
过度依赖单一指标: 仅依赖20日EMA做决策,缺乏多指标确认机制,可能产生错误信号。
-
回测偏差风险: 简单的均线策略在回测中可能表现良好,但实盘中可能面临滑点、流动性和佣金等因素影响。
-
缺乏市场环境过滤: 没有根据不同市场环境(如趋势强度、波动率)调整策略参数,适应性有限。
-
增加趋势强度过滤: 可以引入ADX(平均方向指数)等趋势强度指标,只在趋势明确的市场环境中交易,避免震荡市场的频繁交易。
-
多周期确认机制: 结合更高级别(如周线)和更低级别(如4小时线)的趋势方向确认,提高信号质量。
-
动态止损设置: 引入ATR(真实波动幅度)指标设置动态止损,根据市场波动调整风险敞口。
-
优化资金管理: 根据波动率或风险调整仓位大小,例如高波动时减小仓位,低波动时增加仓位。
-
加入量能确认: 结合成交量分析,确保突破信号有足够的成交量支撑,提高信号可靠性。
-
参数优化与自适应: 对EMA周期进行参数优化,甚至考虑使用自适应均线(如KAMA),更好适应不同市场状态。
-
添加利润保护机制: 设计追踪止盈功能,在趋势行情中保护已获利润,提高盈亏比。
-
增加季节性或时间过滤: 针对特定资产可能存在的季节性规律,增加时间过滤条件优化交易时机。
20均线趋势突破量化交易策略是一个简单而经典的趋势跟踪系统,通过捕捉价格与20日EMA的交叉信号进行交易。该策略最大的优势在于逻辑清晰、易于执行和监控,特别适合趋势明确的市场环境。然而,作为单一指标策略,它也面临震荡市场表现不佳、信号滞后等典型风险。
通过添加趋势强度过滤、多周期确认、动态止损和优化资金管理等方向改进,该策略可以获得显著提升。交易者在使用此策略时,应当关注市场环境的适配性,并根据具体交易品种的特性进行针对性调整。
总体而言,这是一个适合初学者入门量化交易的基础策略,也可以作为更复杂交易系统的基础组件。通过不断优化和完善,它有潜力成为一个稳健的交易系统,为投资组合贡献持续的alpha收益。 ||
This strategy is a trend following trading system based on the 20-day Exponential Moving Average (EMA). The core concept is to capture bullish trend opportunities when price breaks above the 20-day EMA and exit positions when price falls below the moving average. It represents a classic technical analysis trend following approach. The strategy is simple and intuitive, suitable for trend-oriented assets that tend to run above the 20 EMA on the daily timeframe, effectively capturing medium to long-term uptrends.
The core principle of this strategy is based on moving average theory in technical analysis, with the following implementation logic:
- Calculate the 20-day Exponential Moving Average (EMA) as the key technical reference line.
- Entry signal: When price crosses above the 20-day EMA, the system generates a long entry signal (detected by the ta.crossover function).
- Exit signal: When price crosses below the 20-day EMA, the system generates a position closing signal (detected by the ta.crossunder function).
- Position management: Each trade uses 100% of the account equity.
- The strategy also tracks win rate statistics, displaying the win rate and total number of trades on the chart in real-time.
From the implementation perspective, the strategy is written in Pine Script language and backtested through TradingView's strategy module. Entry conditions (longCondition) and exit conditions (exitCondition) are clearly defined, with straightforward trade execution. The strategy also includes win rate calculation logic, determining whether a trade is profitable by comparing whether the net profit at position close is positive, and dynamically displaying win rate data on the chart.
-
Simplicity: The strategy logic is clear without complex indicator combinations, making it easy to understand and execute, reducing the psychological burden on traders.
-
Trend Capturing Ability: The 20-day EMA is an effective indicator for medium-term trends, filtering out short-term market noise and effectively capturing the main trend direction.
-
Automated Trading: The strategy rules are explicit and can be fully automated, eliminating emotional interference.
-
High Adaptability: This strategy is applicable to various trending assets, especially those with significant trend characteristics on the daily timeframe.
-
Performance Tracking: Built-in win rate statistics function allows real-time understanding of strategy performance, helping traders objectively evaluate strategy effectiveness.
-
Clear Risk Management: With explicit exit conditions, the strategy can promptly cut losses when trends reverse, avoiding significant drawdowns.
-
Capital Efficiency: The strategy uses full position sizing after confirming a trend, fully leveraging capital efficiency in strong trending markets.
-
Poor Performance in Ranging Markets: In sideways, choppy markets, prices frequently crossing the 20-day EMA will lead to frequent trades and whipsaws, resulting in consecutive small losses.
-
Lag Issues: As a lagging indicator, EMA has a certain delay at trend turning points, potentially leading to late entries or exits, missing optimal price points.
-
Lack of Risk Control Parameters: The current strategy doesn't set stop-loss and take-profit parameters, potentially facing significant drawdown risk in extreme market conditions.
-
Aggressive Capital Management: The strategy defaults to using 100% of funds for trading without adjusting position size based on volatility, bearing higher risk.
-
Over-reliance on a Single Indicator: Relying solely on the 20-day EMA for decision-making lacks multi-indicator confirmation mechanisms, potentially generating false signals.
-
Backtest Bias Risk: Simple moving average strategies may perform well in backtests but could face impacts from slippage, liquidity, and commission factors in live trading.
-
Lack of Market Environment Filtering: No strategy parameter adjustments based on different market environments (such as trend strength, volatility), limiting adaptability.
-
Add Trend Strength Filtering: Introduce trend strength indicators such as ADX (Average Directional Index), trading only in clearly trending market environments to avoid frequent trading in choppy markets.
-
Multi-timeframe Confirmation Mechanism: Combine trend direction confirmation from higher timeframes (e.g., weekly) and lower timeframes (e.g., 4-hour) to improve signal quality.
-
Dynamic Stop-Loss Settings: Introduce ATR (Average True Range) indicator for dynamic stop-loss, adjusting risk exposure based on market volatility.
-
Optimize Capital Management: Adjust position size based on volatility or risk, for example, reducing positions during high volatility and increasing positions during low volatility.
-
Add Volume Confirmation: Incorporate volume analysis to ensure breakout signals have sufficient volume support, enhancing signal reliability.
-
Parameter Optimization and Adaptation: Optimize the EMA period parameter, even considering using adaptive moving averages (such as KAMA) to better adapt to different market conditions.
-
Add Profit Protection Mechanism: Design trailing stop-loss functionality to protect profits in trending markets, improving the risk-reward ratio.
-
Add Seasonality or Time Filters: Add time filtering conditions to optimize trading timing based on potential seasonal patterns for specific assets.
The EMA 20 Breakout Trend Following Quantitative Trading Strategy is a simple yet classic trend following system that trades based on price crossovers with the 20-day EMA. The strategy's greatest advantage lies in its clear logic, ease of execution, and monitoring, particularly suitable for markets with defined trends. However, as a single-indicator strategy, it also faces typical risks such as poor performance in ranging markets and signal lag.
Through improvements in trend strength filtering, multi-timeframe confirmation, dynamic stop-losses, and optimized capital management, this strategy can be significantly enhanced. Traders using this strategy should focus on market environment compatibility and make targeted adjustments based on the characteristics of specific trading instruments.
Overall, this is a fundamental strategy suitable for beginners entering quantitative trading and can also serve as a basic component for more complex trading systems. Through continuous optimization and refinement, it has the potential to become a robust trading system contributing sustainable alpha returns to investment portfolios.[/trans]
Source (PineScript)
/*backtest
start: 2024-04-02 00:00:00
end: 2025-04-01 00:00:00
period: 1d
basePeriod: 1d
exchanges: [{"eid":"Futures_Binance","currency":"BTC_USDT"}]
*/

// This Pine Script® code is subject to the terms of the Mozilla Public License 2.0 at https://mozilla.org/MPL/2.0/
// © SirTraderUSA

//@version=6

plot(close)//@version=5
strategy("EMA 20 Bullish Strategy", overlay=true, default_qty_type=strategy.percent_of_equity, default_qty_value=100)

// Define 20-day EMA
emaLength = 20
ema20 = ta.ema(close, emaLength)

// Entry Condition: Price crosses above EMA 20
longCondition = ta.crossover(close, ema20)

// Exit Condition: Price crosses below EMA 20
exitCondition = ta.crossunder(close, ema20)

// Execute Trades
if longCondition
    strategy.entry("Long", strategy.long)

if exitCondition
    strategy.close("Long")

// Win/Loss Calculation
var float wins = 0
var float losses = 0
var float totalTrades = 0

if strategy.position_size == 0 and strategy.opentrades > totalTrades
    totalTrades := strategy.opentrades
    if strategy.netprofit > 0
        wins := wins + 1
    else
        losses := losses + 1

// Winning Percentage
winRate = totalTrades > 0 ? (wins / totalTrades) * 100 : na

// Display Win Rate on Chart
label = "Win Rate: " + str.tostring(winRate, "#.##") + "%"
labelText = label + "\nTotal Trades: " + str.tostring(totalTrades, "#")
label_pos = close * 1.02
Detail
https://www.fmz.com/strategy/489157
Last Modified
2025-04-02 11:31:05