Name
200均线VWAPMFI趋势跟踪策略-200-EMA-VWAP-MFI-Trend-Following-Strategy
Author
ChaoZhang
Strategy Description
[trans]
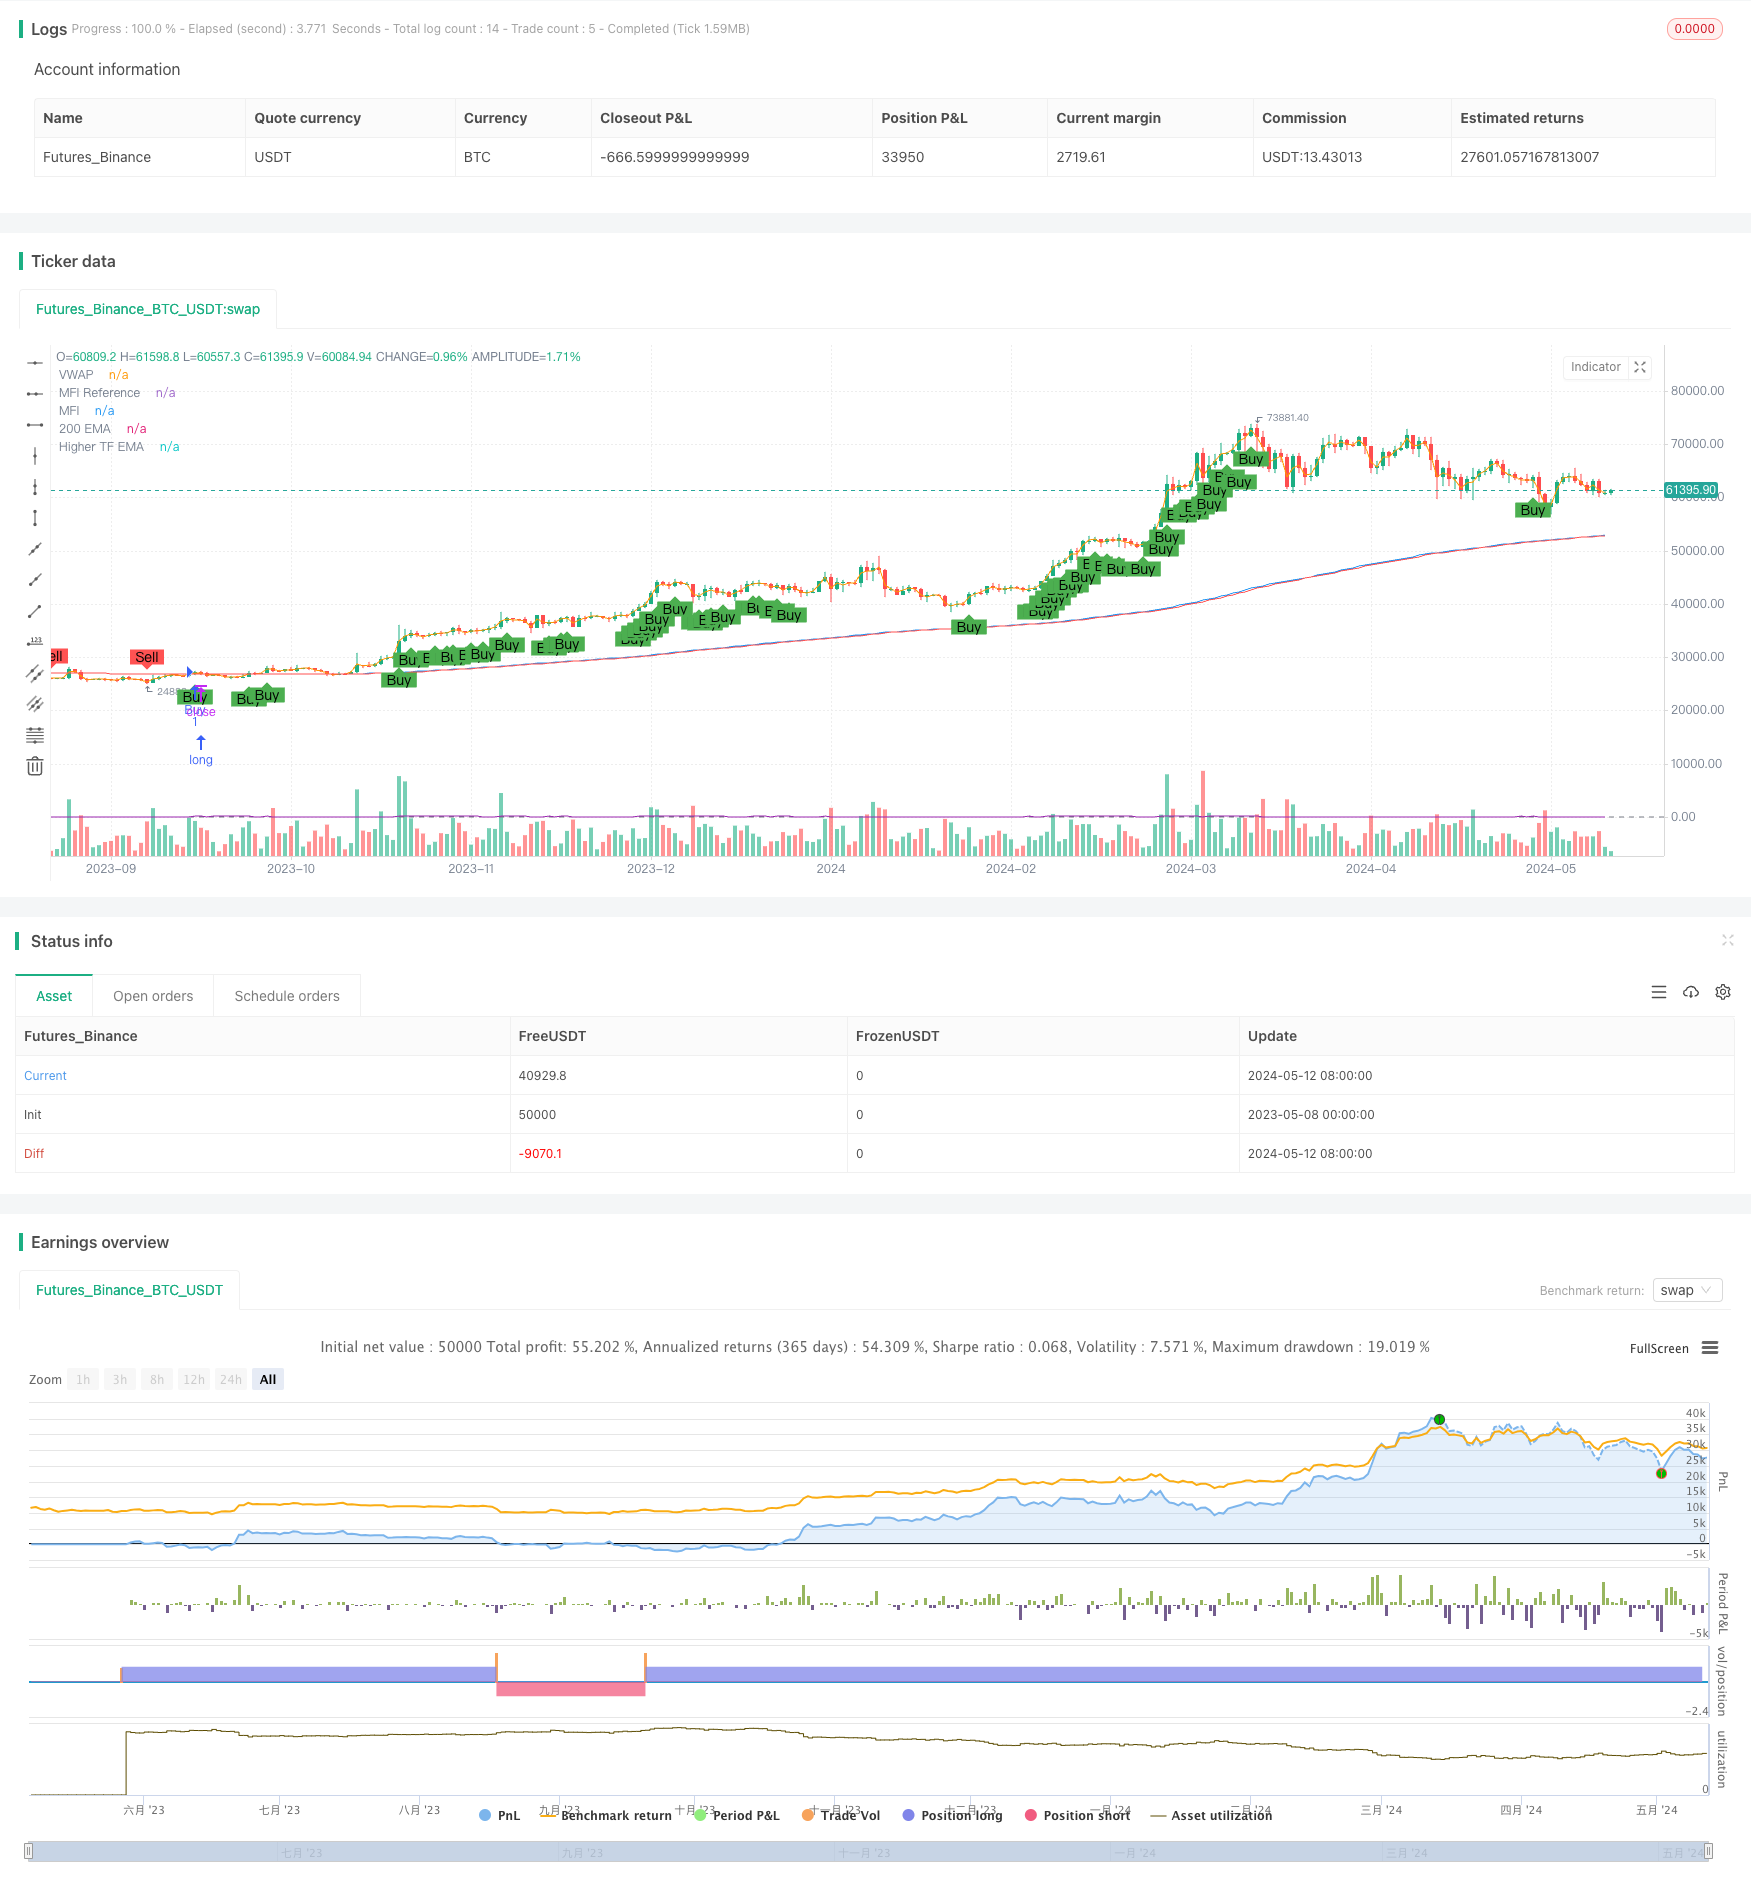
该策略结合了200日指数移动平均线(200 EMA)、成交量加权平均价格(VWAP)和资金流指标(MFI)来生成买卖信号。主要思路是利用这三个指标的组合来判断趋势方向和强度,在价格突破200 EMA且VWAP和MFI指标确认的情况下产生交易信号。同时,引入高级时间周期的200 EMA作为趋势过滤,只有当前时间周期和高级时间周期的趋势一致时才进行交易。此外,还通过对价格走势的连续性进行判断来提高信号的可靠性。
- 计算200日EMA,并根据输入的缓冲区百分比计算出缓冲区上下轨。
- 计算VWAP指标。
- 计算14周期的MFI指标,并设定买入和卖出的阈值。
- 获取高级时间周期的200 EMA作为趋势过滤。
- 判断价格走势的连续性,检查是否满足连续上涨或下跌的条件。
- 综合以上条件,产生买入信号的条件为:收盘价突破200 EMA上轨且高于VWAP,MFI大于买入阈值,收盘价高于高级时间周期的200 EMA,且价格走势连续上涨。
- 卖出信号的条件为:收盘价跌破200 EMA下轨且低于VWAP,MFI小于卖出阈值,收盘价低于高级时间周期的200 EMA,且价格走势连续下跌。
- 当满足买入或卖出条件时,策略进行相应的多头或空头交易。
- 结合多个指标进行综合判断,有效过滤虚假信号,提高信号可靠性。
- 引入高级时间周期的趋势过滤,使交易决策与大趋势保持一致,降低逆势交易风险。
- 通过价格走势连续性的判断,进一步确认趋势强度,提高入场时机的准确性。
- 使用缓冲区概念,允许价格在一定范围内波动,避免频繁交易。
- 参数可调,灵活性高,可根据不同市场和交易风格进行优化。
- 在震荡市或趋势转折点,指标可能会产生虚假信号,导致亏损。
- 参数设置不当可能导致策略表现不佳,如缓冲区过大可能错失交易机会,过小可能导致频繁交易。
- 策略依赖于历史数据进行计算和判断,对于突发事件或黑天鹅事件可能反应不及时。
- 在某些特殊市场环境下,如趋势极度延续或剧烈波动时,策略可能失效。
- 对于参数的优化,可以通过对历史数据进行回测,寻找最佳的参数组合,如EMA周期、MFI周期和阈值、缓冲区大小等。
- 可以考虑引入其他辅助指标或市场情绪指标,如布林带、RSI等,以进一步提高信号的可靠性和稳健性。
- 在交易管理方面,可以引入止损止盈机制,如移动止损或基于ATR的动态止损,以控制单笔交易风险。
- 可以探索不同的仓位管理策略,如基于风险的仓位sizing或凯利公式等,以优化策略的风险收益比。
- 考虑引入机器学习或自适应算法,动态调整策略参数,以适应市场变化。
该策略通过结合200日EMA、VWAP和MFI指标,同时考虑高级时间周期的趋势和价格走势的连续性,构建了一个相对稳健的趋势跟踪交易系统。策略通过多个条件的综合判断来过滤虚假信号,提高入场时机的准确性。同时,策略参数的灵活性允许根据不同市场和交易风格进行优化。但策略也存在一定的风险,如在震荡市或趋势转折点可能产生亏损,以及参数设置不当可能导致表现不佳等。未来可以从参数优化、引入辅助指标、风险管理等方面对策略进行进一步优化和改进。总的来说,该策略为趋势跟踪交易提供了一个较为全面和可行的框架。
||
This strategy combines the 200-day Exponential Moving Average (200 EMA), Volume Weighted Average Price (VWAP), and Money Flow Index (MFI) to generate buy and sell signals. The main idea is to use the combination of these three indicators to determine the trend direction and strength, and generate trading signals when the price breaks through the 200 EMA and is confirmed by the VWAP and MFI indicators. Additionally, a 200 EMA from a higher timeframe is introduced as a trend filter, and trades are only executed when the trends on the current and higher timeframes align. Furthermore, the continuity of price movements is assessed to improve the reliability of signals.
- Calculate the 200-day EMA and the upper and lower buffer zones based on the input buffer percentage.
- Calculate the VWAP indicator.
- Calculate the 14-period MFI indicator and set the buy and sell thresholds.
- Obtain the 200 EMA from a higher timeframe as a trend filter.
- Determine the continuity of price movements by checking if the conditions for continuous uptrend or downtrend are met.
- Combine the above conditions to generate buy signals when the closing price breaks above the 200 EMA upper buffer and is above the VWAP, the MFI is greater than the buy threshold, the closing price is above the 200 EMA of the higher timeframe, and the price movement is continuously rising.
- Sell signals are generated when the closing price breaks below the 200 EMA lower buffer and is below the VWAP, the MFI is less than the sell threshold, the closing price is below the 200 EMA of the higher timeframe, and the price movement is continuously falling.
- When buy or sell conditions are met, the strategy executes corresponding long or short trades.
- Combines multiple indicators for comprehensive analysis, effectively filters false signals, and improves signal reliability.
- Introduces trend filtering from a higher timeframe, aligning trading decisions with the larger trend and reducing the risk of counter-trend trading.
- Further confirms trend strength by assessing the continuity of price movements, improving the accuracy of entry timing.
- Uses the concept of buffer zones, allowing prices to fluctuate within a certain range and avoiding frequent trading.
- Adjustable parameters provide high flexibility, allowing optimization based on different markets and trading styles.
- In choppy markets or at trend turning points, indicators may generate false signals, leading to losses.
- Improper parameter settings may result in poor strategy performance. For example, an overly large buffer zone may miss trading opportunities, while an overly small one may lead to frequent trading.
- The strategy relies on historical data for calculations and judgments, and may not react promptly to sudden events or black swan events.
- In certain special market conditions, such as extremely prolonged trends or violent fluctuations, the strategy may fail.
- For parameter optimization, backtesting on historical data can be conducted to find the best combination of parameters, such as EMA period, MFI period and thresholds, and buffer zone size.
- Consider introducing other auxiliary indicators or market sentiment indicators, such as Bollinger Bands or RSI, to further improve signal reliability and robustness.
- In terms of trade management, introduce stop-loss and take-profit mechanisms, such as trailing stops or dynamic stops based on ATR, to control single-trade risk.
- Explore different position sizing strategies, such as risk-based position sizing or the Kelly Criterion, to optimize the risk-reward ratio of the strategy.
- Consider introducing machine learning or adaptive algorithms to dynamically adjust strategy parameters to adapt to market changes.
By combining the 200-day EMA, VWAP, and MFI indicators, while considering trends in higher timeframes and the continuity of price movements, this strategy constructs a relatively robust trend-following trading system. The strategy filters false signals by comprehensively analyzing multiple conditions, improving the accuracy of entry timing. At the same time, the flexibility of strategy parameters allows for optimization based on different markets and trading styles. However, the strategy also involves certain risks, such as potential losses in choppy markets or at trend turning points, and poor performance due to improper parameter settings. In the future, the strategy can be further optimized and improved in terms of parameter optimization, introducing auxiliary indicators, risk management, and other aspects. Overall, this strategy provides a comprehensive and feasible framework for trend-following trading. [/trans]
Source (PineScript)
/*backtest
start: 2023-05-08 00:00:00
end: 2024-05-13 00:00:00
period: 1d
basePeriod: 1h
exchanges: [{"eid":"Futures_Binance","currency":"BTC_USDT"}]
*/

//@version=5
strategy("200 EMA, VWAP, MFI Strategy - Visible Signals", overlay=true, pyramiding=0)

// Inputs for dynamic adjustments
buffer = input.float(0.2, title="EMA Buffer Percentage", step=0.1) / 100
higherTimeframe = input.timeframe("15", title="Higher Timeframe")
mfiBuyThreshold = input(60, title="MFI Buy Threshold")
mfiSellThreshold = input(40, title="MFI Sell Threshold")
consecutiveCloses = input.int(1, title="Consecutive Closes for Confirmation")

// Calculate the 200-period EMA
ema200 = ta.ema(close, 200)
emaBufferedHigh = ema200 * (1 + buffer)
emaBufferedLow = ema200 * (1 - buffer)
emaHigher = request.security(syminfo.tickerid, higherTimeframe, ta.ema(close, 200))

// VWAP calculation
vwap = ta.vwap(hlc3)

// Money Flow Index calculation
mfiLength = 14
mfi = ta.mfi(close, mfiLength)

// Plotting the indicators
plot(ema200, title="200 EMA", color=color.blue)
plot(vwap, title="VWAP", color=color.orange)
plot(mfi, title="MFI", color=color.purple)
hline(50, "MFI Reference", color=color.gray, linestyle=hline.style_dashed)
plot(emaHigher, title="Higher TF EMA", color=color.red)

// Price action confirmation
isUpTrend = ta.rising(close, consecutiveCloses)
isDownTrend = ta.falling(close, consecutiveCloses)

// Define entry conditions
longCondition = close > emaBufferedHigh and close > vwap and mfi > mfiBuyThreshold and close > emaHigher and isUpTrend
shortCondition = close < emaBufferedLow and close < vwap and mfi < mfiSellThreshold and close < emaHigher and isDownTrend

// Trading execution
if (longCondition)
    strategy.entry("Buy", strategy.long)

if (shortCondition)
    strategy.entry("Sell", strategy.short)

// Plot shapes for signals
plotshape(series=longCondition, location=location.belowbar, color=color.green, style=shape.labelup, size=size.small, title="Buy Signal", text="Buy")
plotshape(series=shortCondition, location=location.abovebar, color=color.red, style=shape.labeldown, size=size.small, title="Sell Signal", text="Sell")
Detail
https://www.fmz.com/strategy/451400
Last Modified
2024-05-14 16:26:49