Name
24小时量价结合斐波那契回调交叉均线交易策略-24-Hour-Volume-Price-Fibonacci-Retracement-MA-Cross-Trading-Strategy
Author
ianzeng123
Strategy Description
[trans]
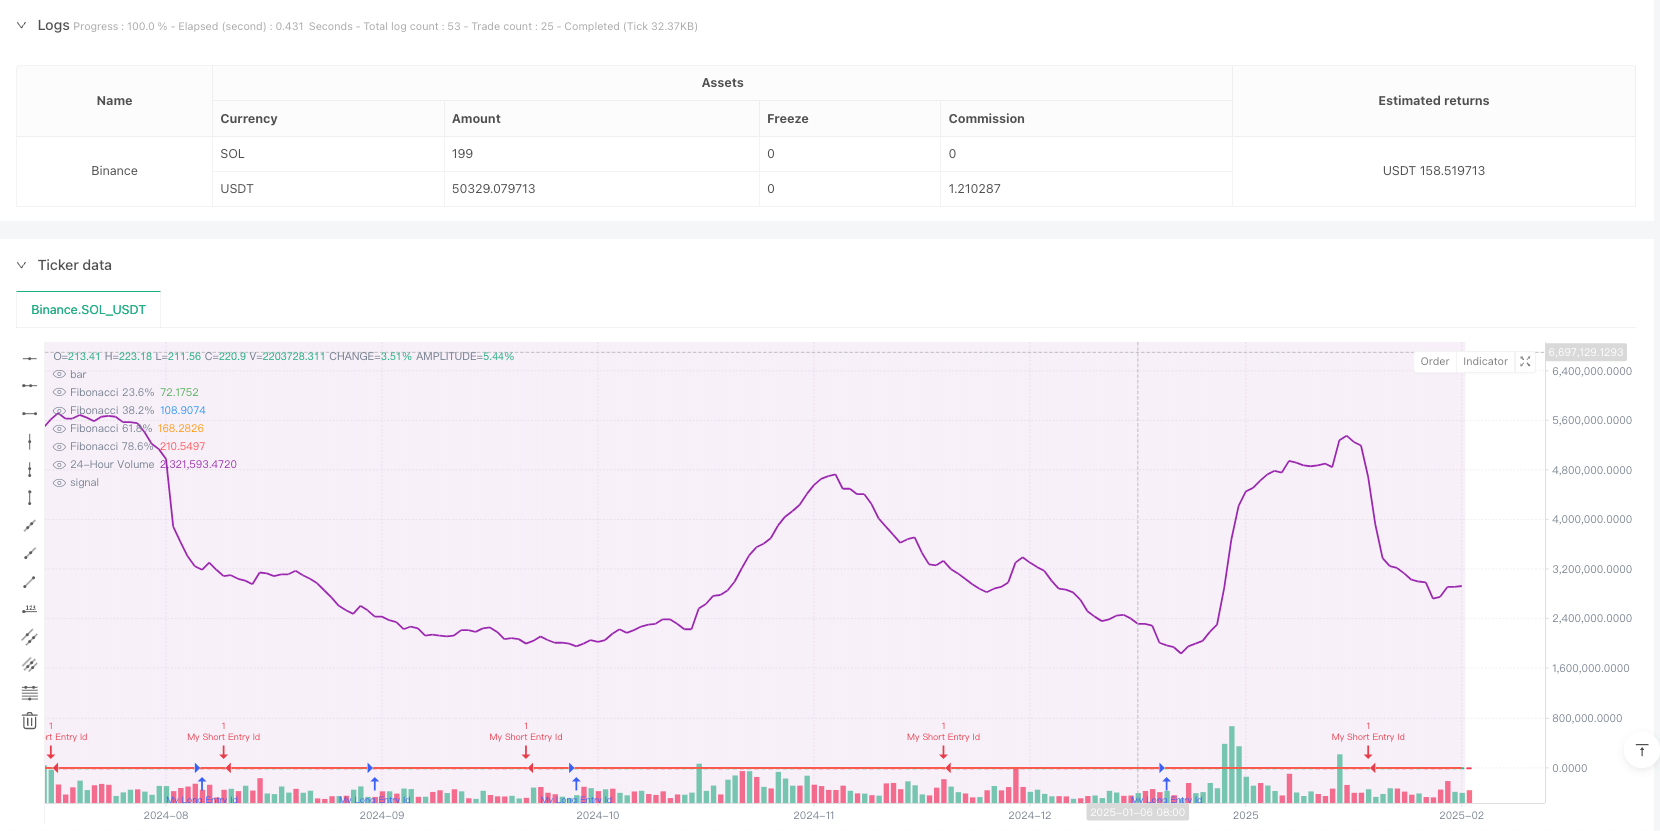
该策略是一个基于24小时周期内的交易量、价格高低点和斐波那契回调水平的量化交易系统。策略通过结合短期和长期移动平均线的交叉信号来确定交易时机,同时利用成交量和斐波那契水平来验证价格走势的有效性。这种多维度指标的结合既能捕捉市场趋势,又可以在关键支撑阻力位进行交易。
策略的核心逻辑包含以下几个关键要素:
- 24小时价格区间追踪:系统持续监控并更新每个交易日内的最高价和最低价,建立价格波动范围。
- 斐波那契回调计算:基于日内高低点计算23.6%、38.2%、61.8%和78.6%四个关键的斐波那契回调水平。
- 成交量分析:使用20周期简单移动平均线(SMA)来平滑成交量数据,反映市场活跃度。
- 均线交叉信号:通过14周期和28周期的移动平均线交叉来产生交易信号,其中上穿为做多信号,下穿为做空信号。
- 多维度分析:结合价格、成交量和技术指标,提供更全面的市场视角。
- 自适应性强:斐波那契水平基于实时价格区间计算,能够动态适应市场变化。
- 风险控制合理:通过多重指标确认,降低假突破带来的风险。
- 操作逻辑清晰:入场信号明确,易于执行和回测。
- 时间周期优化:采用24小时监控,适合全天候交易的市场。
- 震荡市场风险:在横盘震荡行情下,均线交叉信号可能产生频繁交易。
- 滞后性问题:移动平均线指标具有一定滞后性,可能错过最佳入场时机。
- 假突破风险:在低流动性时段,价格突破可能缺乏真实成交量支撑。
- 计算复杂度:多个指标的实时计算可能增加系统负载。
- 动态参数优化:
- 根据市场波动率自动调整移动平均线周期
- 优化成交量平均线周期,提高对市场活跃度的敏感性
- 信号过滤增强:
- 添加趋势强度确认指标
- 引入波动率过滤器,避免低波动率环境下的交易
- 风险管理完善:
- 实现动态止损机制
- 加入仓位管理算法
该策略通过综合运用24小时价格区间、斐波那契回调水平、成交量和均线交叉等技术指标,构建了一个逻辑完整的交易系统。策略的主要优势在于多维度分析和自适应性,但也需要注意应对震荡市场和假突破等风险。通过建议的优化方向,策略的稳定性和盈利能力有望得到进一步提升。 ||
This strategy is a quantitative trading system based on 24-hour trading volume, price highs and lows, and Fibonacci retracement levels. The strategy determines trading opportunities by combining crossover signals from short-term and long-term moving averages while using volume and Fibonacci levels to validate price trend validity. This multi-dimensional indicator combination can both capture market trends and execute trades at key support and resistance levels.
The core logic of the strategy includes the following key elements:
- 24-Hour Price Range Tracking: The system continuously monitors and updates the highest and lowest prices within each trading day to establish the price fluctuation range.
- Fibonacci Retracement Calculation: Calculates four key Fibonacci retracement levels (23.6%, 38.2%, 61.8%, and 78.6%) based on intraday highs and lows.
- Volume Analysis: Uses a 20-period Simple Moving Average (SMA) to smooth volume data and reflect market activity.
- Moving Average Crossover Signals: Generates trading signals through crossovers of 14-period and 28-period moving averages, where crossing above indicates a long signal and crossing below indicates a short signal.
- Multi-dimensional Analysis: Combines price, volume, and technical indicators for a more comprehensive market perspective.
- Strong Adaptability: Fibonacci levels are calculated based on real-time price ranges, allowing dynamic adaptation to market changes.
- Reasonable Risk Control: Multiple indicator confirmation reduces risks from false breakouts.
- Clear Operational Logic: Entry signals are explicit, making execution and backtesting straightforward.
- Optimized Time Period: 24-hour monitoring suits markets that trade around the clock.
- Choppy Market Risk: Moving average crossover signals may generate frequent trades in sideways markets.
- Lag Issues: Moving average indicators have inherent lag, potentially missing optimal entry points.
- False Breakout Risk: Price breakouts during low liquidity periods may lack genuine volume support.
- Computational Complexity: Real-time calculation of multiple indicators may increase system load.
- Dynamic Parameter Optimization:
- Automatically adjust moving average periods based on market volatility
- Optimize volume moving average period to improve sensitivity to market activity
- Signal Filter Enhancement:
- Add trend strength confirmation indicators
- Introduce volatility filters to avoid trading in low volatility environments
- Risk Management Improvement:
- Implement dynamic stop-loss mechanisms
- Add position sizing algorithms
The strategy constructs a logically complete trading system by comprehensively utilizing 24-hour price ranges, Fibonacci retracement levels, volume, and moving average crossovers. The strategy's main advantages lie in its multi-dimensional analysis and adaptability, but attention must be paid to risks such as choppy markets and false breakouts. Through the suggested optimization directions, the strategy's stability and profitability potential can be further enhanced.[/trans]
Source (PineScript)
/*backtest
start: 2024-02-25 00:00:00
end: 2025-02-22 08:00:00
period: 1d
basePeriod: 1d
exchanges: [{"eid":"Binance","currency":"SOL_USDT"}]
*/

//@version=5
strategy("24-Hour Volume and Fibonacci Levels Strategy", overlay=true)

// Define the 24-hour time period
startTime = timestamp(year, month, dayofmonth, 0, 0)
endTime = timestamp(year, month, dayofmonth, 23, 59)

// Calculate 24-hour high and low
var float dayHigh = na
var float dayLow = na

if (time >= startTime and time <= endTime)
    dayHigh := na(dayHigh) ? high : math.max(dayHigh, high)
    dayLow := na(dayLow) ? low : math.min(dayLow, low)

// Fibonacci levels
fibRetrace1 = dayLow + (dayHigh - dayLow) * 0.236
fibRetrace2 = dayLow + (dayHigh - dayLow) * 0.382
fibRetrace3 = dayLow + (dayHigh - dayLow) * 0.618
fibRetrace4 = dayLow + (dayHigh - dayLow) * 0.786

// Plot Fibonacci levels
plot(fibRetrace1, color=color.green, linewidth=2, title="Fibonacci 23.6%")
plot(fibRetrace2, color=color.blue, linewidth=2, title="Fibonacci 38.2%")
plot(fibRetrace3, color=color.orange, linewidth=2, title="Fibonacci 61.8%")
plot(fibRetrace4, color=color.red, linewidth=2, title="Fibonacci 78.6%")

// Volume Indicator
volumeMa = ta.sma(volume, 20)
plot(volumeMa, color=color.purple, title="24-Hour Volume", linewidth=2)

// Optional: Display the 24-hour volume on the chart
bgcolor(time >= startTime and time <= endTime ? color.new(color.purple, 90) : na)

// Strategy conditions (based on moving averages)
longCondition = ta.crossover(ta.sma(close, 14), ta.sma(close, 28))
if (longCondition)
    strategy.entry("My Long Entry Id", strategy.long)

shortCondition = ta.crossunder(ta.sma(close, 14), ta.sma(close, 28))
if (shortCondition)
    strategy.entry("My Short Entry Id", strategy.short)
Detail
https://www.fmz.com/strategy/483515
Last Modified
2025-02-24 09:55:47