Name
4小时时间框架上的吞没形态交易策略与动态止盈止损优化-4-Hour-Timeframe-Engulfing-Pattern-Trading-Strategy-with-Dynamic-Take-Profit-and-Stop-Loss-Optimization
Author
ChaoZhang
Strategy Description
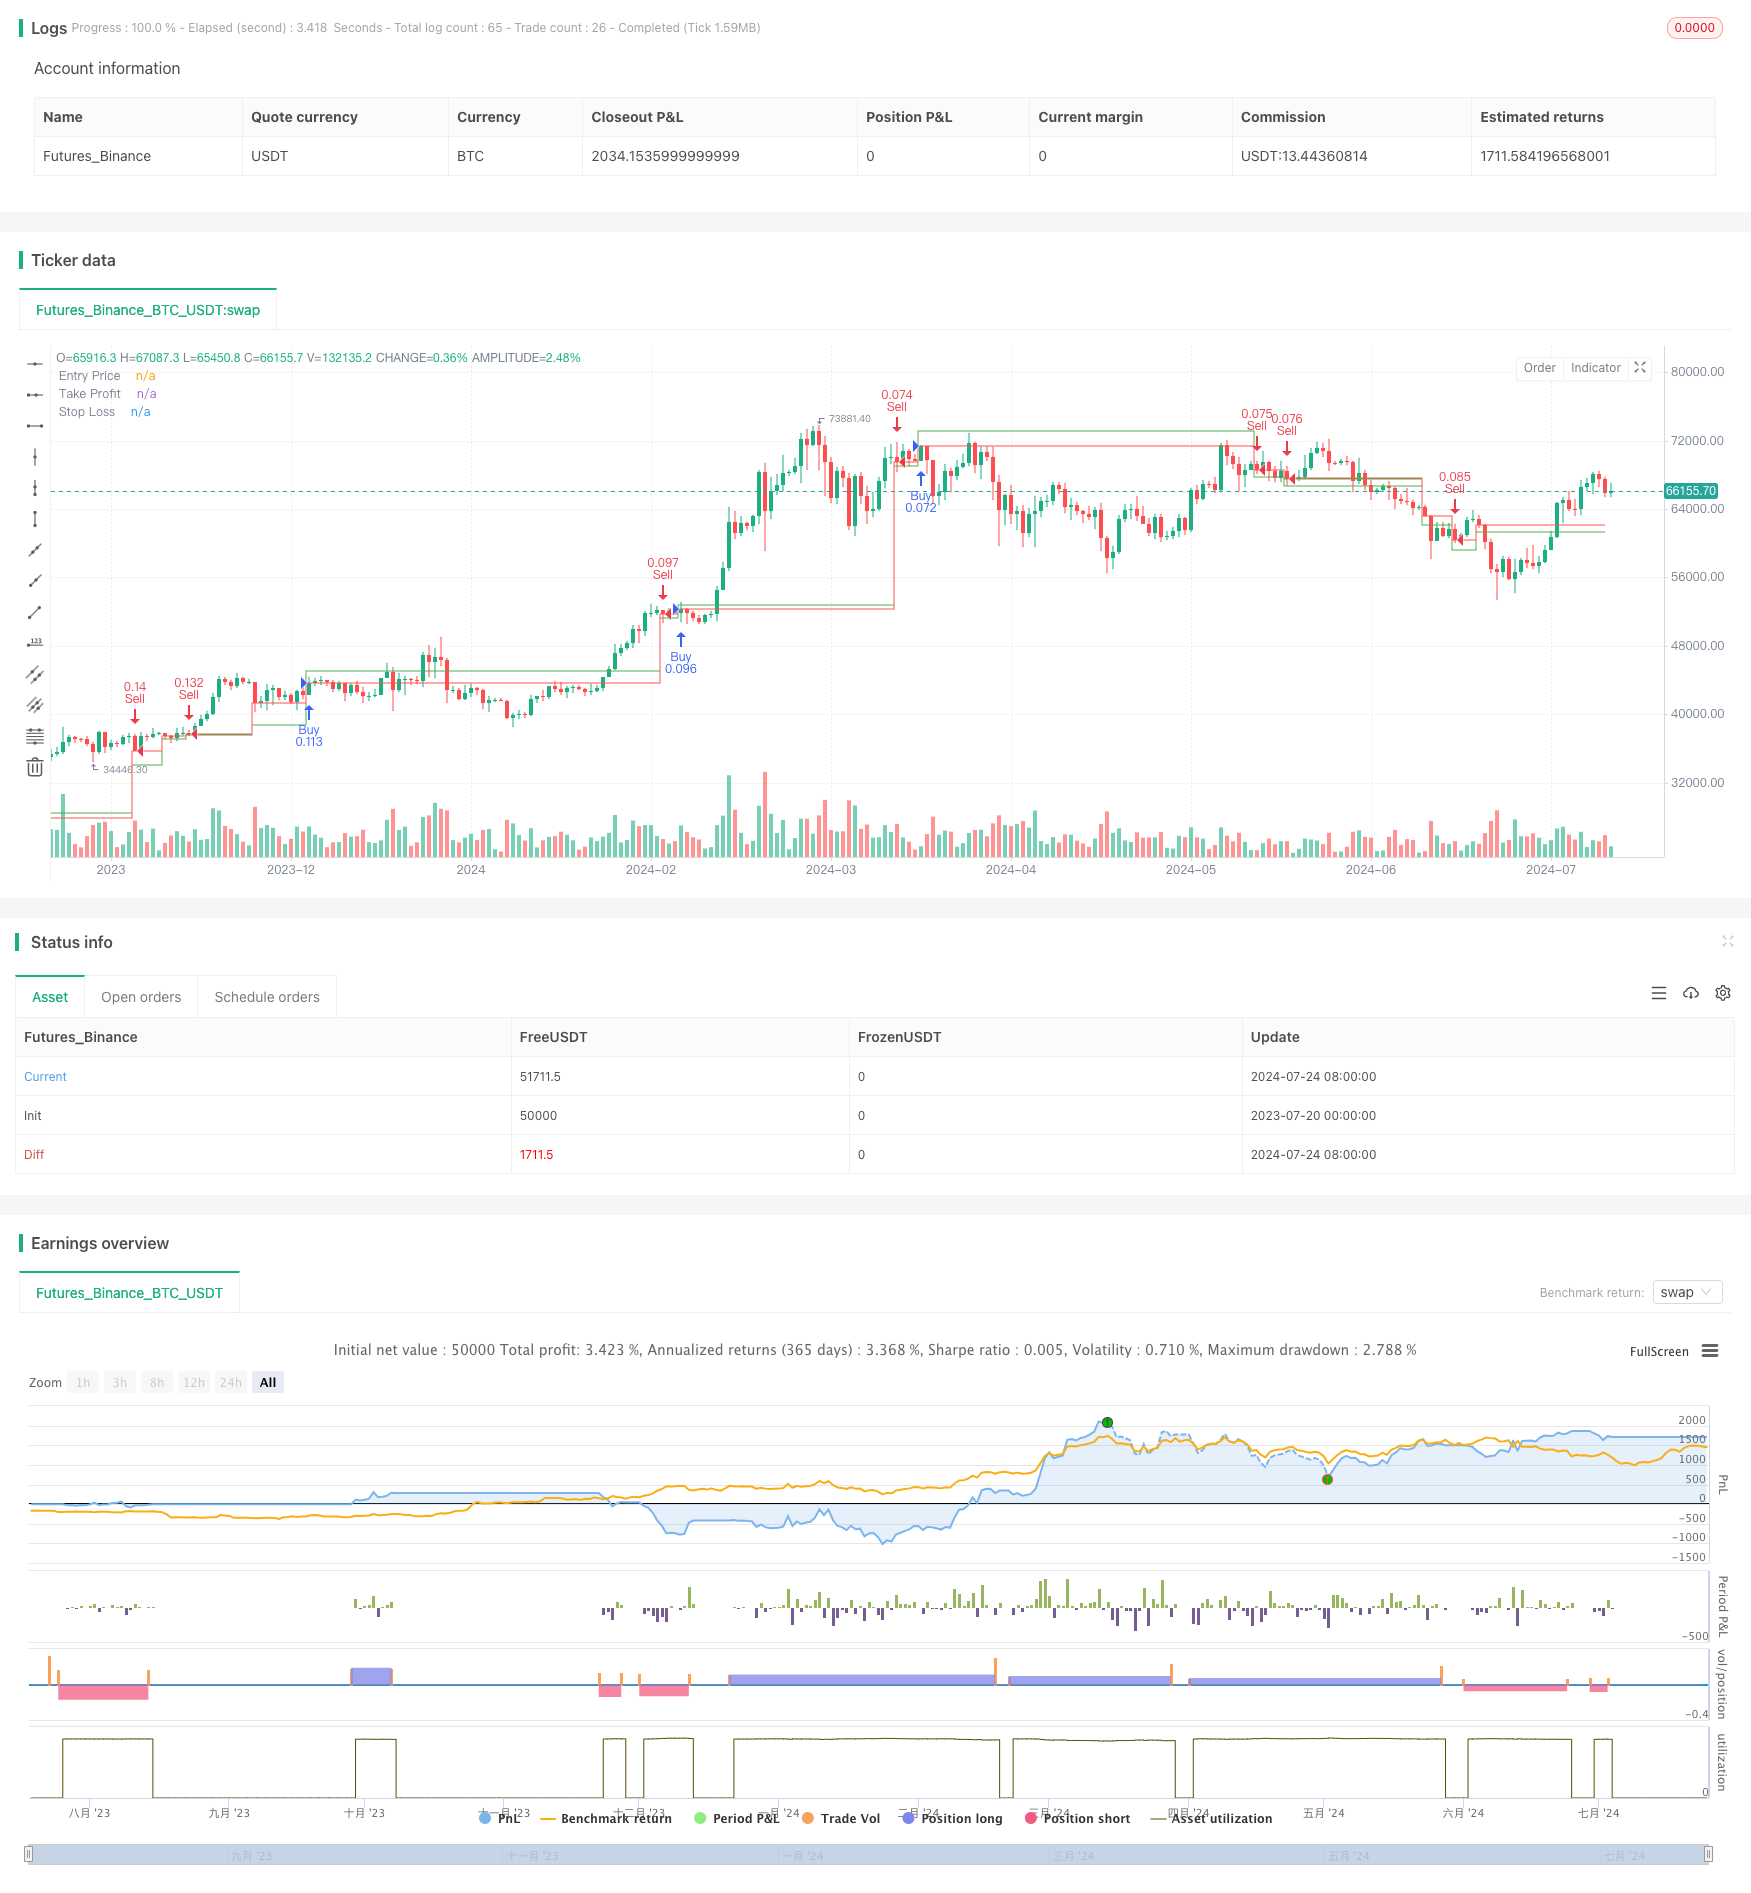
[trans]
本文将介绍一种基于4小时时间框架的吞没形态交易策略,该策略结合了动态止盈和固定点数止损机制。这种策略利用吞没形态这一强大的价格行为信号来识别潜在的趋势反转,并通过设置动态的获利目标和固定的止损点来管理风险和优化收益。该策略适用于各种金融市场,包括股票、外汇和加密货币等。
该策略的核心原理是识别4小时图表上的看涨和看跌吞没形态。吞没形态是一种由两根蜡烛线组成的价格模式,其中第二根蜡烛线的实体完全"吞没"了前一根蜡烛线的实体。这种形态通常被视为潜在的趋势反转信号。
具体来说,策略的运作原理如下:
-
看涨吞没形态:当当前收盘价高于前一根蜡烛线的开盘价,且当前开盘价低于前一根蜡烛线的收盘价时,形成看涨吞没形态。此时,策略会开立多头头寸。
-
看跌吞没形态:当当前收盘价低于前一根蜡烛线的开盘价,且当前开盘价高于前一根蜡烛线的收盘价时,形成看跌吞没形态。此时,策略会开立空头头寸。
-
动态止盈:策略使用吞没蜡烛线的实体大小乘以一个可调整的乘数来设置获利目标。这种方法允许根据市场波动性动态调整获利目标。
-
固定点数止损:策略使用固定数量的点数来设置止损,这有助于限制每笔交易的最大损失。
-
头寸规模:策略默认使用账户权益的10%作为每笔交易的头寸大小,这有助于实现有效的资金管理。
-
可靠的入场信号:吞没形态是一种广受认可的价格行为模式,通常能够提供相对可靠的趋势反转信号。在4小时时间框架上使用这种形态可以过滤掉较小时间框架上的噪音。
-
动态止盈机制:通过使用吞没蜡烛线的实体大小来设置获利目标,策略能够根据当前市场波动性自动调整目标。这种方法有助于在波动性较大时获得更大的利润,同时在波动性较小时保护已有盈利。
-
风险管理:固定点数止损机制为每笔交易提供了明确的风险限制,有助于防止大幅度的亏损。
-
适应性强:策略可以应用于多种金融市场和交易品种,具有广泛的适用性。
-
简单而有效:策略逻辑相对简单,易于理解和实施,同时又能捕捉重要的市场转折点。
-
可定制性:策略提供了多个可调整的参数,如止盈乘数和止损点数,使交易者可以根据自己的风险偏好和交易风格进行优化。
-
假突破风险:吞没形态有时可能产生假信号,特别是在横盘市场或者高波动性环境下。这可能导致不必要的交易和潜在的亏损。
-
过度交易:在某些市场条件下,策略可能生成过多的交易信号,增加交易成本并可能导致过度交易。
-
滑点风险:在快速变动的市场中,实际的入场和出场价格可能与预期存在差异,影响策略的整体表现。
-
固定止损的局限性:虽然固定点数止损提供了明确的风险控制,但可能不适合所有市场条件,特别是在波动性剧烈变化的时期。
-
依赖单一指标:策略主要依赖吞没形态这一单一指标,可能忽视其他重要的市场信息和指标。
-
参数敏感性:策略的表现可能对止盈乘数和止损点数等参数的设置非常敏感,需要仔细优化和回测。
-
引入额外的过滤条件:可以考虑结合其他技术指标,如趋势指标(如移动平均线)或动量指标(如相对强弱指数RSI),以确认吞没形态的有效性,减少假信号。
-
动态止损机制:可以考虑使用ATR(平均真实范围)指标来设置动态止损,使止损更好地适应当前市场波动性。
-
时间过滤:可以添加时间过滤器,避免在市场波动性较低的时段(如亚洲盘)开仓,从而减少假突破的风险。
-
市场状态识别:引入算法来识别当前市场是趋势市还是震荡市,并相应地调整策略参数或暂停交易。
-
头寸管理优化:可以实现更复杂的头寸管理策略,如根据账户余额、当前波动性或胜率动态调整头寸大小。
-
多时间框架分析:结合更长和更短的时间框架来确认趋势和入场点,提高策略的稳健性。
-
机器学习优化:使用机器学习算法来优化策略参数,或者预测吞没形态的成功率。
-
相关性分析:在多个交易品种上同时运行策略时,考虑品种间的相关性,以更好地分散风险。
4小时时间框架上的吞没形态交易策略结合了动态止盈和固定点数止损,为交易者提供了一个简单而有效的市场参与方法。该策略利用吞没形态这一经典的价格行为模式来识别潜在的趋势反转,并通过动态止盈机制来适应市场波动性的变化。固定点数止损则为每笔交易提供了明确的风险控制。
虽然策略具有多项优势,如可靠的入场信号、动态止盈和明确的风险管理,但也存在一些潜在的风险,如假突破和过度依赖单一指标等。为了进一步提高策略的稳健性和性能,可以考虑引入额外的过滤条件、实现动态止损、进行多时间框架分析等优化方向。
总的来说,这个策略为交易者提供了一个良好的起点,可以根据个人交易风格和风险偏好进行进一步的定制和优化。通过仔细的参数调整、充分的回测和实盘验证,该策略有潜力成为一个可靠的交易系统的重要组成部分。然而,交易者应始终牢记市场的不可预测性,并结合其他分析方法和风险管理技术来补充这一策略。
||
This article introduces a trading strategy based on the engulfing pattern on a 4-hour timeframe, combined with dynamic take profit and fixed stop loss mechanisms. The strategy utilizes the powerful price action signal of engulfing patterns to identify potential trend reversals, managing risk and optimizing profits through dynamic profit targets and fixed stop losses. This strategy is applicable to various financial markets, including stocks, forex, and cryptocurrencies.
The core principle of this strategy is to identify bullish and bearish engulfing patterns on the 4-hour chart. An engulfing pattern is a price formation consisting of two candles, where the body of the second candle completely "engulfs" the body of the previous candle. This pattern is often viewed as a potential trend reversal signal.
Specifically, the strategy operates as follows:
-
Bullish Engulfing Pattern: A bullish engulfing pattern forms when the current closing price is higher than the previous candle's opening price, and the current opening price is lower than the previous candle's closing price. The strategy opens a long position in this case.
-
Bearish Engulfing Pattern: A bearish engulfing pattern forms when the current closing price is lower than the previous candle's opening price, and the current opening price is higher than the previous candle's closing price. The strategy opens a short position in this case.
-
Dynamic Take Profit: The strategy sets profit targets using the body size of the engulfing candle multiplied by an adjustable multiplier. This method allows for dynamic adjustment of profit targets based on market volatility.
-
Fixed Stop Loss: The strategy uses a fixed number of points to set stop losses, which helps limit the maximum loss for each trade.
-
Position Sizing: By default, the strategy uses 10% of the account equity as the position size for each trade, contributing to effective money management.
-
Reliable Entry Signals: Engulfing patterns are widely recognized price action patterns that often provide relatively reliable trend reversal signals. Using this pattern on a 4-hour timeframe can filter out noise from smaller timeframes.
-
Dynamic Take Profit Mechanism: By using the engulfing candle's body size to set profit targets, the strategy can automatically adjust targets based on current market volatility. This approach helps capture larger profits in high volatility environments while protecting gains in less volatile periods.
-
Risk Management: The fixed stop loss mechanism provides a clear risk limit for each trade, helping to prevent substantial losses.
-
High Adaptability: The strategy can be applied to various financial markets and trading instruments, demonstrating broad applicability.
-
Simple yet Effective: The strategy logic is relatively simple, easy to understand and implement, while still capable of capturing significant market turning points.
-
Customizability: The strategy offers several adjustable parameters, such as the take profit multiplier and stop loss points, allowing traders to optimize according to their risk preferences and trading styles.
-
False Breakout Risk: Engulfing patterns may sometimes produce false signals, especially in ranging markets or highly volatile environments. This can lead to unnecessary trades and potential losses.
-
Overtrading: Under certain market conditions, the strategy may generate too many trading signals, increasing transaction costs and potentially leading to overtrading.
-
Slippage Risk: In rapidly moving markets, actual entry and exit prices may differ from expected levels, affecting the overall performance of the strategy.
-
Limitations of Fixed Stop Loss: While fixed point stop losses provide clear risk control, they may not be suitable for all market conditions, especially during periods of dramatic volatility changes.
-
Dependency on a Single Indicator: The strategy primarily relies on the engulfing pattern as a single indicator, potentially overlooking other important market information and indicators.
-
Parameter Sensitivity: The strategy's performance may be highly sensitive to parameter settings such as take profit multipliers and stop loss points, requiring careful optimization and backtesting.
-
Introduce Additional Filtering Conditions: Consider combining other technical indicators, such as trend indicators (e.g., moving averages) or momentum indicators (e.g., Relative Strength Index - RSI), to confirm the validity of engulfing patterns and reduce false signals.
-
Dynamic Stop Loss Mechanism: Consider using the Average True Range (ATR) indicator to set dynamic stop losses, allowing for better adaptation to current market volatility.
-
Time Filtering: Add time filters to avoid opening positions during low volatility periods (e.g., Asian session), thereby reducing the risk of false breakouts.
-
Market State Identification: Implement algorithms to identify whether the current market is trending or ranging, and adjust strategy parameters or pause trading accordingly.
-
Position Management Optimization: Implement more sophisticated position management strategies, such as dynamically adjusting position sizes based on account balance, current volatility, or win rate.
-
Multi-Timeframe Analysis: Incorporate longer and shorter timeframes to confirm trends and entry points, enhancing the robustness of the strategy.
-
Machine Learning Optimization: Use machine learning algorithms to optimize strategy parameters or predict the success rate of engulfing patterns.
-
Correlation Analysis: When running the strategy on multiple trading instruments simultaneously, consider the correlation between instruments to better diversify risk.
The 4-hour timeframe engulfing pattern trading strategy, combined with dynamic take profit and fixed stop loss, provides traders with a simple yet effective method of market participation. The strategy leverages the classic price action pattern of engulfing candles to identify potential trend reversals, adapting to changes in market volatility through a dynamic take profit mechanism. The fixed point stop loss provides clear risk control for each trade.
While the strategy has several advantages, such as reliable entry signals, dynamic take profit, and clear risk management, it also has potential risks, including false breakouts and over-reliance on a single indicator. To further improve the strategy's robustness and performance, considerations can be made to introduce additional filtering conditions, implement dynamic stop losses, conduct multi-timeframe analysis, and other optimization directions.
Overall, this strategy provides traders with a good starting point that can be further customized and optimized according to individual trading styles and risk preferences. Through careful parameter adjustment, thorough backtesting, and live trading validation, the strategy has the potential to become an important component of a reliable trading system. However, traders should always keep in mind the unpredictability of markets and supplement this strategy with other analysis methods and risk management techniques.
[/trans]
Source (PineScript)
/*backtest
start: 2023-07-20 00:00:00
end: 2024-07-25 00:00:00
period: 1d
basePeriod: 1h
exchanges: [{"eid":"Futures_Binance","currency":"BTC_USDT"}]
*/

//@version=5
strategy("4H Engulfing Candle Strategy", overlay=true, default_qty_type=strategy.percent_of_equity, default_qty_value=10)

// Input variables
tpMultiplier = input.float(1.0, "Take Profit Multiplier", step=0.1)
slTicks = input.int(100, "Stop Loss Ticks")  // Number of ticks for SL

// Calculate body size for bullish and bearish engulfing candles on 4H timeframe
bullishBodySize = close - open
bearishBodySize = open - close

// Determine engulfing conditions on 4H timeframe
bullishEngulfing = close > open[1] and open < close[1] and open <= open[1] and close >= close[1]
bearishEngulfing = close < open[1] and open > close[1] and open >= open[1] and close <= close[1]

// Entry and exit levels
var float entryPrice = na
var float tpPrice = na
var float slPrice = na

if bullishEngulfing
    entryPrice := close
    tpPrice := close + bullishBodySize * tpMultiplier
    slPrice := entryPrice - slTicks * syminfo.mintick  // Calculate SL price based on ticks and tick size

    // Execute strategy orders for bullish engulfing
    strategy.entry("Buy", strategy.long)
    strategy.exit("TP/SL", "Buy", limit=tpPrice, stop=slPrice)

if bearishEngulfing
    entryPrice := close
    tpPrice := close - bearishBodySize * tpMultiplier
    slPrice := entryPrice + slTicks * syminfo.mintick  // Calculate SL price based on ticks and tick size

    // Execute strategy orders for bearish engulfing
    strategy.entry("Sell", strategy.short)
    strategy.exit("TP/SL", "Sell", limit=tpPrice, stop=slPrice)

// Plot entry, take profit and stop loss levels
plot(entryPrice, color=color.new(color.green, 0), style=plot.style_stepline, title="Entry Price")
plot(tpPrice, color=color.new(color.green, 0), style=plot.style_stepline, title="Take Profit")
plot(slPrice, color=color.new(color.red, 0), style=plot.style_stepline, title="Stop Loss")
Detail
https://www.fmz.com/strategy/457777
Last Modified
2024-07-26 15:06:14