Name
44-SMA和9-EMA交叉策略结合RSI过滤及止盈止损-44-SMA-and-9-EMA-Crossover-Strategy-with-RSI-Filter-and-TP-SL
Author
ChaoZhang
Strategy Description
[trans]
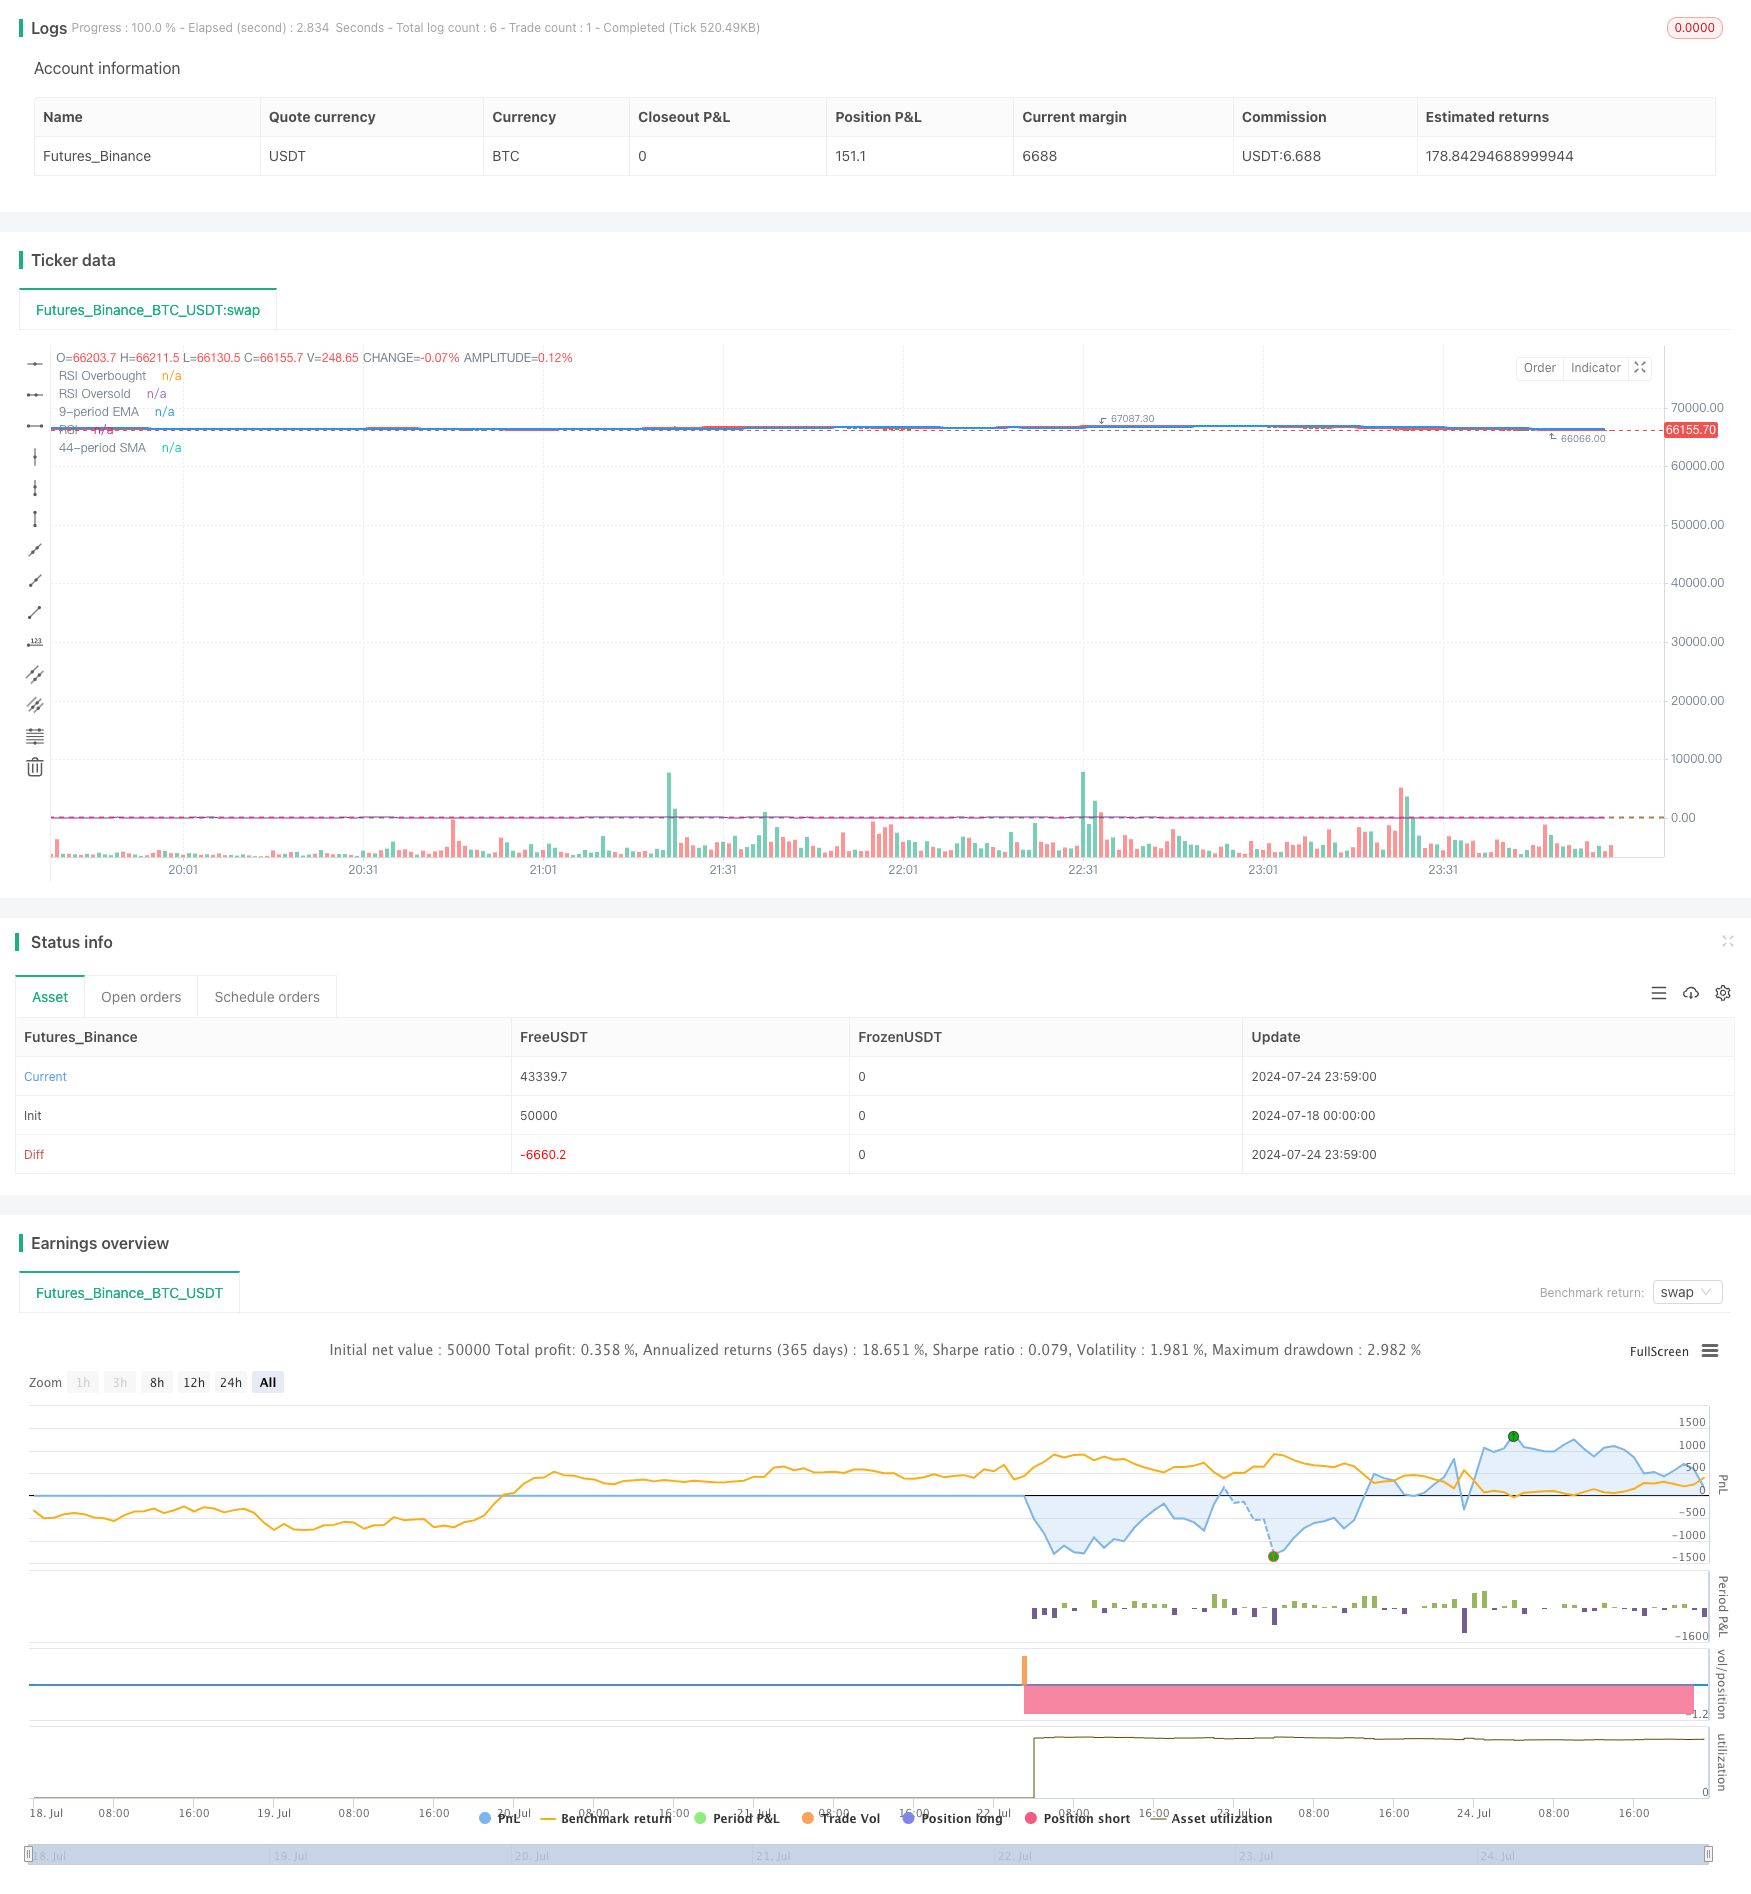
这个策略是一个基于均线交叉和RSI指标过滤的交易系统,结合了止盈止损功能。它利用44周期简单移动平均线(SMA)和9周期指数移动平均线(EMA)的交叉来生成交易信号,同时使用相对强弱指数(RSI)作为额外的过滤条件。策略还包含了止盈和止损设置,以管理风险和锁定利润。
-
均线交叉:策略使用44周期SMA和9周期EMA。当SMA从下方穿过EMA,且收盘价高于两条均线时,视为买入信号。相反,当SMA从上方穿过EMA,且收盘价低于两条均线时,视为卖出信号。
-
蜡烛图确认:策略要求买入信号出现时,当前蜡烛线为阳线(收盘价高于开盘价);卖出信号出现时,当前蜡烛线为阴线(收盘价低于开盘价)。
-
RSI过滤:策略使用14周期的RSI指标。买入信号要求RSI低于70(非超买),卖出信号要求RSI高于30(非超卖)。这有助于避免在极端市场条件下进行交易。
-
止盈止损:策略在进场时就设置了35点的止盈和止损。这有助于自动管理风险和锁定利润。
-
可视化:策略在图表上绘制了SMA和EMA线,并在出现信号时在图表下方显示买入或卖出箭头。RSI指标被绘制在单独的窗格中,包括超买和超卖水平线。
-
多重确认:策略结合了均线交叉、蜡烛图形态和RSI指标,提供了多重确认,有助于减少假信号。
-
趋势跟随:使用长期(44周期)和短期(9周期)均线的交叉,有助于捕捉市场趋势的变化。
-
风险管理:内置的止盈止损机制有助于控制每笔交易的风险,防止大幅亏损。
-
过滤极端行情:RSI过滤条件有助于避免在超买或超卖区域进行交易,减少逆势操作的风险。
-
可视化辅助:图表上的指标和信号标记提供了直观的视觉参考,有助于交易者快速理解市场状况。
-
灵活性:策略允许用户自定义关键参数,如均线周期、RSI设置和止盈止损点数,以适应不同的交易品种和市场环境。
-
滞后性:移动平均线本质上是滞后指标,可能导致在快速变化的市场中出现滞后信号。
-
震荡市不适用:在横盘震荡市场中,该策略可能产生频繁的假信号,导致过度交易。
-
固定止盈止损:使用固定点数的止盈止损可能不适合所有市场条件,在波动性较大的市场中可能过早触发。
-
过度依赖技术指标:策略完全基于技术指标,忽视了基本面因素,可能在重大新闻或事件发生时表现不佳。
-
参数敏感性:策略性能可能对参数设置非常敏感,需要经常调整以适应不同的市场环境。
-
动态止盈止损:考虑使用ATR(平均真实波幅)来设置动态的止盈止损水平,以适应市场波动性的变化。
-
增加成交量指标:结合成交量分析可以提高信号的可靠性,例如要求信号出现时成交量增加。
-
趋势强度过滤:可以加入ADX(平均趋向指标)来衡量趋势强度,只在强趋势中进行交易。
-
时间框架确认:考虑在多个时间框架上确认信号,以减少假信号并提高胜率。
-
加入基本面过滤:结合经济日历或新闻事件过滤器,避免在重要公告前后交易。
-
优化参数选择:使用历史数据进行回测和优化,找出不同市场条件下的最优参数组合。
-
考虑加入其他技术指标:如布林带或斐波那契回撤水平,以提供额外的支撑和阻力参考。
44 SMA和9 EMA交叉策略结合RSI过滤及止盈止损是一个全面的技术分析交易系统,结合了趋势跟随和动量概念。它通过多重确认机制和内置的风险管理功能,为交易者提供了一个相对稳健的交易框架。然而,像所有交易策略一样,它并非完美无缺,存在一些固有的局限性和风险。
交易者在使用这个策略时,应当充分理解其原理和局限性,并根据具体的交易品种和市场环境进行适当的调整和优化。通过持续的监控和改进,结合对市场的深入理解,这个策略可以成为交易者工具箱中的有力武器。最重要的是,交易者应该始终保持谨慎,严格执行风险管理原则,并在实盘交易前进行充分的回测和模拟交易。
||
This strategy is a trading system based on moving average crossovers and RSI indicator filtering, combined with take profit and stop loss functionality. It uses the crossover of a 44-period Simple Moving Average (SMA) and a 9-period Exponential Moving Average (EMA) to generate trading signals, while using the Relative Strength Index (RSI) as an additional filter condition. The strategy also includes take profit and stop loss settings to manage risk and lock in profits.
-
Moving Average Crossover: The strategy uses a 44-period SMA and a 9-period EMA. A buy signal is generated when the SMA crosses above the EMA and the closing price is above both moving averages. Conversely, a sell signal is generated when the SMA crosses below the EMA and the closing price is below both moving averages.
-
Candlestick Confirmation: The strategy requires that for a buy signal, the current candle is bullish (closing price higher than opening price); for a sell signal, the current candle is bearish (closing price lower than opening price).
-
RSI Filter: The strategy uses a 14-period RSI indicator. For a buy signal, the RSI must be below 70 (not overbought), and for a sell signal, the RSI must be above 30 (not oversold). This helps avoid trading in extreme market conditions.
-
Take Profit and Stop Loss: The strategy sets a 35-point take profit and stop loss at entry. This helps automatically manage risk and lock in profits.
-
Visualization: The strategy plots the SMA and EMA lines on the chart and displays buy or sell arrows below the chart when signals occur. The RSI indicator is plotted in a separate pane, including overbought and oversold level lines.
-
Multiple Confirmations: The strategy combines moving average crossovers, candlestick patterns, and RSI indicators, providing multiple confirmations that help reduce false signals.
-
Trend Following: Using the crossover of long-term (44-period) and short-term (9-period) moving averages helps capture changes in market trends.
-
Risk Management: The built-in take profit and stop loss mechanism helps control the risk of each trade and prevent significant losses.
-
Extreme Market Filtering: The RSI filter condition helps avoid trading in overbought or oversold areas, reducing the risk of counter-trend operations.
-
Visual Assistance: The indicators and signal markers on the chart provide intuitive visual references, helping traders quickly understand market conditions.
-
Flexibility: The strategy allows users to customize key parameters such as moving average periods, RSI settings, and take profit/stop loss points to adapt to different trading instruments and market environments.
-
Lag: Moving averages are inherently lagging indicators, which may lead to delayed signals in rapidly changing markets.
-
Unsuitable for Ranging Markets: In sideways, range-bound markets, this strategy may produce frequent false signals, leading to overtrading.
-
Fixed Take Profit and Stop Loss: Using fixed point values for take profit and stop loss may not be suitable for all market conditions and could trigger too early in highly volatile markets.
-
Over-reliance on Technical Indicators: The strategy is entirely based on technical indicators, ignoring fundamental factors, which may perform poorly when significant news or events occur.
-
Parameter Sensitivity: Strategy performance may be highly sensitive to parameter settings, requiring frequent adjustments to adapt to different market environments.
-
Dynamic Take Profit and Stop Loss: Consider using ATR (Average True Range) to set dynamic take profit and stop loss levels to adapt to changes in market volatility.
-
Incorporate Volume Indicators: Combining volume analysis can improve signal reliability, for example, requiring increased volume when signals occur.
-
Trend Strength Filter: Add ADX (Average Directional Index) to measure trend strength and only trade in strong trends.
-
Multi-Timeframe Confirmation: Consider confirming signals on multiple timeframes to reduce false signals and improve win rates.
-
Add Fundamental Filters: Incorporate economic calendar or news event filters to avoid trading before and after important announcements.
-
Optimize Parameter Selection: Use historical data for backtesting and optimization to find the best parameter combinations for different market conditions.
-
Consider Adding Other Technical Indicators: Such as Bollinger Bands or Fibonacci retracement levels to provide additional support and resistance references.
The 44 SMA and 9 EMA Crossover Strategy with RSI Filter and TP/SL is a comprehensive technical analysis trading system that combines trend-following and momentum concepts. It provides traders with a relatively robust trading framework through multiple confirmation mechanisms and built-in risk management functions. However, like all trading strategies, it is not perfect and has some inherent limitations and risks.
When using this strategy, traders should fully understand its principles and limitations, and make appropriate adjustments and optimizations based on specific trading instruments and market environments. Through continuous monitoring and improvement, combined with a deep understanding of the market, this strategy can become a powerful tool in a trader's toolbox. Most importantly, traders should always remain cautious, strictly implement risk management principles, and conduct thorough backtesting and simulated trading before live trading.
[/trans]
Source (PineScript)
/*backtest
start: 2024-07-18 00:00:00
end: 2024-07-25 00:00:00
period: 1m
basePeriod: 1m
exchanges: [{"eid":"Futures_Binance","currency":"BTC_USDT"}]
*/

//@version=5
strategy("SMA and EMA Crossover Strategy with TP/SL, Arrows, and RSI Filter", overlay=true)

// Define the length of the SMAs and EMAs
smaLength = input(44, title="SMA Length")
emaLength = input(9, title="EMA Length")

// Define the profit target and stop loss
profitTarget = input(35, title="Profit Target (Points)")
stopLoss = input(35, title="Stop Loss (Points)")

// RSI parameters
rsiLength = input(14, title="RSI Length")
rsiOverbought = input(70, title="RSI Overbought Level")
rsiOversold = input(30, title="RSI Oversold Level")

// Calculate the SMAs and EMAs
sma = ta.sma(close, smaLength)
ema = ta.ema(close, emaLength)

// Calculate RSI
rsi = ta.rsi(close, rsiLength)

// Plot the SMAs and EMAs
plot(sma, title="44-period SMA", color=color.blue, linewidth=2)
plot(ema, title="9-period EMA", color=color.red, linewidth=2)

// Plot RSI on a separate pane
hline(rsiOverbought, "RSI Overbought", color=color.red)
hline(rsiOversold, "RSI Oversold", color=color.green)
plot(rsi, title="RSI", color=color.purple)

// Entry and Exit Conditions
longCondition = ta.crossover(sma, ema) and close > sma and close > ema and close > open and rsi < rsiOverbought
shortCondition = ta.crossunder(sma, ema) and close < sma and close < ema and close < open and rsi > rsiOversold

// Generate buy signal
if (longCondition)
    strategy.entry("Buy", strategy.long, stop=low - stopLoss, limit=close + profitTarget)

// Generate sell signal
if (shortCondition)
    strategy.entry("Sell", strategy.short, stop=high + stopLoss, limit=close - profitTarget)

// Plot arrows
plotshape(series=longCondition, title="Buy Signal", location=location.belowbar, color=color.green, style=shape.labelup, text="BUY", size=size.small)
plotshape(series=shortCondition, title="Sell Signal", location=location.belowbar, color=color.red, style=shape.labeldown, text="SELL", size=size.small)

// Alerts
alertcondition(longCondition, title="Buy Alert", message="Buy Signal: 44-period SMA crossed above 9-period EMA and green candle closed above both MAs")
alertcondition(shortCondition, title="Sell Alert", message="Sell Signal: 44-period SMA crossed below 9-period EMA and red candle closed below both MAs")
Detail
https://www.fmz.com/strategy/457778
Last Modified
2024-07-26 15:10:58