Name
5分钟K线KDJ指标动态响应交易策略-5-Minute-KDJ-Indicator-Dynamic-Response-Trading-Strategy
Author
ianzeng123
Strategy Description
[trans]
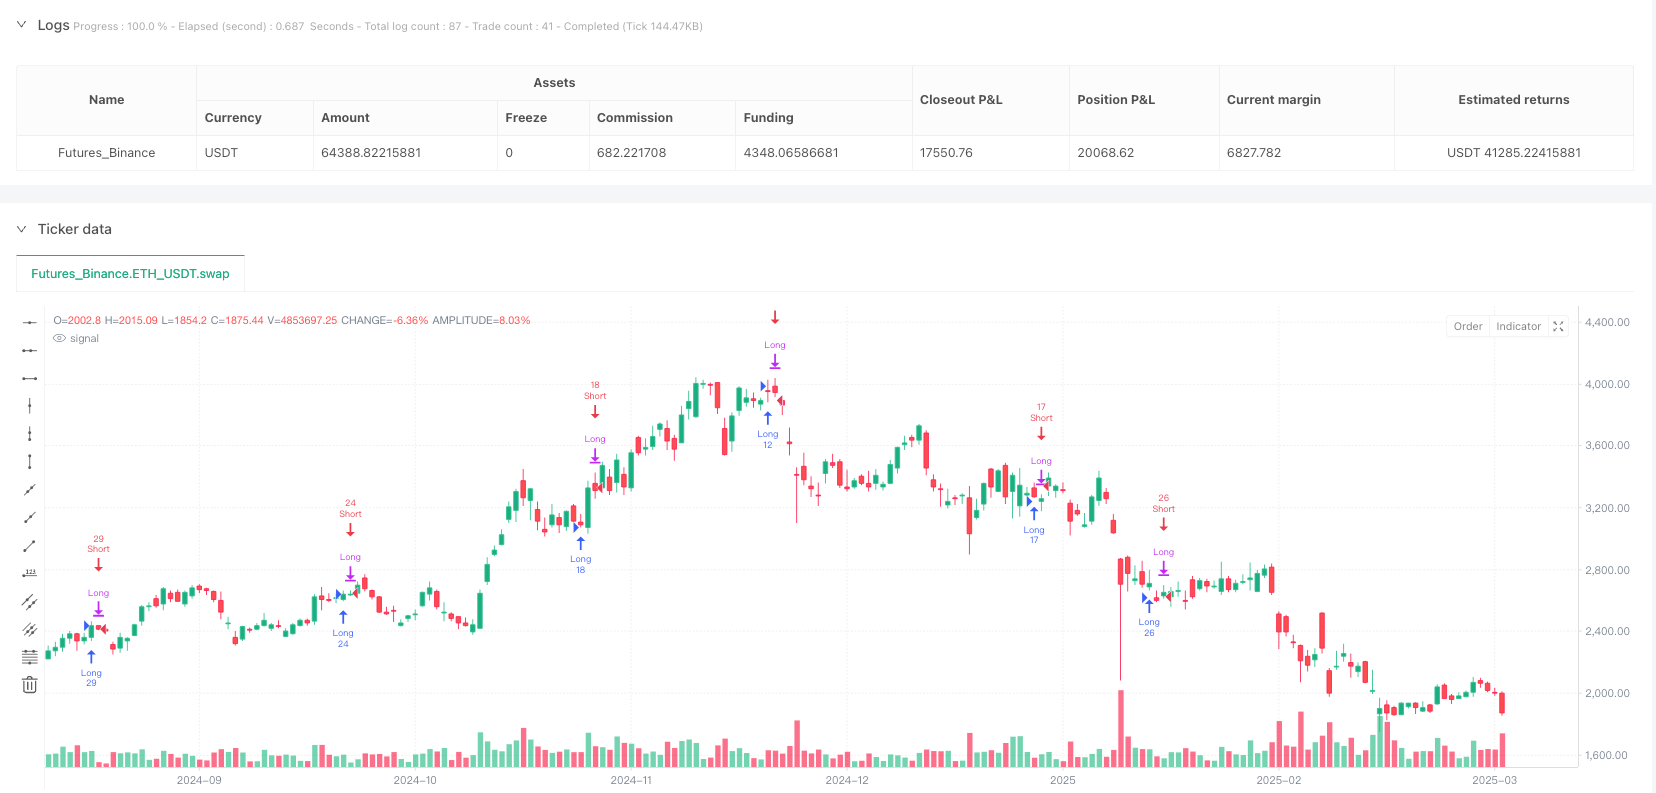
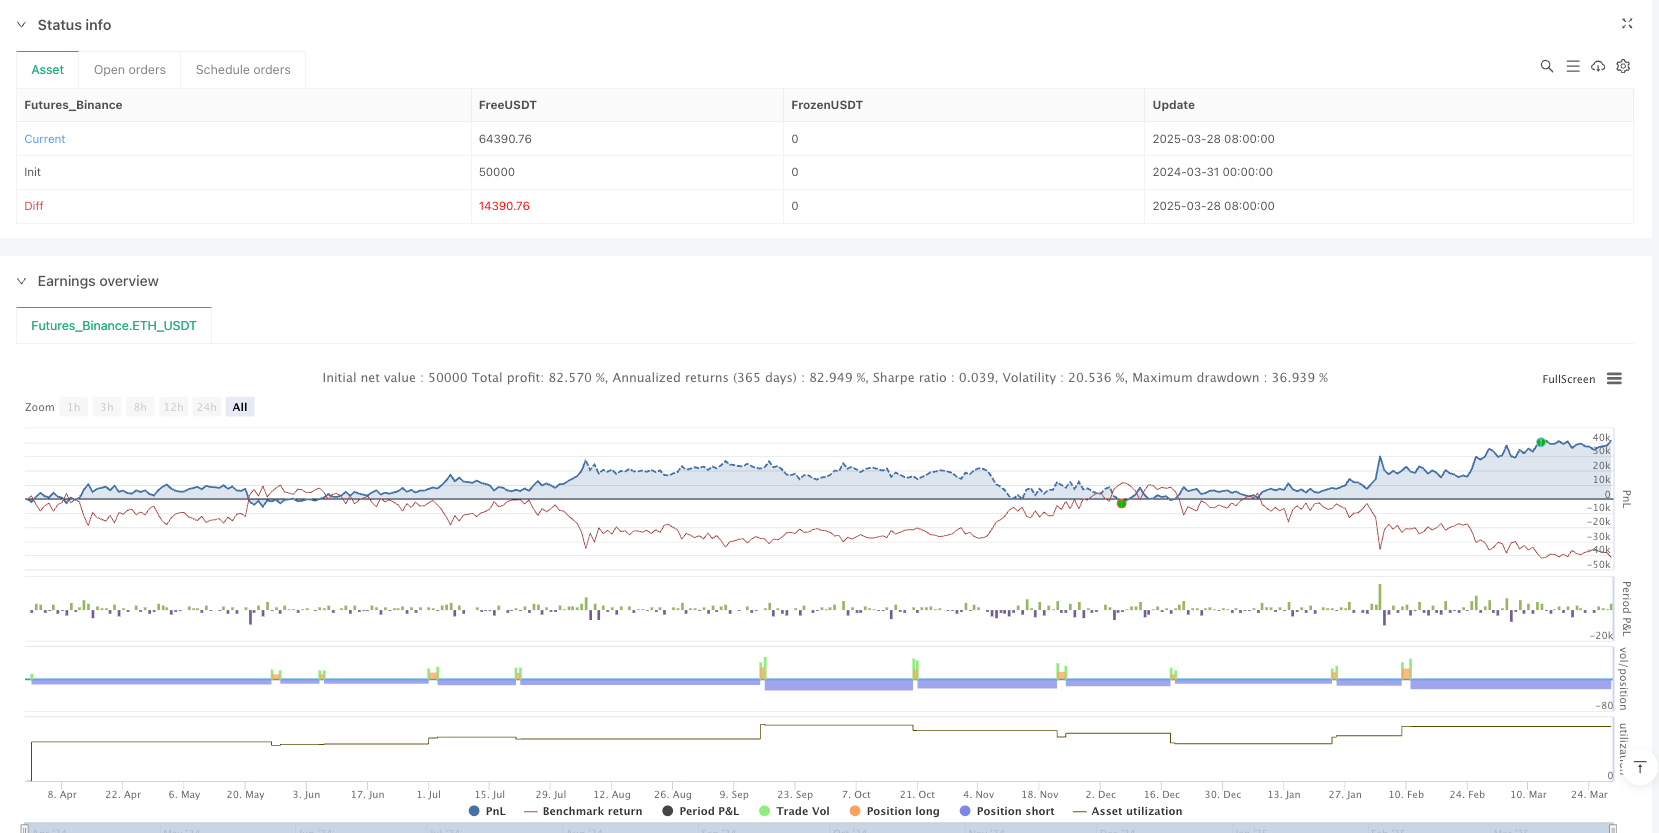
该策略是一个基于KDJ指标的量化交易系统,专为5分钟K线设计,采用极简参数优化了指标的灵敏度和响应速度。策略核心是通过识别市场的超买超卖状态,在极度超卖区域建立多头头寸,在极度超买区域平仓或建立空头头寸。特别之处在于策略采用动态资金管理,根据账户权益自动调整持仓规模,同时设置了详细的时间过滤条件以控制交易窗口。
该策略基于KDJ随机指标的波动特性展开交易决策。KDJ指标由三条线组成:K线、D线和J线,其中:
- K值通过计算收盘价在最近N个周期高低点范围内的相对位置得出
- D值是K值的移动平均
- J值通过公式3K-2D计算得出,放大了K值与D值之间的差异
策略使用了特别短的周期设置(长度为5,K和D的平滑因子均为1),这确保了指标能够对价格变动做出快速响应,特别适合5分钟这种短周期图表的波动特性。
交易逻辑设计如下:
- 当K线下穿5时(极度超卖),建立多头头寸
- 当K线上穿90时(极度超买),平仓多头头寸
- 当K线上穿95时(极度超买),建立空头头寸
- 当K线下穿10时(极度超卖),平仓空头头寸
整个策略通过时间过滤器限制交易区间,只在用户设定的日期范围内(默认2018年1月1日至2069年12月31日)执行交易信号。
-
高度灵敏的市场响应能力:通过设置极短的参数(长度5,平滑因子1),策略能够在市场调头的早期阶段捕捉信号,有效减少滞后。
-
清晰的交易规则:策略采用严格的数值阈值(K<5进多,K>90出多,K>95进空,K<10出空)作为交易触发条件,消除了主观判断,便于量化回测和优化。
-
动态资金管理:策略根据账户权益和当前价格自动计算头寸大小,实现100%资金利用,随着账户增长自动放大交易规模。
-
灵活的时间过滤:通过时间过滤器,策略可以限制在特定时间段内交易,避开不稳定或低效的市场环境。
-
双向交易机制:同时支持多空两个方向的交易,可以充分利用市场双向波动的机会。
-
视觉辅助功能:策略通过标签显示K、D、J值以及超买超卖水平线,方便交易者直观监控指标状态。
-
震荡市场假信号风险:在横盘整理或小幅震荡行情中,KDJ频繁穿越超买超卖区间可能导致频繁交易和连续亏损。
-
趋势持续风险:在强劲趋势中,市场可能长时间保持在超买或超卖状态,导致过早平仓或逆势交易。
-
滑点影响:虽然策略设置了3个点的滑点,但在高波动环境下,实际滑点可能更大,影响策略执行效果。
-
资金管理风险:使用100%资金进行单一方向交易会带来较高的风险暴露,缺乏分散投资和风险控制机制。
-
参数敏感性:策略性能高度依赖于KDJ参数设置,微小的参数变化可能导致显著不同的交易结果。
-
市场缺口风险:在跳空行情中,价格可能直接跨过触发价位,导致实际执行价格远离理想入场点。
解决方法:
- 增加趋势过滤条件,如移动平均线或ADX指标,避免在震荡市场中频繁交易
- 引入止损机制,限制单笔交易的最大亏损
- 降低资金利用率,如只使用30-50%资金进行单一交易
- 通过多时间周期确认,提高信号可靠性
-
增加趋势过滤器:结合方向性指标如ADX或移动平均线系统,只在主趋势方向执行交易,可大幅减少假信号并提高盈利能力。
-
优化资金管理系统:引入基于波动率的头寸管理,如ATR止损或Kelly准则计算最优仓位,以平衡风险与收益。
-
加入多时间周期确认:在执行5分钟信号前,先确认更高时间框架(如15分钟或1小时)的市场状态,提高信号质量。
-
动态参数自适应:基于市场波动率或交易量动态调整KDJ参数,使策略能适应不同市场环境。
-
增加交易过滤条件:如交易量确认、价格形态验证或市场开盘时间限制,避免低质量信号。
-
引入部分仓位管理:采用分批建仓和减仓机制,而非一次性满仓操作,降低单点风险。
-
增加止损和止盈机制:设置基于ATR或固定百分比的止损,保护资金安全;同时配置适当的止盈机制,锁定利润。
这些优化方向的核心目的是提高策略的稳健性和适应性,使其能够在不同市场环境中保持稳定表现,而不仅仅依赖于特定参数和市场条件。
这是一个基于KDJ指标超买超卖原理的短线交易策略,通过高度灵敏的参数设置捕捉5分钟图表上的快速价格反转机会。策略简洁明了,易于理解和实施,具有完整的信号生成机制和资金管理系统。
其主要优势在于响应迅速、规则清晰和双向交易能力,但同时也面临震荡市场假信号和趋势持续风险。通过增加趋势过滤器、多时间周期确认和优化资金管理系统,策略性能有望得到显著提升。
最适合作为短期交易者的基础策略框架,在此基础上根据具体交易品种和市场环境进行进一步优化和定制。尤其适合波动性较高但有一定范围界限的交易品种,在这类市场中可以充分发挥KDJ指标捕捉反转点的优势。||
This strategy is a quantitative trading system based on the KDJ indicator, specifically designed for 5-minute charts, with minimalist parameters optimized for sensitivity and quick response. The core of the strategy is to identify overbought and oversold market conditions, establishing long positions in extremely oversold areas and closing positions or establishing short positions in extremely overbought areas. What makes it special is the dynamic capital management that automatically adjusts position size based on account equity, along with detailed time filtering conditions to control trading windows.
The strategy bases trading decisions on the oscillatory characteristics of the KDJ stochastic indicator. The KDJ indicator consists of three lines: K, D, and J, where:
- The K value is calculated by determining the relative position of the closing price within the range of high and low points over the most recent N periods
- The D value is a moving average of the K value
- The J value is calculated using the formula 3K-2D, which amplifies the difference between K and D values
The strategy employs particularly short period settings (length of 5, smoothing factors of 1 for both K and D), ensuring that the indicator responds quickly to price movements, especially suitable for the volatility characteristics of 5-minute charts.
The trading logic is designed as follows:
- When K crosses below 5 (extremely oversold), establish a long position
- When K crosses above 90 (extremely overbought), close the long position
- When K crosses above 95 (extremely overbought), establish a short position
- When K crosses below 10 (extremely oversold), close the short position
The entire strategy restricts trading to within a user-defined date range (default January 1, 2018, to December 31, 2069) using a time filter.
-
Highly Sensitive Market Response: By setting extremely short parameters (length 5, smoothing factor 1), the strategy can capture signals in the early stages of market reversals, effectively reducing lag.
-
Clear Trading Rules: The strategy employs strict numerical thresholds (K<5 for long entry, K>90 for long exit, K>95 for short entry, K<10 for short exit) as trading triggers, eliminating subjective judgment and facilitating quantitative backtesting and optimization.
-
Dynamic Capital Management: The strategy automatically calculates position size based on account equity and current price, achieving 100% capital utilization and automatically scaling up trading size as the account grows.
-
Flexible Time Filtering: Through the time filter, the strategy can restrict trading to specific time periods, avoiding unstable or inefficient market environments.
-
Bi-directional Trading Mechanism: Supports trading in both long and short directions, fully leveraging opportunities from market fluctuations in both directions.
-
Visual Assistance Features: The strategy displays K, D, J values and overbought/oversold level lines through labels, allowing traders to intuitively monitor indicator status.
-
False Signal Risk in Ranging Markets: In consolidation or minor fluctuation markets, frequent KDJ crossings of overbought and oversold zones may lead to frequent trading and consecutive losses.
-
Trend Continuation Risk: In strong trends, markets may remain in overbought or oversold conditions for extended periods, leading to premature exits or counter-trend trades.
-
Slippage Impact: Although the strategy sets a slippage of 3 points, actual slippage could be larger in highly volatile environments, affecting strategy execution.
-
Capital Management Risk: Using 100% of capital for a single directional trade creates high risk exposure, lacking diversification and risk control mechanisms.
-
Parameter Sensitivity: Strategy performance is highly dependent on KDJ parameter settings, with small parameter changes potentially leading to significantly different trading results.
-
Gap Risk: In gap markets, prices may skip trigger levels entirely, causing actual execution prices to be far from ideal entry points.
Solutions:
- Add trend filtering conditions, such as moving averages or ADX indicators, to avoid frequent trading in ranging markets
- Introduce stop-loss mechanisms to limit maximum loss per trade
- Reduce capital utilization, such as using only 30-50% of capital for single trades
- Confirm signals across multiple timeframes to improve reliability
-
Add Trend Filters: Combine directional indicators such as ADX or moving average systems to execute trades only in the direction of the main trend, significantly reducing false signals and improving profitability.
-
Optimize Capital Management System: Introduce position management based on volatility, such as ATR stops or Kelly criterion for optimal position sizing, to balance risk and reward.
-
Add Multi-timeframe Confirmation: Confirm higher timeframe market conditions (such as 15-minute or 1-hour) before executing 5-minute signals to improve signal quality.
-
Dynamic Parameter Adaptation: Dynamically adjust KDJ parameters based on market volatility or volume, allowing the strategy to adapt to different market environments.
-
Add Trading Filters: Implement volume confirmation, price pattern verification, or market opening time restrictions to avoid low-quality signals.
-
Introduce Partial Position Management: Adopt mechanisms for building and reducing positions in batches rather than all-at-once operations to reduce single-point risk.
-
Add Stop-loss and Take-profit Mechanisms: Set stop-losses based on ATR or fixed percentages to protect capital; also configure appropriate take-profit mechanisms to lock in profits.
The core purpose of these optimization directions is to enhance the strategy's robustness and adaptability, enabling it to maintain stable performance across different market environments rather than relying solely on specific parameters and market conditions.
This is a short-term trading strategy based on the overbought and oversold principles of the KDJ indicator, capturing rapid price reversal opportunities on 5-minute charts through highly sensitive parameter settings. The strategy is concise, easy to understand and implement, with a complete signal generation mechanism and capital management system.
Its main advantages are quick response, clear rules, and bi-directional trading capabilities, but it also faces false signal risks in ranging markets and trend continuation risks. By adding trend filters, multi-timeframe confirmation, and optimizing the capital management system, strategy performance can be significantly improved.
It is most suitable as a basic strategy framework for short-term traders, with further optimization and customization based on specific trading instruments and market environments. It is particularly suitable for trading instruments with high volatility but defined range boundaries, where the KDJ indicator's advantage in capturing reversal points can be fully leveraged.[/trans]
Source (PineScript)
/*backtest
start: 2024-03-31 00:00:00
end: 2025-03-29 08:00:00
period: 1d
basePeriod: 1d
exchanges: [{"eid":"Futures_Binance","currency":"ETH_USDT"}]
*/

//@version=6
strategy("Demo GPT - KDJ Strategy", overlay=false, slippage=3)

// Note: PineScript v6 doesn’t support setting commission in code.
// To apply 0.1% commission, set it manually in TradingView Strategy Properties > Commission.

// Inputs optimized for 5-minute chart
length = input.int(5, "Length", minval=1)        // Shorter lookback for sensitivity
smoothK = input.int(1, "Smooth K", minval=1)     // Minimal smoothing for quick response
smoothD = input.int(1, "Smooth D", minval=1)     // Minimal smoothing for quick response

// KDJ Calculation (no lookahead)
raw_k = ta.stoch(high, low, close, length)
k = ta.sma(raw_k, smoothK)
d = ta.sma(k, smoothD)
j = 3 * k - 2 * d

// Label Workaround for Visuals
label.new(bar_index, k, "K: " + str.tostring(k), color=color.blue, textcolor=color.white, style=label.style_label_down)
label.new(bar_index, d, "D: " + str.tostring(d), color=color.red, textcolor=color.white, style=label.style_label_down)
label.new(bar_index, j, "J: " + str.tostring(j), color=color.purple, textcolor=color.white, style=label.style_label_down)
// Static overbought/oversold levels
label.new(bar_index, 80, "Overbought: 80", color=color.gray, textcolor=color.gray, style=label.style_none)
label.new(bar_index, 20, "Oversold: 20", color=color.gray, textcolor=color.gray, style=label.style_none)

// Calculate quantity for 100% of capital
qty = math.floor(strategy.equity / close)

// Entry and Exit Logic
long_entry = k < 5         // Enter Long when K < 5
long_exit = k > 90        // Exit Long when K > 90
short_entry = k > 95      // Enter Short when K > 95
short_exit = k < 10      // Exit Short when K < 10

// Trade Execution (Enter and hold until exit condition)
if (long_entry)
    strategy.entry("Long", strategy.long, qty=qty)  // Enter Long with 100% capital
if (long_exit)
    strategy.close("Long")                         // Close Long
if (short_entry)
    strategy.entry("Short", strategy.short, qty=qty) // Enter Short with 100% capital
if (short_exit)
    strategy.close("Short")                         // Close Short
Detail
https://www.fmz.com/strategy/488889
Last Modified
2025-03-31 16:26:56