Name
50周期指数移动平均线交叉结合月度定投的双重优化趋势跟踪策略-50-Period-EMA-Crossover-with-Monthly-Dollar-Cost-Averaging-Dual-Optimization-Trend-Following-Strategy
Author
ianzeng123
Strategy Description
[trans]
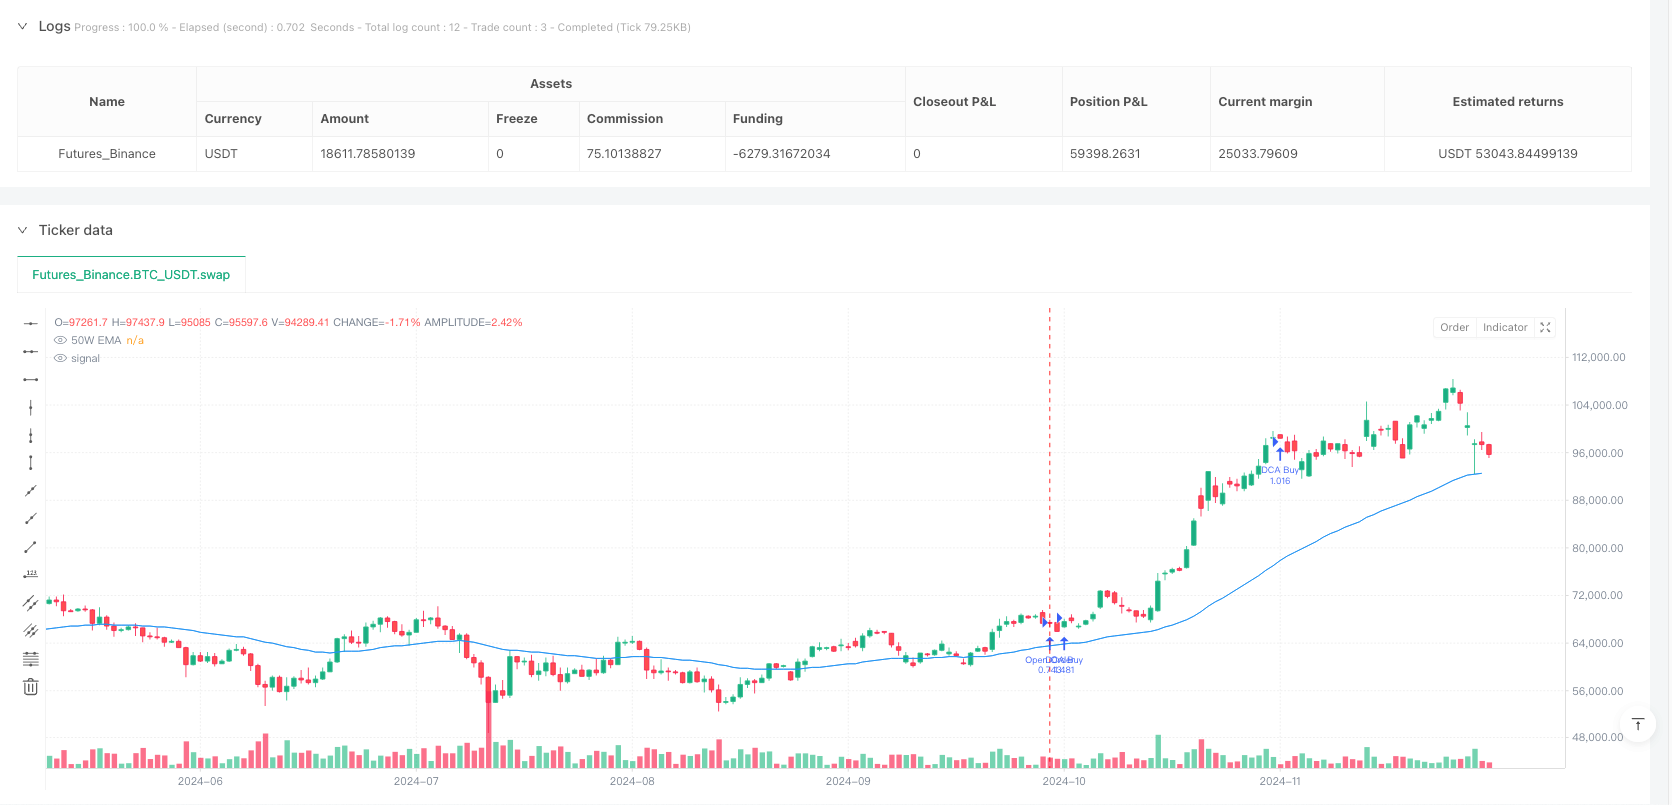
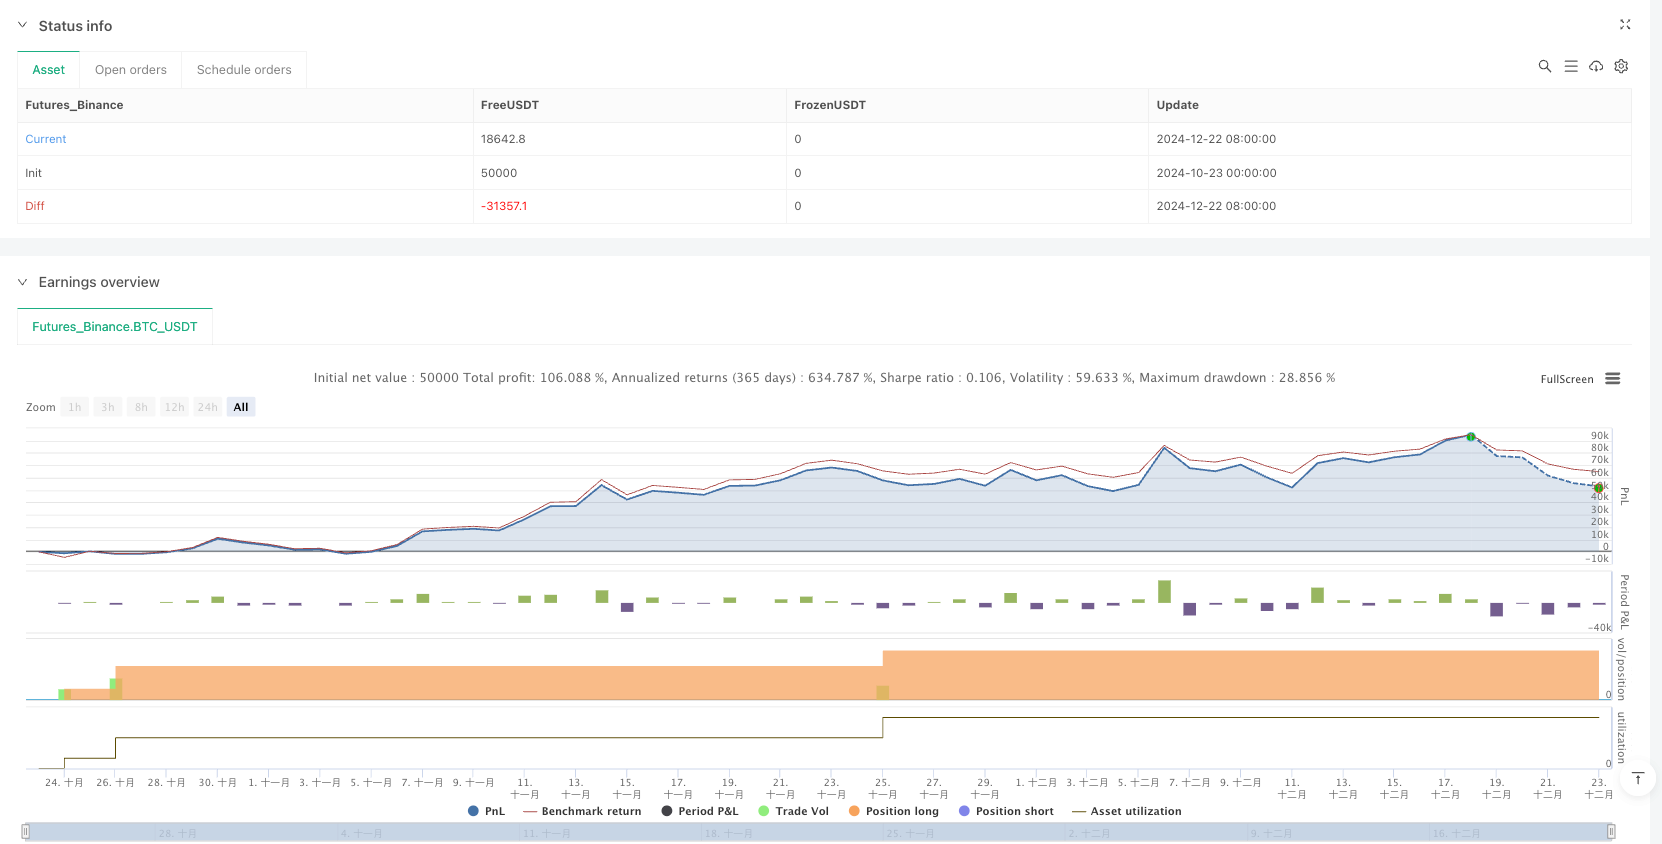
这个策略巧妙地结合了趋势跟踪原则与定期定额投资(DCA)方法,旨在高效部署资金的同时最小化市场择时风险。该策略主要基于50周期指数移动平均线(EMA)作为市场趋势的判断指标,并通过月度定投方式积累资金。当价格低于50周期EMA时,策略会每月将固定金额添加到现金储备中;一旦价格突破50周期EMA上方,策略会立即将所有累积的资金投入市场,并在持仓期间继续执行月度定投。如果价格重新跌破50周期EMA,策略会平仓所有头寸并重新开始现金积累过程。
该策略的核心原理是将技术分析中的趋势信号与系统化的资金管理方法相结合。具体实现机制如下:
-
趋势判断机制:使用50周期EMA作为中长期趋势的指标。当价格位于EMA上方时,被视为上升趋势;当价格跌破EMA下方时,被视为下降趋势。
-
资金积累阶段:当价格低于50周期EMA时(非做多条件),策略不进行市场头寸操作,而是每月将固定金额(参数设置为10万单位货币)添加到现金储备中。这确保了在不利市场条件下资金能够得到持续积累。
-
资金部署阶段:当价格突破50周期EMA上方时(满足做多条件),策略会:
- 如果当前没有持仓,则使用全部资本(包括累积的现金储备)建立多头头寸
- 将现金储备重置为0
- 在持仓期间,每月继续以固定金额进行定投买入
-
退出机制:一旦价格跌破50周期EMA下方,策略会平仓所有头寸,重新开始现金储备的积累过程。
从代码实现上看,该策略使用cash_reserve变量追踪累积的现金,使用time_since_last_investment变量确保定投的时间间隔准确控制在约一个月(30天),并通过strategy.close_all()函数实现完整的退出机制。
深入分析代码后,该策略展现出以下显著优势:
-
系统化投资方法:该策略完全消除了情绪化决策,通过预设的规则确保资金在任何市场条件下都能得到系统化部署。这避免了人为判断引起的延迟或犹豫。
-
资金使用效率最大化:通过在不利条件下积累资金,并在有利条件出现时一次性部署所有累积资金,策略实现了资金使用效率的最大化。这种方法既避免了在下跌趋势中过早投入,又确保了在上升趋势中充分参与。
-
风险与回报平衡:结合趋势跟踪和定投的双重机制,在保护资本安全的同时不会错过重要的市场上涨机会。趋势跟踪部分控制整体风险,而定投部分确保持续参与市场。
-
适应性强:策略参数可以根据不同市场条件和投资者风险偏好进行调整。EMA周期和定投金额都是可调整的参数,增强了策略的灵活性。
-
长期复利效应:通过月度定投和趋势判断相结合,策略能够在长期市场中实现复利增长,特别是在多个市场周期交替的环境下表现出韧性。
-
执行简单明确:尽管策略概念较为先进,但其执行规则简单明确,这降低了操作复杂性和潜在的执行错误。
尽管该策略设计周密,但仍存在以下潜在风险:
-
滞后性风险:EMA是一个滞后指标,可能导致在趋势转折点的入场和出场时机不够理想。特别是在快速变化的市场中,可能会导致较大的回撤后才触发退出信号。
-
震荡市场表现不佳:在横盘震荡市场中,价格可能频繁穿越EMA,导致多次进出场,增加交易成本并可能造成"锯齿效应"损失。
-
资金管理挑战:固定的定投金额可能不适合所有市场阶段,在高波动性环境下可能需要更灵活的资金分配策略。
-
周期依赖性:策略强烈依赖于所选择的EMA周期(此处为50),不同的周期设置会产生截然不同的结果,难以确定最优参数。
-
执行滑点影响:代码中设置了1个点的滑点,但在实际交易中,尤其是流动性不足的市场,执行滑点可能远大于预设值,影响策略表现。
缓解这些风险的方法包括:增加过滤指标减少假信号;实施动态止损机制;引入波动率调整的资金管理;使用多周期确认信号;以及在不同市场环境中进行广泛的回测和参数优化。
基于对代码的深入分析,该策略可以在以下几个方向进行优化:
-
多指标确认机制:引入额外的技术指标(如RSI、MACD或成交量)作为确认信号,减少EMA交叉产生的假信号。这样可以提高信号质量,减少不必要的交易。
-
动态资金管理:将定投金额与市场波动率或趋势强度挂钩,在高确定性环境中增加投资量,在不确定性高的环境中减少投资量。例如,可以基于ATR(真实波动幅度均值)调整定投金额。
-
部分头寸管理:实现分批建仓和分批平仓机制,而不是一次性全仓操作,这可以减轻时机选择的压力并提供更平滑的权益曲线。
-
自适应EMA周期:将固定的50周期EMA改为基于市场条件自动调整的自适应移动平均线,以更好地适应不同的市场阶段和周期。
-
止损机制完善:增加移动止损或基于波动率的止损机制,而不仅仅依赖EMA交叉退出,这可以在大幅回撤时更早地保护资本。
-
时间过滤器:增加交易时间过滤器,避免在已知的低效交易时段进行操作,或者在特定的季节性模式中调整策略参数。
-
回测优化框架:实现参数优化框架,在不同市场条件下自动寻找最优参数组合,并进行前向验证以确保参数的稳健性。
这些优化方向的共同目标是提高策略的胜率,减少回撤,并使资金管理更加灵活高效,从而在保持原有策略核心逻辑的同时,提升其在各种市场环境下的适应性和稳健性。
"50周期指数移动平均线交叉结合月度定投的双重优化趋势跟踪策略"代表了一种平衡、系统化的量化交易方法,它巧妙地融合了技术分析的趋势判断与传统的定期定额投资理念。通过在下跌趋势中积累资金并在上升趋势确立时全力部署,该策略实现了较佳的资金使用效率和风险控制。
尽管存在如EMA指标滞后性和震荡市场表现不佳等固有风险,但通过引入多指标确认、优化资金管理方式和完善止损机制等措施,这些缺点可以得到有效缓解。特别值得注意的是,该策略的灵活性和可定制性使其适用于多种市场环境和投资风格。
从长期投资角度看,这种结合定投与趋势跟踪的策略特别适合希望在保持系统化投资纪律的同时,寻求优化市场参与时机的投资者。通过减少不利趋势中的暴露并充分参与上升趋势,该策略有望在长期市场周期中取得比纯粹的定投或趋势跟踪更为平衡的风险回报特性。
无论是个人投资者还是专业交易者,这种策略都提供了一个可靠的框架,帮助在复杂多变的市场环境中做出更加系统化、客观的投资决策。 ||
This strategy ingeniously combines trend-following principles with dollar-cost averaging (DCA) methodology, aiming to efficiently deploy capital while minimizing market timing risk. The strategy primarily uses the 50-period Exponential Moving Average (EMA) as an indicator for market trend determination, and accumulates funds through monthly fixed investments. When the price is below the 50-period EMA, the strategy adds a fixed amount to a cash reserve each month; once the price breaks above the 50-period EMA, the strategy immediately invests all accumulated funds into the market and continues executing monthly investments during the holding period. If the price falls back below the 50-period EMA, the strategy closes all positions and restarts the cash accumulation process.
The core principle of this strategy is combining technical analysis trend signals with systematic capital management methods. The specific implementation mechanics are as follows:
-
Trend Determination Mechanism: Uses the 50-period EMA as an indicator for medium to long-term trends. When the price is above the EMA, it's considered an uptrend; when the price drops below the EMA, it's considered a downtrend.
-
Capital Accumulation Phase: When the price is below the 50-period EMA (long condition not met), the strategy doesn't take market positions but instead adds a fixed amount (parameter set to 100,000 currency units) to a cash reserve monthly. This ensures continuous capital accumulation during unfavorable market conditions.
-
Capital Deployment Phase: When the price breaks above the 50-period EMA (long condition met), the strategy:
- Establishes a long position using the entire capital (including accumulated cash reserves) if there are no current positions
- Resets the cash reserve to 0
- Continues making fixed monthly investments during the holding period
-
Exit Mechanism: Once the price falls below the 50-period EMA, the strategy closes all positions and restarts the cash reserve accumulation process.
From the code implementation, the strategy uses the cash_reserve variable to track accumulated cash, uses the time_since_last_investment variable to ensure the investment interval is accurately controlled at approximately one month (30 days), and implements a complete exit mechanism through the strategy.close_all() function.
After in-depth code analysis, this strategy demonstrates the following significant advantages:
-
Systematic Investment Method: The strategy completely eliminates emotional decision-making, ensuring capital is systematically deployed under any market conditions through preset rules. This avoids delays or hesitation caused by human judgment.
-
Maximized Capital Efficiency: By accumulating funds during unfavorable conditions and deploying all accumulated capital at once when favorable conditions appear, the strategy maximizes capital utilization efficiency. This approach both avoids premature investment in downtrends and ensures full participation in uptrends.
-
Balanced Risk and Reward: The dual mechanism combining trend following and DCA protects capital safety while not missing important market upside opportunities. The trend-following component controls overall risk, while the DCA component ensures continuous market participation.
-
Strong Adaptability: Strategy parameters can be adjusted according to different market conditions and investor risk preferences. Both the EMA period and investment amount are adjustable parameters, enhancing the strategy's flexibility.
-
Long-term Compounding Effect: By combining monthly investments with trend determination, the strategy can achieve compound growth in long-term markets, showing resilience especially in environments with alternating market cycles.
-
Simple and Clear Execution: Despite the advanced strategy concept, its execution rules are simple and clear, reducing operational complexity and potential execution errors.
Despite the strategy's careful design, the following potential risks exist:
-
Lag Risk: EMA is a lagging indicator, which may lead to less-than-ideal entry and exit timing at trend turning points. Especially in rapidly changing markets, it may lead to significant drawdowns before triggering exit signals.
-
Poor Performance in Ranging Markets: In sideways, oscillating markets, prices may frequently cross the EMA, resulting in multiple entries and exits, increasing transaction costs and potentially causing "whipsaw" losses.
-
Capital Management Challenges: Fixed investment amounts may not be suitable for all market phases, and a more flexible capital allocation strategy may be needed in highly volatile environments.
-
Cycle Dependency: The strategy heavily depends on the chosen EMA period (50 in this case), and different period settings will produce drastically different results, making it difficult to determine optimal parameters.
-
Execution Slippage Impact: The code sets 1 point slippage, but in actual trading, especially in markets with insufficient liquidity, execution slippage may be far greater than the preset value, affecting strategy performance.
Methods to mitigate these risks include: adding filter indicators to reduce false signals; implementing dynamic stop-loss mechanisms; introducing volatility-adjusted capital management; using multi-period confirmation signals; and conducting extensive backtesting and parameter optimization across different market environments.
Based on in-depth code analysis, the strategy can be optimized in the following directions:
-
Multi-indicator Confirmation Mechanism: Introduce additional technical indicators (such as RSI, MACD, or volume) as confirmation signals to reduce false signals generated by EMA crossovers. This can improve signal quality and reduce unnecessary trades.
-
Dynamic Capital Management: Link the investment amount to market volatility or trend strength, increasing investment in high-certainty environments and reducing it in highly uncertain environments. For example, the investment amount could be adjusted based on ATR (Average True Range).
-
Partial Position Management: Implement mechanisms for staged position building and reduction rather than all-or-nothing operations, which can reduce timing pressure and provide a smoother equity curve.
-
Adaptive EMA Period: Change the fixed 50-period EMA to an adaptive moving average that automatically adjusts based on market conditions, better adapting to different market phases and cycles.
-
Improved Stop-Loss Mechanism: Add trailing stops or volatility-based stop-loss mechanisms rather than relying solely on EMA crossover exits, which can protect capital earlier during significant drawdowns.
-
Time Filter: Add trading time filters to avoid operations during known inefficient trading sessions, or adjust strategy parameters within specific seasonal patterns.
-
Backtesting Optimization Framework: Implement a parameter optimization framework that automatically finds optimal parameter combinations under different market conditions and conducts forward validation to ensure parameter robustness.
The common goal of these optimization directions is to improve the strategy's win rate, reduce drawdowns, and make capital management more flexible and efficient, thereby enhancing its adaptability and robustness across various market environments while maintaining the core logic of the original strategy.
The "50-Period EMA Crossover with Monthly Dollar-Cost Averaging Dual-Optimization Trend Following Strategy" represents a balanced, systematic quantitative trading approach that cleverly integrates technical analysis trend determination with traditional dollar-cost averaging investment principles. By accumulating funds during downtrends and deploying them fully when uptrends are established, the strategy achieves optimal capital efficiency and risk control.
Despite inherent risks such as EMA indicator lag and poor performance in ranging markets, these drawbacks can be effectively mitigated through measures like multi-indicator confirmation, optimized capital management methods, and improved stop-loss mechanisms. Particularly noteworthy is the strategy's flexibility and customizability, making it applicable to various market environments and investment styles.
From a long-term investment perspective, this strategy combining DCA with trend following is especially suitable for investors who wish to seek optimized market entry timing while maintaining systematic investment discipline. By reducing exposure during unfavorable trends and fully participating in uptrends, the strategy is likely to achieve a more balanced risk-reward profile over long-term market cycles than either pure DCA or trend following alone.
Whether for individual investors or professional traders, this strategy provides a reliable framework for making more systematic and objective investment decisions in complex and changing market environments.[/trans]
Source (PineScript)
/*backtest
start: 2024-10-23 00:00:00
end: 2024-12-23 00:00:00
period: 1d
basePeriod: 1d
exchanges: [{"eid":"Futures_Binance","currency":"BTC_USDT"}]
*/

//@version=5

//CELIA IS EEN KLEINE VIS

strategy("50 EMA Crossover With Monthly DCA", overlay=true, initial_capital=100000, slippage=1, default_qty_type=strategy.cash, process_orders_on_close=true)

// === Parameters ===
dca_amount = input.int(100000, title="DCA Investment Amount ($)", minval=1)  // Monthly DCA amount
//ema_length = input.int(50, title="EMA Length", minval=1)  // EMA length
emaValue = ta.ema(close, 50)
plot(emaValue, color=color.blue, title="50W EMA")

// === Tracking Variables ===
var float cash_reserve = 0  // To track the accumulated cash
var float total_invested = 0  // To track the total amount invested (cash + DCA)
var float last_investment_time = na
month_seconds = 30 * 24 * 60 * 60  // Approx 1 month in seconds


// === Time Check: Has 1 Month Passed? ===
time_since_last_investment = na(last_investment_time) ? month_seconds : (time - last_investment_time) / 1000

// === Strategy Conditions ===
longCondition = close > emaValue   // Buy when close is above the 50-week EMA
if longCondition
    if strategy.opentrades == 0  // No open positions
        // Invest full capital (equity + cash), including DCA saved
        strategy.order("Open Order", strategy.long, qty = (strategy.equity+cash_reserve) / close)
        cash_reserve := 0  // Reset cash reserve after full reinvestment

    if time_since_last_investment >= month_seconds
        // Accumulate DCA buy orders
        strategy.order("DCA Buy", strategy.long, qty = dca_amount / close)
        last_investment_time := time  // Update the time of the last investment

// Accumulate DCA amount into cash reserve every month, regardless of long condition
if time_since_last_investment >= month_seconds
    last_investment_time := time

// === Exit Strategy ===
exitCondition = close < emaValue  // Exit if the price crosses below the 50-week EMA
if exitCondition
    strategy.close_all()  // Close the position when price crosses below the EMA

//plot(strategy.equity, style = plot.style_line, title = "Equity")
//plot(cash_reserve, style = plot.style_line, title = "DCA")

// Place the text below the current bar
var label myLabel = na
if (na(myLabel))
    myLabel := label.new(bar_index, low - 0.02, "Celia is een kleine vis", color=color.white, textcolor=color.black, style=label.style_label_up, size=size.normal)

// Update the position of the label each bar
label.set_xy(myLabel, bar_index, low - 200)
Detail
https://www.fmz.com/strategy/489642
Last Modified
2025-04-07 11:51:14