Name
52周高低位-平均成交量-成交量突破策略-52-Week-High-Low-Average-Volume-Volume-Breakout-Strategy
Author
ChaoZhang
Strategy Description
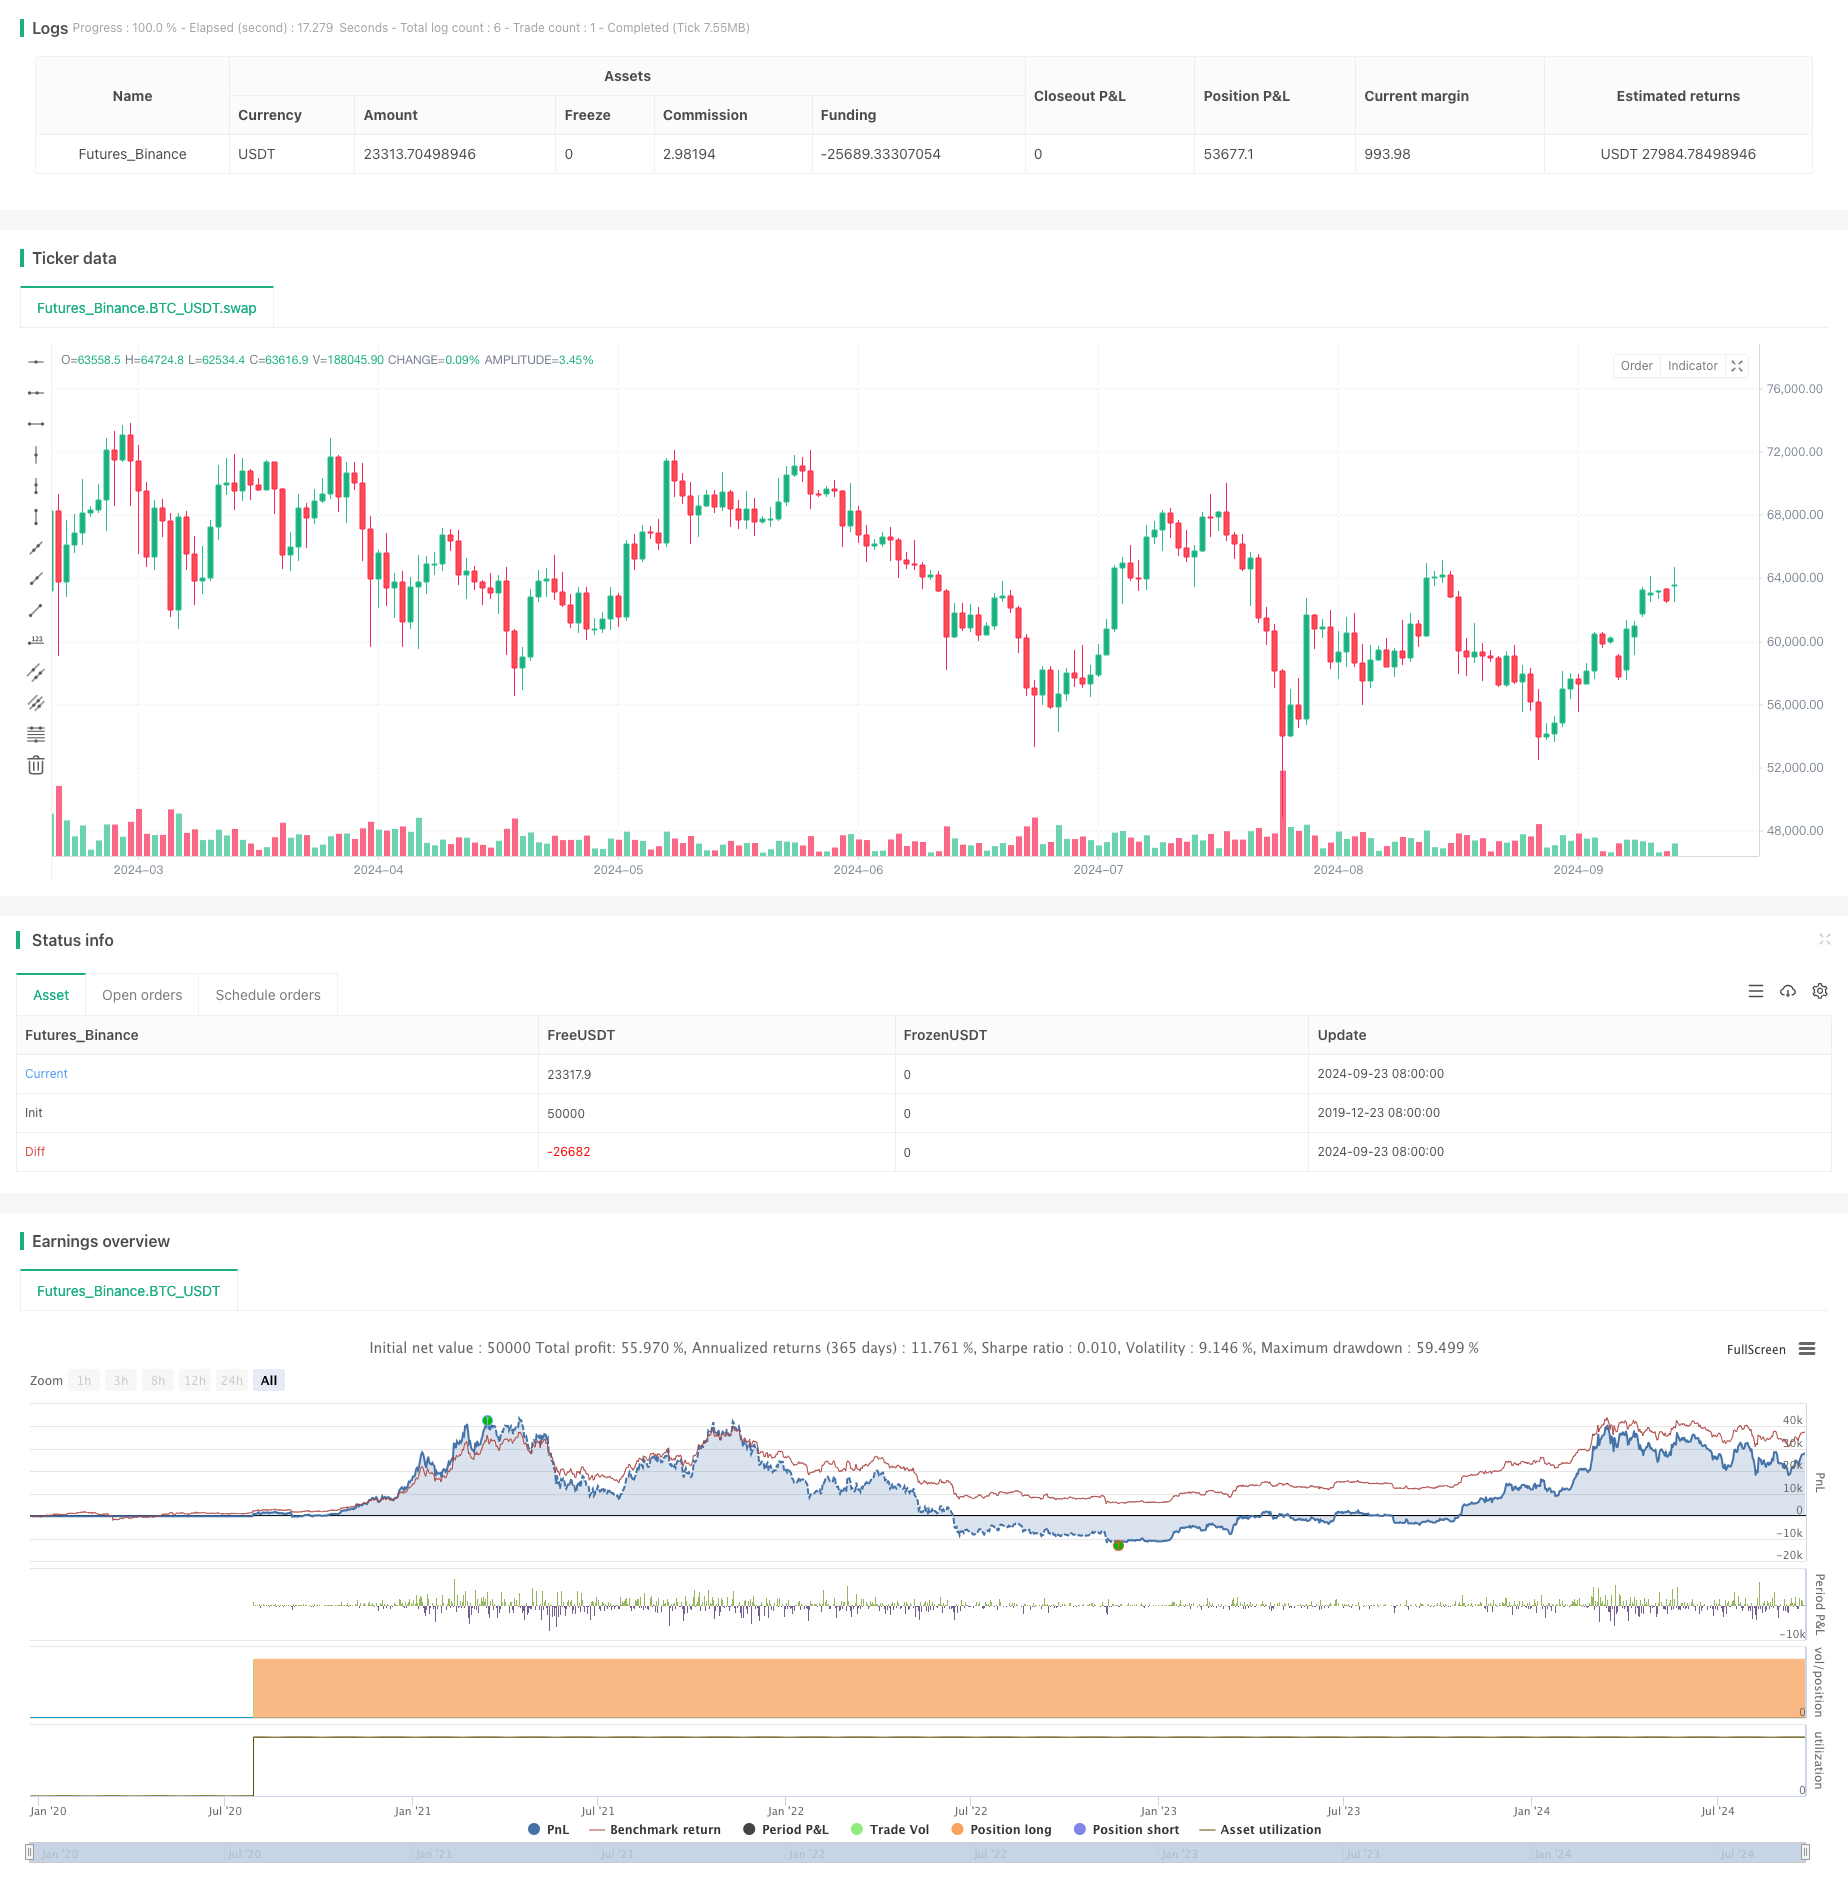
[trans]
这个策略是一个基于52周高低点、平均成交量和价格突破的量化交易策略。它主要关注股票价格接近52周高点、成交量显著增加以及日内价格变动幅度适中的情况。策略通过观察这些指标的组合来识别潜在的买入机会,旨在捕捉股票可能出现的上涨趋势。
该策略的核心原理包括以下几个方面:
-
52周高低点跟踪:策略持续跟踪并更新股票的52周最高价和最低价,这些价格水平通常被视为重要的支撑和阻力位。
-
价格接近52周高点:策略寻找距离52周高点不超过10%(可调整)的股票,这表明股票可能处于强势区间。
-
成交量突破:策略计算50天平均成交量,并寻找当日成交量显著高于平均水平(默认为1.5倍)的情况,这可能预示着市场对该股票兴趣的增加。
-
价格变动限制:策略设置了每日价格变动的上限(日线3%,周线或月线10%),以避免在过度波动的情况下入场。
-
入场信号:当股票同时满足接近52周高点、成交量突破和价格变动适中这三个条件时,策略会发出买入信号。
-
多维度分析:结合了价格、成交量和历史数据等多个维度,提高了信号的可靠性。
-
动态调整:52周高低点会随时间动态更新,使策略能够适应不同的市场环境。
-
风险控制:通过限制日内价格变动幅度,降低了在剧烈波动时入场的风险。
-
可视化辅助:策略在图表上标注了52周高低点和入场信号,便于交易者直观理解市场状况。
-
参数灵活性:多个关键参数可以根据不同市场和个人偏好进行调整,增加了策略的适应性。
-
假突破风险:仅依靠价格接近高点和成交量增加可能导致误判假突破为真突破。
-
滞后性:使用52周数据可能导致策略对市场变化的反应较慢。
-
过度交易:在波动剧烈的市场中,可能会频繁触发入场信号,增加交易成本。
-
单向操作:策略仅关注做多机会,在下跌市场中可能面临较大风险。
-
忽视基本面:策略完全基于技术指标,没有考虑公司基本面和宏观经济因素。
-
引入趋势确认指标:可以添加如移动平均线交叉等趋势确认指标,以减少假突破的风险。
-
优化成交量分析:考虑使用更复杂的成交量分析方法,如相对成交量指标(RVI),以提高成交量突破判断的准确性。
-
增加止损和止盈机制:设置合理的止损和止盈水平,以控制风险和锁定利润。
-
加入做空策略:考虑在价格接近52周低点且满足其他条件时增加做空操作,使策略更全面。
-
引入基本面筛选:结合市盈率(P/E)、市值等基本面指标,对入场标的进行初步筛选。
这个基于52周高低点、平均成交量和价格突破的策略为交易者提供了一个多维度的分析框架。通过综合考虑价格位置、成交量变化和价格动量,策略试图捕捉潜在的上涨机会。然而,交易者在使用此策略时需要注意假突破风险,并考虑结合其他技术和基本面分析工具来增强决策的可靠性。通过持续优化和个性化调整,这个策略有潜力成为一个有效的交易工具。
||
This strategy is a quantitative trading approach based on 52-week high-low levels, average volume, and price breakouts. It primarily focuses on situations where stock prices are near their 52-week highs, volume increases significantly, and intraday price movements are moderate. The strategy aims to identify potential buying opportunities by observing the combination of these indicators, with the goal of capturing potential upward trends in stocks.
The core principles of this strategy include:
-
52-Week High-Low Tracking: The strategy continuously tracks and updates the 52-week highest and lowest prices of stocks, which are often viewed as important support and resistance levels.
-
Price Proximity to 52-Week High: The strategy looks for stocks within 10% (adjustable) of their 52-week high, indicating potential strength.
-
Volume Breakout: It calculates a 50-day average volume and seeks instances where the daily volume significantly exceeds this average (default 1.5 times), potentially indicating increased market interest.
-
Price Change Limits: The strategy sets limits on daily price changes (3% for daily, 10% for weekly or monthly timeframes) to avoid entering during excessive volatility.
-
Entry Signal: A buy signal is generated when a stock simultaneously meets the conditions of being close to its 52-week high, experiencing a volume breakout, and showing moderate price movement.
-
Multi-dimensional Analysis: Combines price, volume, and historical data dimensions, enhancing signal reliability.
-
Dynamic Adjustment: 52-week high-low points update dynamically, allowing the strategy to adapt to different market environments.
-
Risk Control: Limiting intraday price movement range reduces the risk of entering during extreme volatility.
-
Visual Aids: The strategy marks 52-week high-low points and entry signals on charts, facilitating intuitive market understanding.
-
Parameter Flexibility: Several key parameters can be adjusted based on different markets and personal preferences, increasing strategy adaptability.
-
False Breakout Risk: Relying solely on price proximity to highs and volume increase may lead to misinterpreting false breakouts as genuine.
-
Latency: Using 52-week data may result in slow reactions to market changes.
-
Overtrading: In highly volatile markets, entry signals may be triggered frequently, increasing transaction costs.
-
Unidirectional Operations: The strategy only focuses on long opportunities, potentially facing significant risks in declining markets.
-
Neglect of Fundamentals: The strategy is entirely based on technical indicators, disregarding company fundamentals and macroeconomic factors.
-
Introduce Trend Confirmation Indicators: Adding indicators like moving average crossovers could reduce false breakout risks.
-
Optimize Volume Analysis: Consider using more sophisticated volume analysis methods, such as the Relative Volume Indicator (RVI), to improve volume breakout judgment accuracy.
-
Implement Stop-Loss and Take-Profit Mechanisms: Set reasonable stop-loss and take-profit levels to control risks and secure profits.
-
Add Short-Selling Strategy: Consider incorporating short-selling operations when prices approach 52-week lows and meet other conditions, making the strategy more comprehensive.
-
Introduce Fundamental Screening: Combine fundamental indicators like Price-to-Earnings (P/E) ratio and market capitalization for preliminary screening of entry targets.
This strategy, based on 52-week high-low levels, average volume, and price breakouts, provides traders with a multi-dimensional analysis framework. By comprehensively considering price position, volume changes, and price momentum, the strategy attempts to capture potential upward opportunities. However, traders need to be aware of false breakout risks when using this strategy and should consider combining it with other technical and fundamental analysis tools to enhance decision reliability. Through continuous optimization and personalized adjustments, this strategy has the potential to become an effective trading tool.
[/trans]
Source (PineScript)
/*backtest
start: 2019-12-23 08:00:00
end: 2024-09-24 08:00:00
period: 1d
basePeriod: 1d
exchanges: [{"eid":"Futures_Binance","currency":"BTC_USDT"}]
*/

//@version=5
strategy("Custom Stock Trading Strategy with 50-Day Average Volume", overlay=true)

// Define input parameters
percentFromHigh = input.int(10, title="Percentage from 52-Week High for Entry")
volumeMultiplier = input.float(1.5, title="Volume Multiplier for Exponential Rise") // Multiplier to define significant increase in volume

// Define period for average volume
averageVolumePeriod = 50 // 50-day average volume

// Calculate 52-week high and low
weeks = 52 // Number of weeks in a year
daysPerWeek = 5 // Assuming 5 trading days per week
length = weeks * daysPerWeek

// 52-week high and low calculations
highestHigh = ta.highest(close, length)
lowestLow = ta.lowest(close, length)

// // Plot horizontal lines for 52-week high and low
// var line highLine = na
// var line lowLine = na

// if (bar_index == ta.highest(bar_index, length))  // Update lines when the highest index is detected
//     line.delete(highLine)
//     line.delete(lowLine)
//     highLine := line.new(x1=bar_index[0], y1=highestHigh, x2=bar_index + 1, y2=highestHigh, color=color.green, width=2, style=line.style_solid, extend=extend.right)
//     lowLine := line.new(x1=bar_index[0], y1=lowestLow, x2=bar_index + 1, y2=lowestLow, color=color.red, width=2, style=line.style_solid, extend=extend.right)

// // Plot labels for 52-week high and low
// if (bar_index % 100 == 0)  // To avoid cluttering, update labels periodically
//     label.new(x=bar_index, y=highestHigh, text="52-Week High", color=color.green, textcolor=color.white, style=label.style_label_left, size=size.small)
//     label.new(x=bar_index, y=lowestLow, text="52-Week Low", color=color.red, textcolor=color.white, style=label.style_label_left, size=size.small)

// Calculate percentage from 52-week high
percentFromHighValue = 100 * (highestHigh - close) / highestHigh

// Calculate 50-day average volume
avgVolume = ta.sma(volume, averageVolumePeriod)

// Exponential rise in volume condition
volumeRise = volume > avgVolume * volumeMultiplier

// Calculate the percentage change in price for the current period
dailyPriceChange = 100 * (close - open) / open

// Determine the percentage change limit based on the timeframe
priceChangeLimit = if (timeframe.isweekly or timeframe.ismonthly)
    10 // 10% limit for weekly or monthly timeframes
else
    3  // 3% limit for daily timeframe

// Entry condition: stock within 10% of 52-week high, exponential rise in volume, and price change <= limit
entryCondition = percentFromHighValue <= percentFromHigh and volumeRise and dailyPriceChange <= priceChangeLimit

// Strategy logic
if (entryCondition)
    strategy.entry("Buy", strategy.long)

// Plot tiny triangle labels below the candle
// if (entryCondition)
//     label.new(bar_index, low, style=label.style_triangleup, color=color.blue, size=size.tiny)
Detail
https://www.fmz.com/strategy/468326
Last Modified
2024-09-26 15:47:03