Name
AI趋势预测交易策略AI-Trend-Predictor-Trading-Strategy
Author
ChaoZhang
Strategy Description
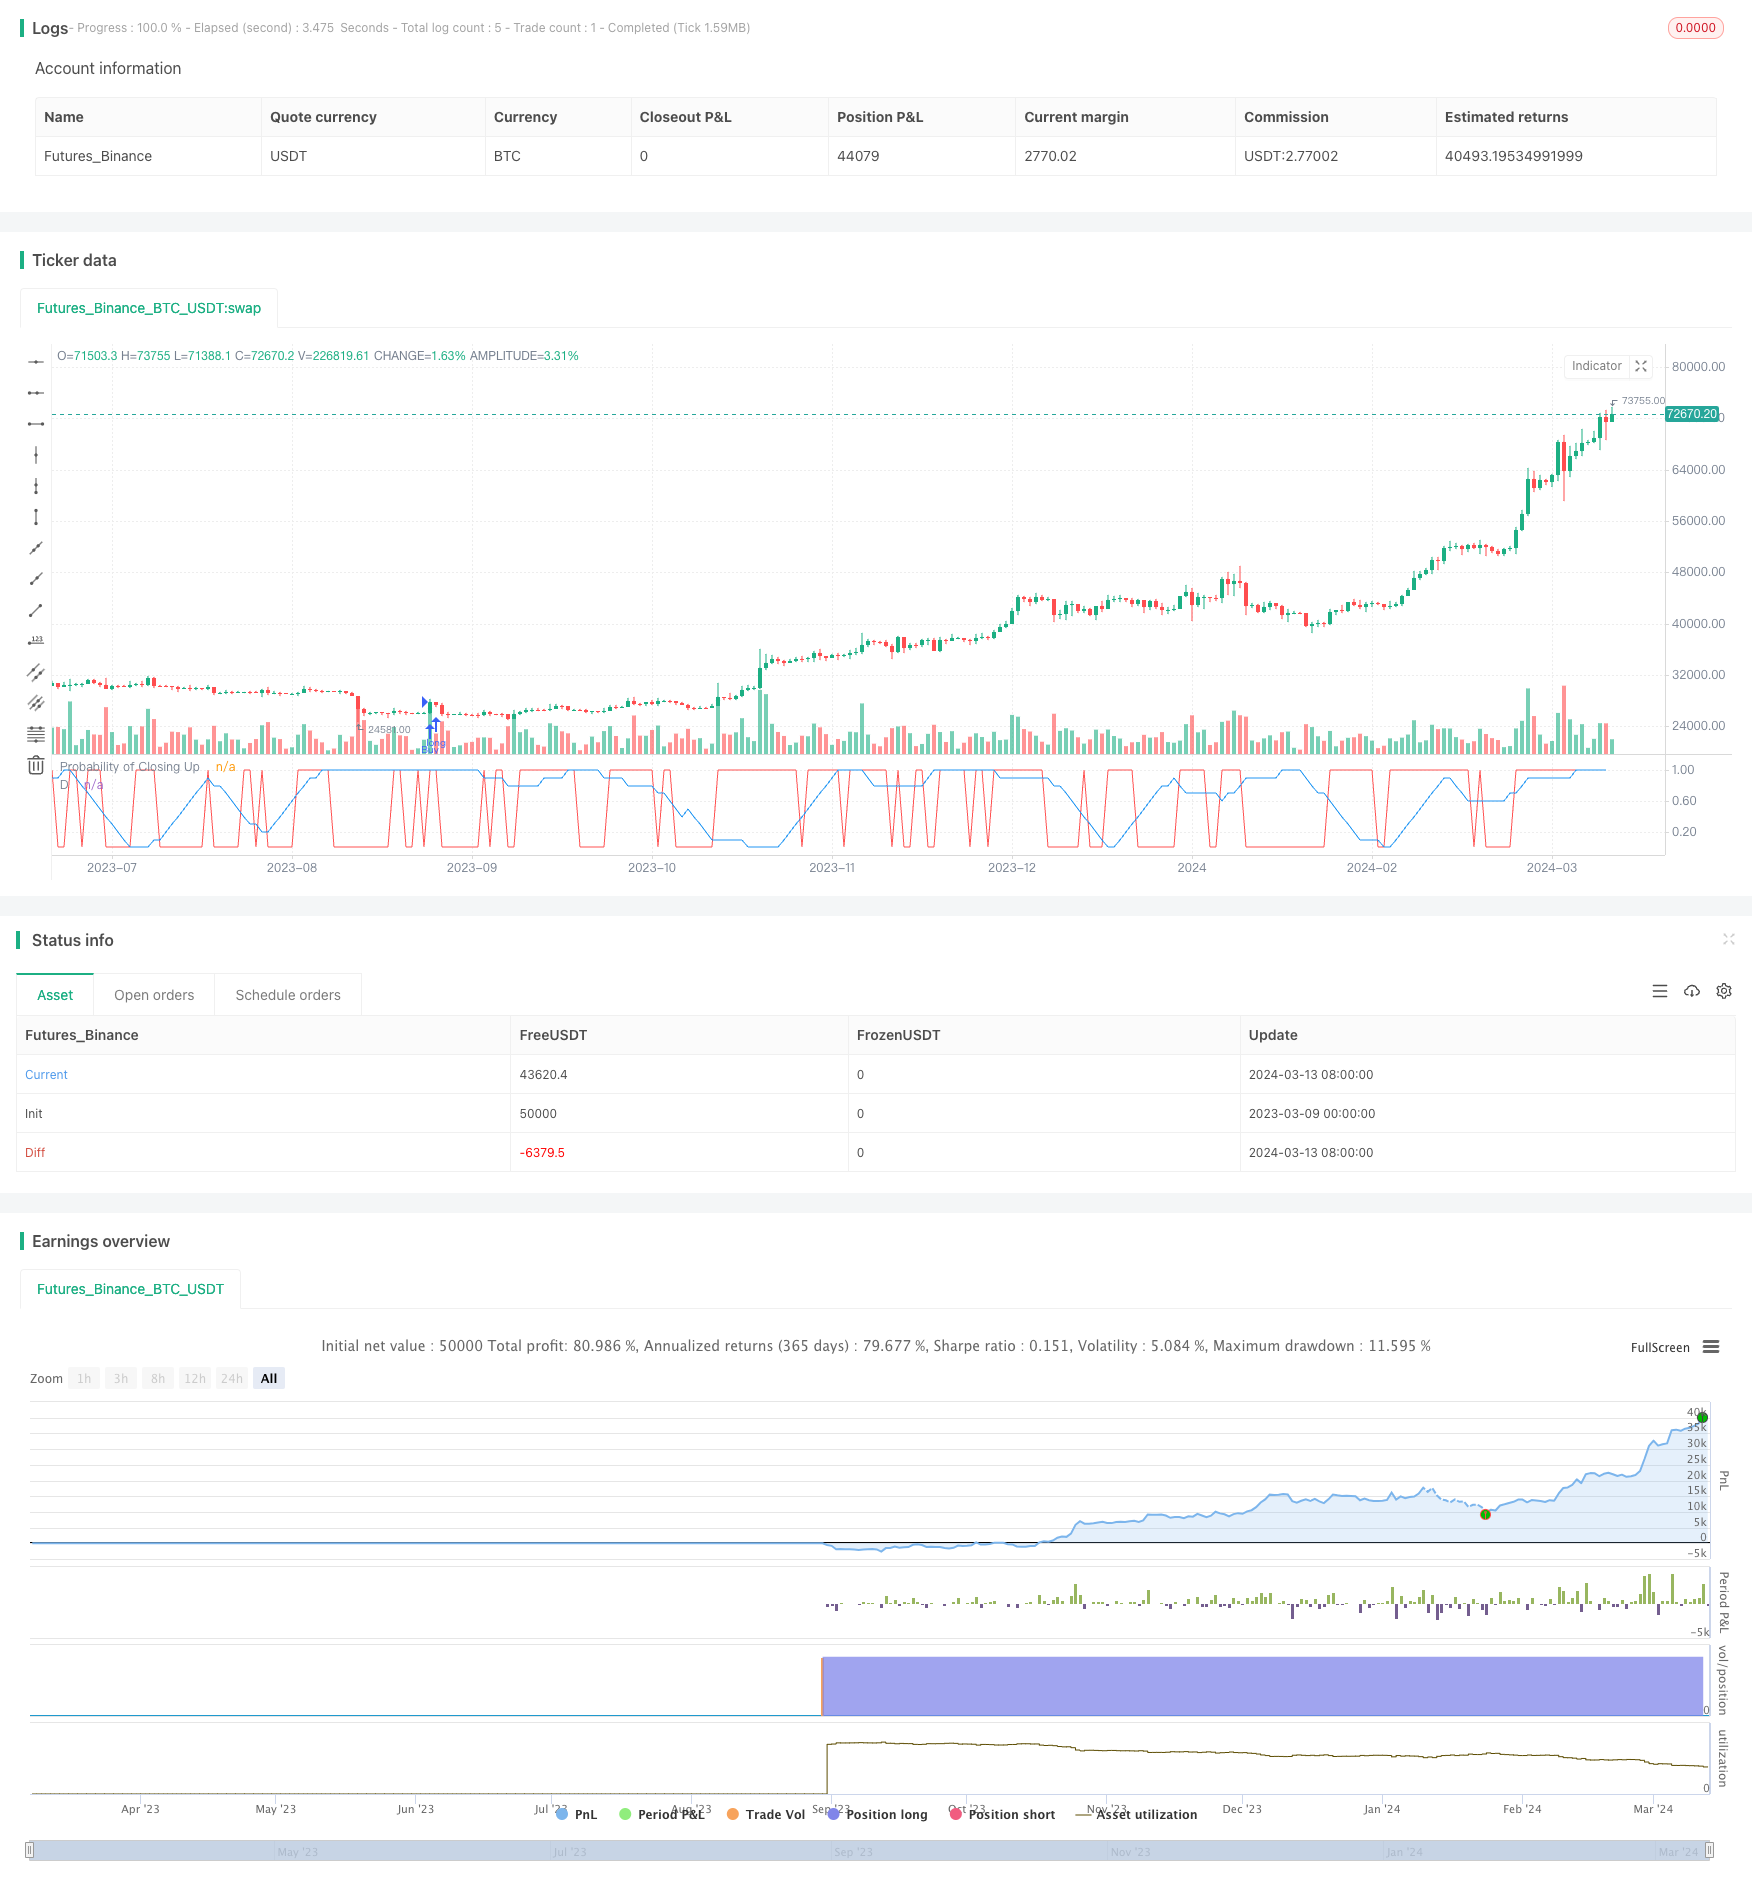
AI趋势预测交易策略是一种基于人工智能驱动的量化交易策略。该策略利用先进的AI算法分析市场数据,识别潜在的交易机会。通过对不同周期K线振幅的相关性分析,结合动态概率指标,实现对未来价格走势的预测,从而做出最优的交易决策。
该策略的核心原理是通过分析不同周期K线(A、B、C)的振幅差异与相关性,预测未来一定周期(future_length)内收盘价的概率。具体步骤如下:
-
计算A、B、C三种不同周期K线的收盘价。其中,A为当前收盘价,B为长周期(length_B)移动平均线,C为中周期(length_C)移动平均线。
-
计算A、B、C三种K线的振幅差异(最高价-最低价)。
-
计算C周期K线振幅差异的移动平均值(C_avg_diff)。
-
计算C周期K线振幅差异与前一周期振幅差异的相关性系数(correlation)。
-
根据相关性系数大于0的条件,生成动态概率指标(probability)。
-
计算动态概率指标的中周期移动平均值(D)。
-
获取未来一定周期(future_length)的收盘价(future_close),并根据当前收盘价与未来收盘价的大小关系,生成未来收盘价上涨概率(probability_up)。
-
当D大于0.51且当前收盘价上穿B周期均线时,进行买入操作;当D小于0.51且当前收盘价下穿B周期均线时,进行卖出操作。
通过以上步骤,该策略能够根据不同周期K线振幅差异的相关性,结合动态概率指标,预测未来价格走势,并根据预测结果进行买卖操作,以期获取最佳收益。
-
利用AI算法,充分挖掘市场数据中蕴含的规律和趋势,提高预测准确性。
-
采用多周期K线分析,综合考虑不同时间尺度的价格振幅特征,增强策略的适应性和稳健性。
-
引入动态概率指标,根据市场状态的变化动态调整交易信号,提高策略的灵活性。
-
设置风险管理机制,严格控制交易风险,保障资金安全。
-
参数优化,针对不同市场环境和交易品种,调整策略参数,发挥策略的最大潜力。
-
市场风险:金融市场的不确定性和波动性可能导致策略面临损失风险。解决方法:设置合理的止损止盈机制,控制单笔交易风险敞口。
-
参数风险:不恰当的参数设置可能影响策略表现。解决方法:对策略进行严格的回测和参数优化,选择最优参数组合。
-
过拟合风险:策略在训练数据上表现良好,但在实际交易中无法复现。解决方法:采用交叉验证等方法,评估策略的泛化能力,防止过拟合。
-
未知风险:AI模型可能存在未知的缺陷或局限性。解决方法:持续监控和评估策略表现,及时发现和修正潜在问题。
-
引入更多技术指标和市场特征,丰富策略的信息来源,提高预测准确性。
-
优化AI模型结构和训练方法,提高模型的学习能力和泛化能力。
-
动态调整策略参数,根据市场状态的变化实时优化策略表现。
-
加强风险管理,引入更高级的风控方法,如投资组合优化、动态止损等。
-
扩大策略的适用范围,针对不同市场和交易品种进行适配和优化。
AI趋势预测交易策略通过对多周期K线振幅差异的相关性分析,结合动态概率指标,预测未来价格走势,并据此进行交易决策。该策略充分利用AI技术挖掘市场数据中的규律和趋势,具有良好的适应性和灵活性。同时,策略重视风险管理,通过严格的参数优化和风控措施,确保资金安全。未来,该策略还可以在技术指标、AI模型、参数调优、风险管理等方面进行进一步优化,以期获得更加稳健和出色的交易表现。总之,AI趋势预测交易策略代表了量化交易领域的新方向和新思路,为投资者提供了一种智能化、自适应的交易工具,帮助他们在动荡不定的金融市场中把握机遇,实现稳健盈利。
||
The AI Trend Predictor Trading Strategy is a quantitative trading strategy driven by artificial intelligence. This strategy utilizes advanced AI algorithms to analyze market data and identify potential trading opportunities. By analyzing the correlation of K-line amplitude differences across different time periods and combining dynamic probability indicators, it predicts future price trends and makes optimal trading decisions.
The core principle of this strategy is to predict the probability of future closing prices within a certain period (future_length) by analyzing the amplitude differences and correlations of K-lines across different time periods (A, B, C). The specific steps are as follows:
-
Calculate the closing prices of three different K-line periods: A, B, and C. A represents the current closing price, B represents the long-period (length_B) moving average, and C represents the medium-period (length_C) moving average.
-
Calculate the amplitude differences (highest price - lowest price) of the three K-line periods: A, B, and C.
-
Calculate the moving average value (C_avg_diff) of the amplitude differences in the C period.
-
Calculate the correlation coefficient (correlation) between the amplitude differences of the current C period and the previous C period.
-
Generate a dynamic probability indicator (probability) based on the condition that the correlation coefficient is greater than 0.
-
Calculate the medium-period moving average value (D) of the dynamic probability indicator.
-
Obtain the closing price (future_close) of a certain future period (future_length) and generate the probability of the future closing price rising (probability_up) based on the relationship between the current closing price and the future closing price.
-
When D is greater than 0.51 and the current closing price crosses above the B-period moving average, execute a buy operation; when D is less than 0.51 and the current closing price crosses below the B-period moving average, execute a sell operation.
Through the above steps, this strategy can predict future price trends based on the correlation of K-line amplitude differences across different time periods, combined with dynamic probability indicators, and perform buy and sell operations based on the prediction results to obtain optimal returns.
-
Utilizes AI algorithms to fully mine the patterns and trends contained in market data, improving prediction accuracy.
-
Employs multi-period K-line analysis to comprehensively consider price amplitude characteristics at different time scales, enhancing the adaptability and robustness of the strategy.
-
Introduces dynamic probability indicators to dynamically adjust trading signals based on changes in market conditions, increasing the flexibility of the strategy.
-
Establishes risk management mechanisms to strictly control trading risks and ensure capital safety.
-
Optimizes parameters to adjust strategy parameters for different market environments and trading instruments, maximizing the potential of the strategy.
-
Market Risk: The uncertainty and volatility of financial markets may expose the strategy to the risk of losses. Solution: Set reasonable stop-loss and take-profit mechanisms to control the risk exposure of individual trades.
-
Parameter Risk: Improper parameter settings may affect the performance of the strategy. Solution: Conduct rigorous backtesting and parameter optimization to select the optimal parameter combination.
-
Overfitting Risk: The strategy performs well on training data but fails to replicate the performance in actual trading. Solution: Use methods such as cross-validation to assess the generalization ability of the strategy and prevent overfitting.
-
Unknown Risks: AI models may have unknown defects or limitations. Solution: Continuously monitor and evaluate the performance of the strategy to promptly identify and correct potential issues.
-
Introduce more technical indicators and market features to enrich the information sources of the strategy and improve prediction accuracy.
-
Optimize the structure and training methods of the AI model to enhance its learning ability and generalization ability.
-
Dynamically adjust strategy parameters to optimize strategy performance in real-time based on changes in market conditions.
-
Strengthen risk management by introducing more advanced risk control methods, such as portfolio optimization and dynamic stop-loss.
-
Expand the applicability of the strategy by adapting and optimizing it for different markets and trading instruments.
The AI Trend Predictor Trading Strategy predicts future price trends by analyzing the correlation of K-line amplitude differences across multiple time periods and combining dynamic probability indicators to make trading decisions. This strategy fully utilizes AI technology to mine patterns and trends in market data, demonstrating good adaptability and flexibility. At the same time, the strategy emphasizes risk management and ensures capital safety through rigorous parameter optimization and risk control measures. In the future, this strategy can be further optimized in terms of technical indicators, AI models, parameter tuning, risk management, and other aspects to achieve more robust and outstanding trading performance. In summary, the AI Trend Predictor Trading Strategy represents a new direction and approach in the field of quantitative trading, providing investors with an intelligent and adaptive trading tool that helps them seize opportunities and achieve steady profits in the volatile financial market. [/trans]
Strategy Arguments
| Argument | Default | Description |
|---|---|---|
| v_input_1 | 24 | Length of K-line A |
| v_input_2 | 192 | Length of K-line B |
| v_input_3 | 10 | Length of K-line C |
| v_input_4 | 5 | Length of future K-line |
Source (PineScript)
/*backtest
start: 2023-03-09 00:00:00
end: 2024-03-14 00:00:00
period: 1d
basePeriod: 1h
exchanges: [{"eid":"Futures_Binance","currency":"BTC_USDT"}]
*/

//@version=5
strategy('AI Trend Predictor', overlay=false)


length_A = input(24, title='Length of K-line A')
length_B = input(192, title='Length of K-line B')
length_C = input(10, title='Length of K-line C')
future_length = input(5, title='Length of future K-line')


A_close = close
B_close = ta.sma(close, length_B)
C_close = ta.sma(B_close, length_C)


A_diff = high - low
B_diff = high - low
C_diff = high - low


C_avg_diff = ta.sma(C_diff, length_C)


correlation = ta.correlation(C_diff, C_diff[1], length_C)


probability = correlation > 0 ? 1 : 0


D = ta.sma(probability, length_C)


future_close = close[future_length]
probability_up = close > future_close ? 1 : 0


plot(D, color=color.new(color.blue, 0), title='D')
plot(probability_up, color=color.new(color.red, 0), title='Probability of Closing Up')


strategy.entry('Buy', strategy.long, when=D > 0.51 and ta.crossover(close, B_close))
strategy.entry('Sell', strategy.short, when=D < 0.51 and ta.crossunder(close, B_close))
Detail
https://www.fmz.com/strategy/444973
Last Modified
2024-03-15 16:06:00