Name
ATR动态趋势跟踪与均线交叉交易策略-ATR-Dynamic-Trend-Following-and-EMA-Crossover-Trading-Strategy
Author
ianzeng123
Strategy Description
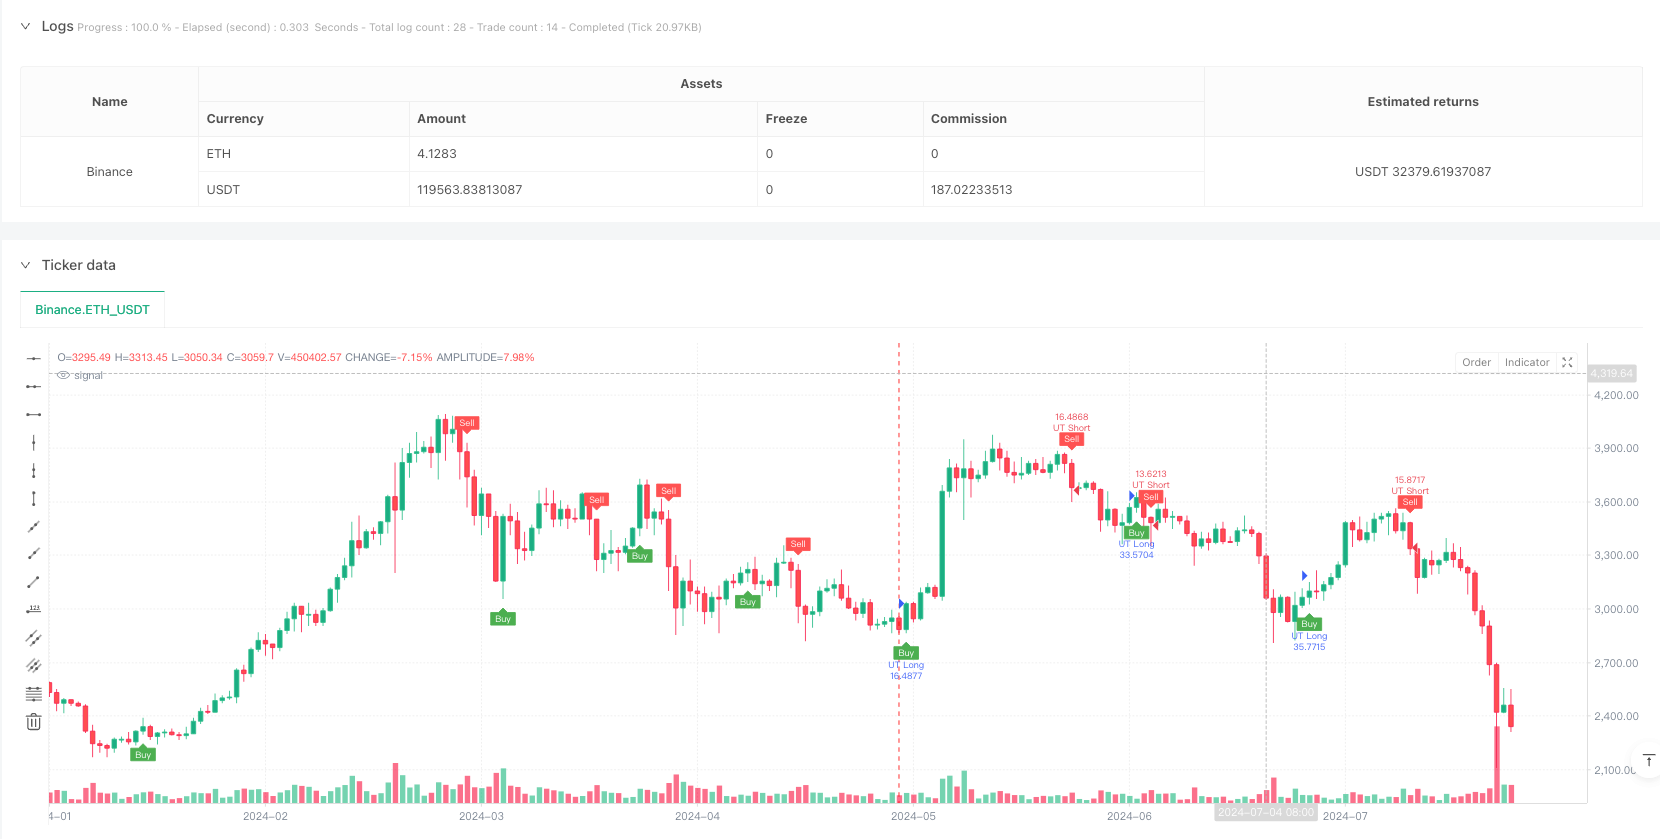
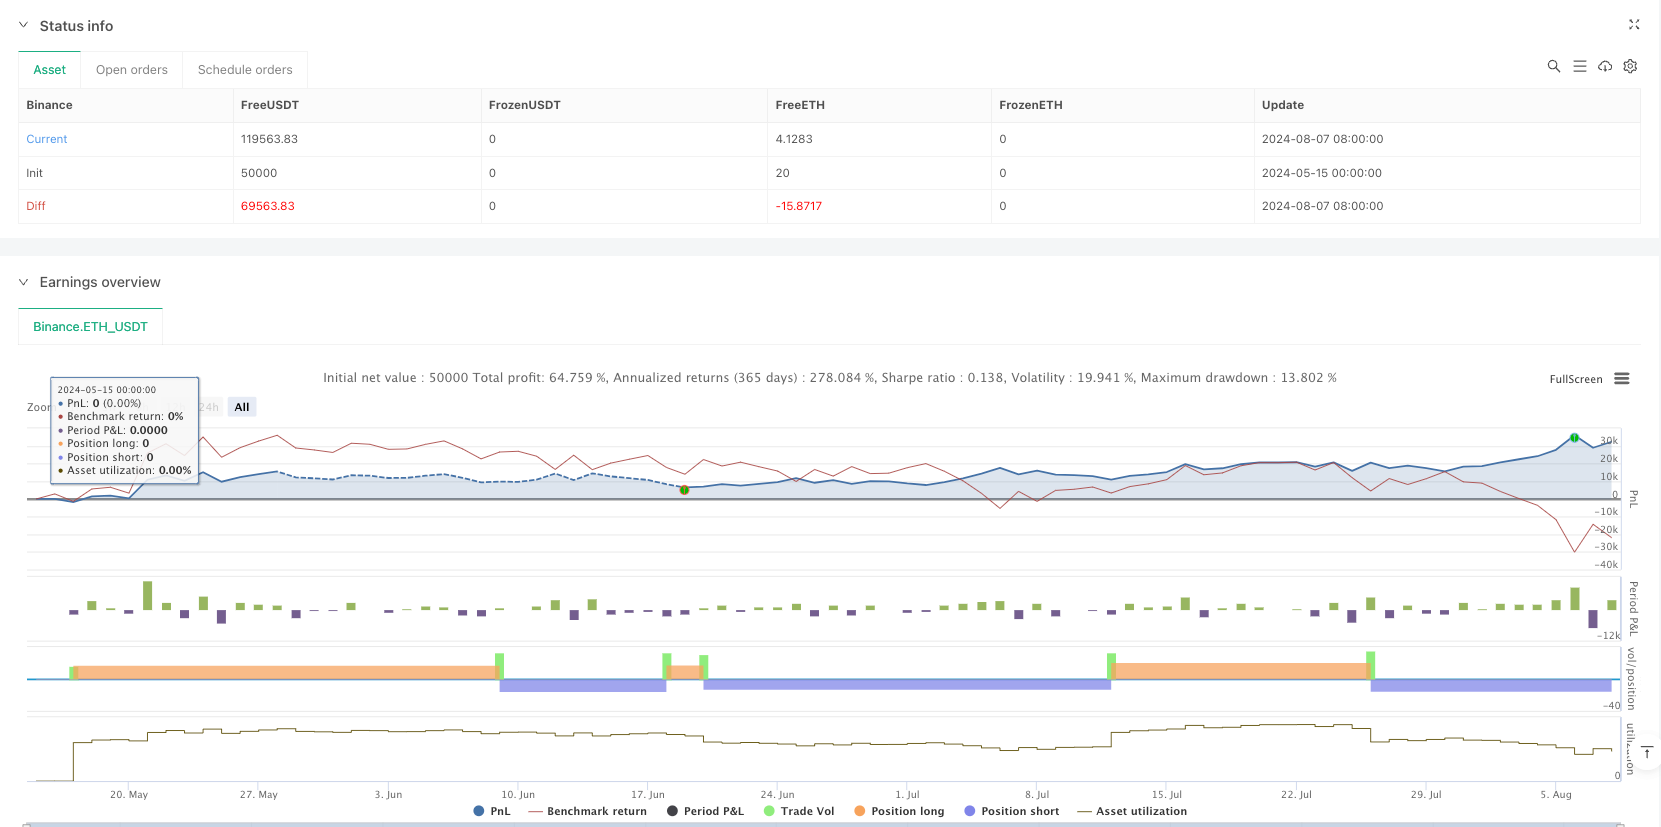
[trans]
这是一个基于ATR(平均真实范围)指标的趋势跟踪策略,结合了动态止损和均线交叉信号。该策略通过计算ATR来确定市场波动性,并利用这个信息建立动态的跟踪止损线。当价格与EMA(指数移动平均线)突破ATR跟踪止损线时,产生交易信号。策略还提供了使用普通K线或平安K线进行计算的选项,增加了策略的灵活性。
策略的核心逻辑基于以下几个关键计算:
- 使用ATR指标测量市场波动性,周期可调
- 基于ATR值计算动态止损距离,通过敏感度参数a进行调整
- 构建ATR跟踪止损线,该线随着价格移动而动态调整
- 使用1周期EMA与ATR跟踪止损线的交叉来确定交易信号
- 当EMA向上突破ATR跟踪止损线时开多,向下突破时开空
- 可选择使用普通收盘价或平安K线的HLC3价格作为计算基准
- 动态适应性强:ATR跟踪止损能根据市场波动性自动调整,使策略在不同市场环境下都能保持稳定性
- 风险控制完善:通过动态止损线实现了对头寸的持续保护
- 参数可调性好:可以通过调整ATR周期和敏感度来适应不同市场特征
- 信号明确可靠:结合均线交叉提供了清晰的入场出场信号
- 计算逻辑简洁:策略逻辑清晰,易于理解和维护
- 可视化效果好:提供了交易信号和趋势的图形展示
- 震荡市场风险:在横盘震荡市场可能产生频繁的假突破信号
- 滑点影响:快速行情下可能面临较大滑点,影响策略表现
- 参数敏感性:不同参数组合可能导致策略表现差异较大
- 趋势依赖性:策略在非趋势市场的表现可能不够理想
- 止损幅度:ATR值异常时可能导致止损位置不合理
- 增加趋势过滤器:引入额外的趋势判断指标,减少震荡市假信号
- 优化参数自适应:开发自动优化ATR周期和敏感度的机制
- 改进信号确认:增加成交量或其他技术指标作为信号确认
- 完善止损机制:在ATR基础上增加固定止损和移动止损的配合
- 增加仓位管理:根据市场波动性动态调整持仓规模
这是一个结合了动态跟踪止损和均线系统的完整交易策略。通过ATR指标捕捉市场波动特征,利用均线交叉提供交易信号,形成了一个逻辑严密的交易系统。策略的优势在于其动态适应性和风险控制能力,但也需要注意在横盘市场的表现。通过建议的优化方向,策略还有进一步提升的空间。 ||
This is a trend following strategy based on the ATR (Average True Range) indicator, combining dynamic stop-loss and EMA crossover signals. The strategy calculates ATR to determine market volatility and uses this information to establish a dynamic trailing stop line. Trading signals are generated when price and EMA (Exponential Moving Average) break through the ATR trailing stop line. The strategy also offers the option to use regular or Heikin Ashi candles for calculations, adding flexibility.
The core logic of the strategy is based on the following key calculations:
- Using ATR indicator to measure market volatility with adjustable period
- Calculating dynamic stop-loss distance based on ATR value, adjusted by sensitivity parameter a
- Building ATR trailing stop line that dynamically adjusts with price movement
- Using 1-period EMA crossover with ATR trailing stop line to determine trading signals
- Opening long positions when EMA breaks above ATR trailing stop line, short when breaking below
- Option to use regular closing price or Heikin Ashi HLC3 price as calculation basis
- Strong Dynamic Adaptability: ATR trailing stop automatically adjusts to market volatility, maintaining strategy stability in different market conditions
- Comprehensive Risk Control: Continuous position protection through dynamic stop-loss line
- Good Parameter Adjustability: Can adapt to different market characteristics by adjusting ATR period and sensitivity
- Clear and Reliable Signals: Provides clear entry and exit signals through EMA crossover
- Concise Calculation Logic: Clear strategy logic, easy to understand and maintain
- Good Visualization: Provides graphical display of trading signals and trends
- Choppy Market Risk: May generate frequent false breakout signals in sideways markets
- Slippage Impact: May face significant slippage in fast markets, affecting strategy performance
- Parameter Sensitivity: Different parameter combinations may lead to large performance variations
- Trend Dependency: Strategy may not perform well in non-trending markets
- Stop-Loss Range: Abnormal ATR values may lead to unreasonable stop-loss positions
- Add Trend Filter: Introduce additional trend judgment indicators to reduce false signals in choppy markets
- Optimize Parameter Adaptation: Develop mechanism to automatically optimize ATR period and sensitivity
- Improve Signal Confirmation: Add volume or other technical indicators for signal confirmation
- Enhance Stop-Loss Mechanism: Combine fixed and trailing stops with ATR-based stops
- Add Position Management: Dynamically adjust position size based on market volatility
This is a complete trading strategy combining dynamic trailing stops and moving average systems. It captures market volatility characteristics through the ATR indicator and provides trading signals using EMA crossover, forming a logically rigorous trading system. The strategy's strengths lie in its dynamic adaptability and risk control capabilities, but attention needs to be paid to its performance in sideways markets. Through the suggested optimization directions, there is room for further improvement of the strategy.[/trans]
Source (PineScript)
/*backtest
start: 2024-05-15 00:00:00
end: 2024-08-08 00:00:00
period: 1d
basePeriod: 1d
exchanges: [{"eid":"Binance","currency":"ETH_USDT"}]
*/

//@version=6
strategy(title="UT Bot Strategy", overlay=true, default_qty_type=strategy.percent_of_equity, default_qty_value=100)

// Inputs
a = input.float(1, title="Key Value. 'This changes the sensitivity'")
c = input.int(10, title="ATR Period")
h = input.bool(false, title="Signals from Heikin Ashi Candles")

// Calculate ATR
xATR = ta.atr(c)
nLoss = a * xATR

// Source for calculations
src = h ? request.security(syminfo.tickerid, timeframe.period, hlc3) : close

// ATR Trailing Stop logic
var float xATRTrailingStop = na
if (not na(xATRTrailingStop[1]) and src > xATRTrailingStop[1] and src[1] > xATRTrailingStop[1])
    xATRTrailingStop := math.max(xATRTrailingStop[1], src - nLoss)
else if (not na(xATRTrailingStop[1]) and src < xATRTrailingStop[1] and src[1] < xATRTrailingStop[1])
    xATRTrailingStop := math.min(xATRTrailingStop[1], src + nLoss)
else
    xATRTrailingStop := src > xATRTrailingStop[1] ? src - nLoss : src + nLoss

// Position logic
var int pos = 0
if (not na(xATRTrailingStop[1]) and src[1] < xATRTrailingStop[1] and src > xATRTrailingStop[1])
    pos := 1
else if (not na(xATRTrailingStop[1]) and src[1] > xATRTrailingStop[1] and src < xATRTrailingStop[1])
    pos := -1
else
    pos := pos[1]

xcolor = pos == -1 ? color.red : pos == 1 ? color.green : color.blue

// Entry and Exit Signals
ema = ta.ema(src, 1)
above = ta.crossover(ema, xATRTrailingStop)
below = ta.crossover(xATRTrailingStop, ema)

buy = src > xATRTrailingStop and above
sell = src < xATRTrailingStop and below

// Strategy Execution
if (buy)
    strategy.entry("UT Long", strategy.long)
if (sell)
    strategy.entry("UT Short", strategy.short)

// Plotting and Alerts
plotshape(buy, title="Buy", text='Buy', style=shape.labelup, location=location.belowbar, color=color.green, textcolor=color.white, size=size.tiny)
plotshape(sell, title="Sell", text='Sell', style=shape.labeldown, location=location.abovebar, color=color.red, textcolor=color.white, size=size.tiny)

barcolor(src > xATRTrailingStop ? color.green : src < xATRTrailingStop ? color.red : na)

alertcondition(buy, title="UT Long", message="UT Long")
alertcondition(sell, title="UT Short", message="UT Short")
Detail
https://www.fmz.com/strategy/483117
Last Modified
2025-02-27 16:57:27