Name
ATR动态趋势跟踪与重入场交易策略-ATR-Dynamic-Trend-Following-with-Re-entry-Trading-Strategy
Author
ChaoZhang
Strategy Description
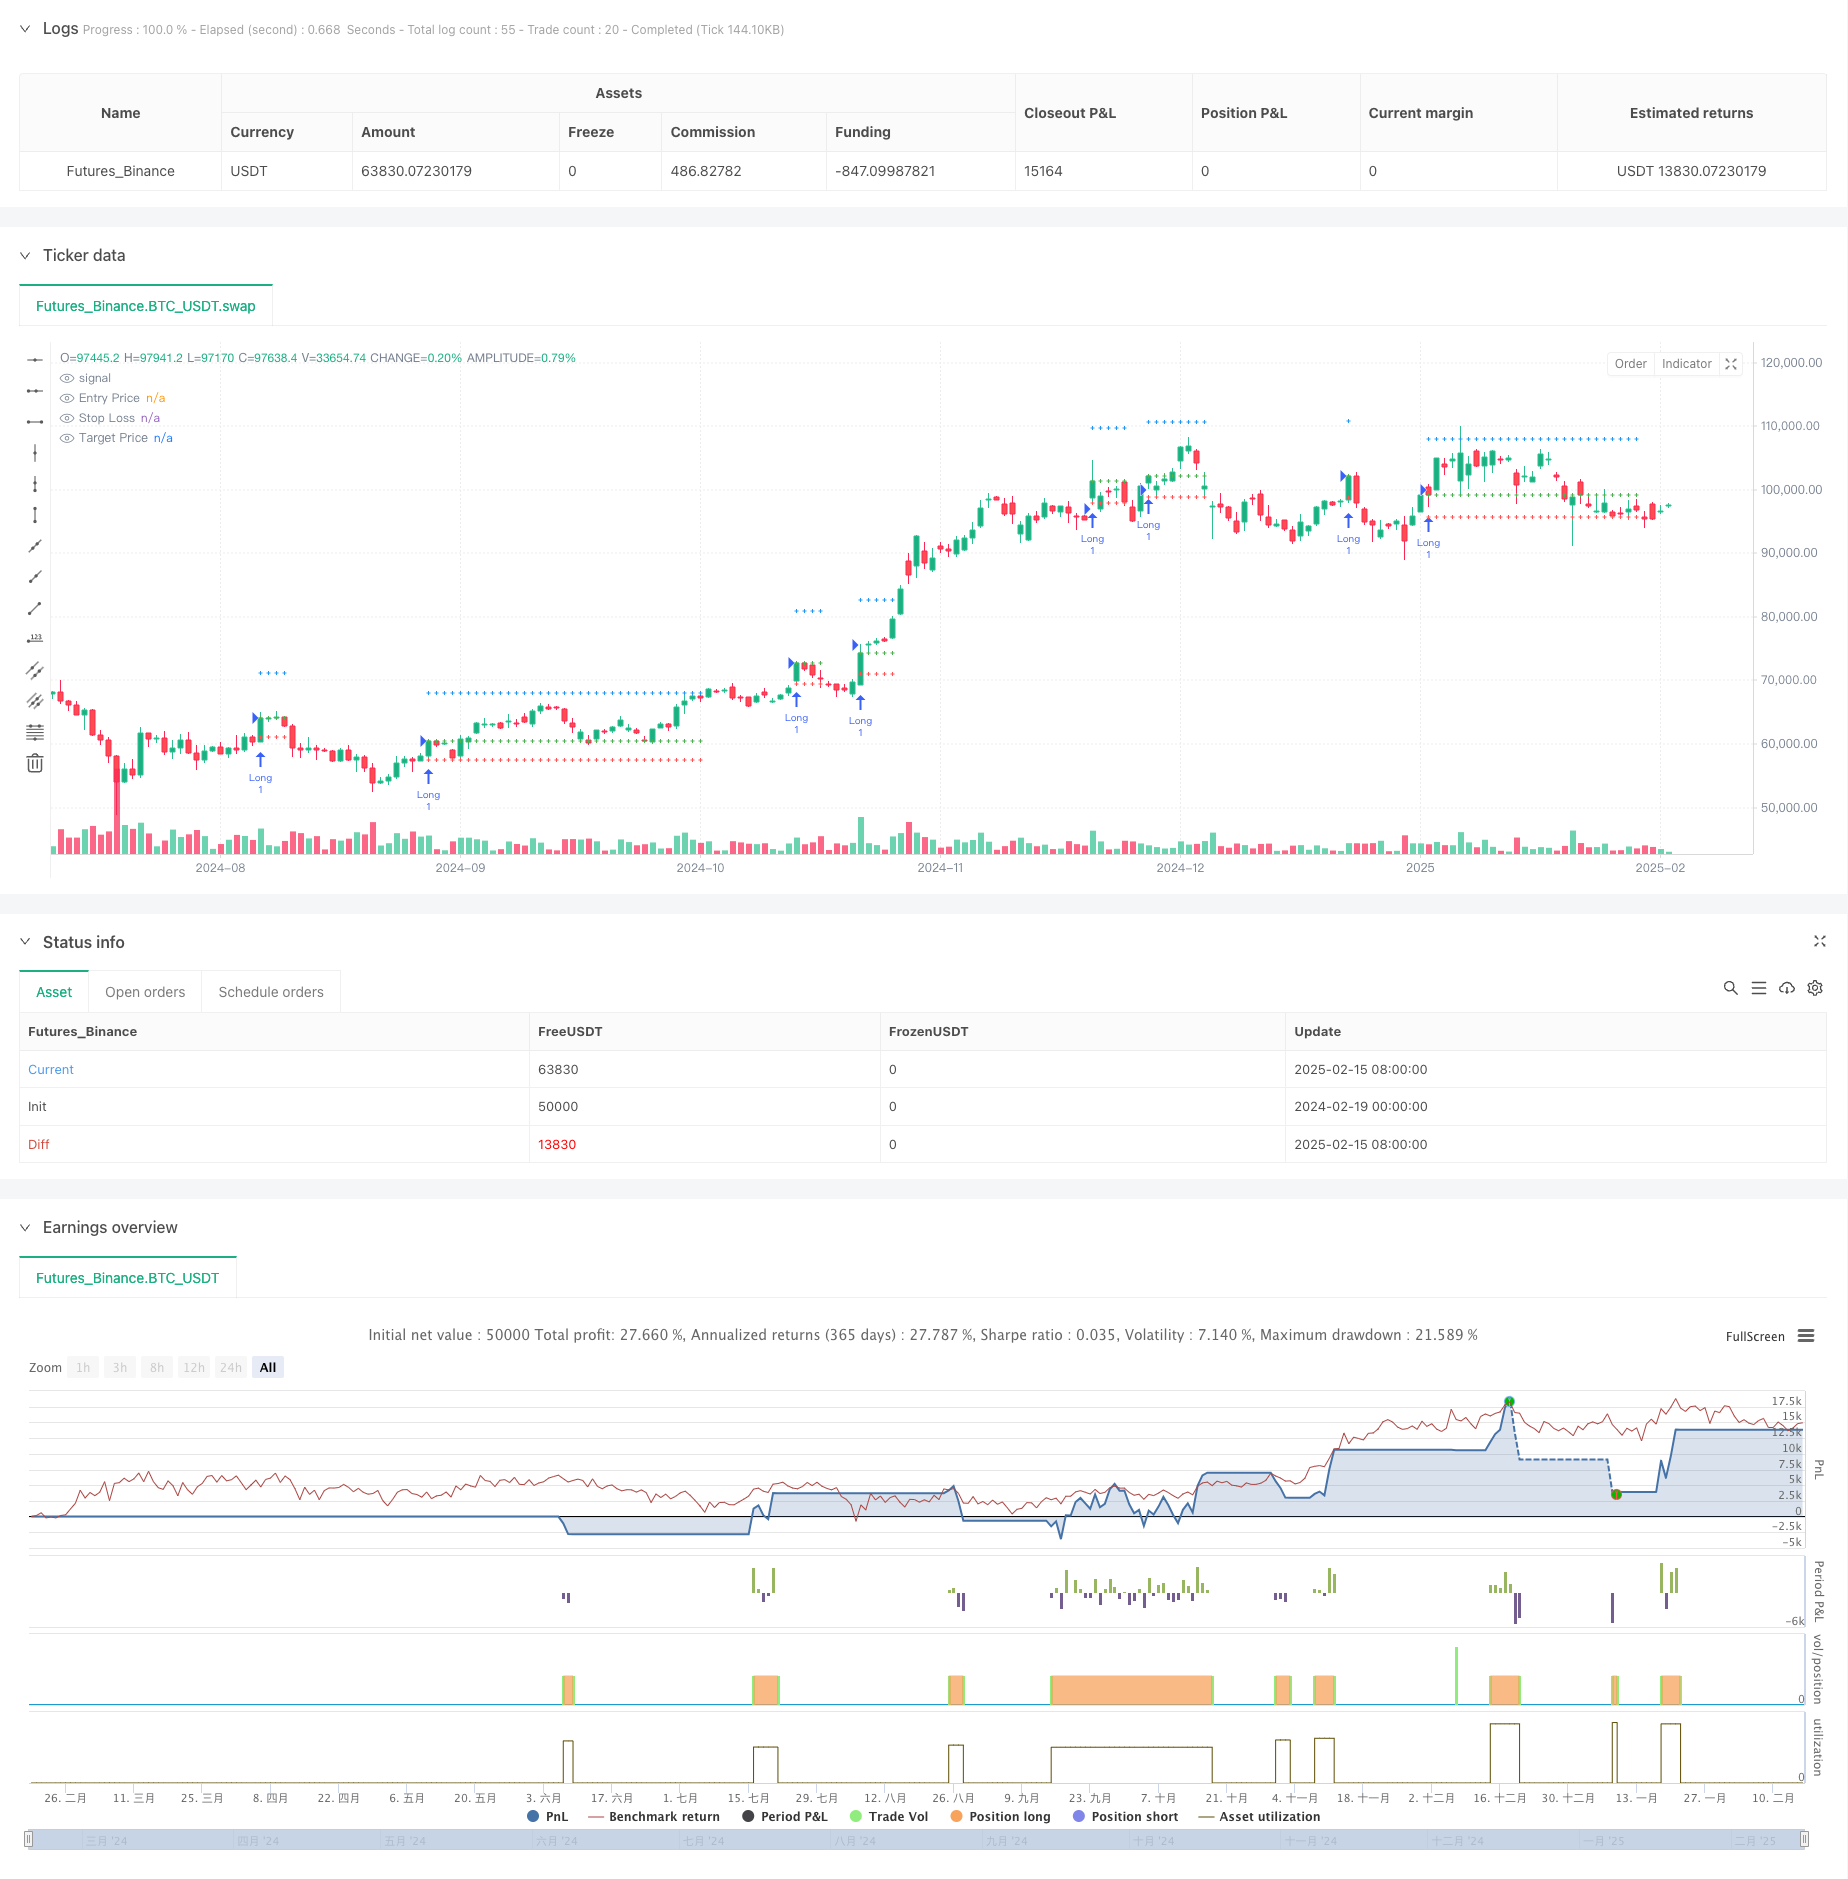
[trans]
这是一个基于ATR动态调整的趋势跟踪策略,结合了移动平均线和ATR指标来确定入场和出场点。该策略的核心特点是通过ATR动态调整移动平均线的上下轨道,在价格突破上轨时入场做多,并设置基于ATR倍数的止损和止盈点。同时,策略还包含了创新的重入场机制,当价格回调至入场点时允许重新建仓。
策略运作基于以下几个关键要素:
- 使用ATR调整后的移动平均线作为趋势判断依据,形成动态的上下轨道
- 当价格突破上轨时产生做多信号,入场价格为当前收盘价
- 止损位设置为入场价下方2倍ATR距离
- 止盈位设置为入场价上方(5+自定义倍数)×ATR距离
- 在止损或止盈触发后,如果价格回调至原入场价位,策略将自动重新入场
- 使用最大30根K线的显示限制来优化图表展示
- 动态适应性强:通过ATR调整的移动平均线能够自适应市场波动率变化
- 风险管理科学:止损和止盈点基于ATR动态设置,符合市场波动特征
- 重入场机制创新:允许在价格回调至有利位置时重新入场,提高盈利机会
- 可视化效果优秀:策略提供清晰的入场、止损、止盈线条显示,便于交易监控
- 参数灵活可调:通过输入参数可以调整趋势判断周期和止盈倍数
- 趋势反转风险:在震荡市场中可能频繁触发止损
- 重入场风险:价格回调至入场点重新建仓可能面临连续止损
- 滑点风险:在波动剧烈时期,实际成交价格可能与信号价格存在偏差
- 参数敏感性:不同市场条件下最优参数可能变化较大
- 计算负载:需要实时计算多个技术指标,可能增加系统负载
- 引入市场环境过滤:可添加波动率过滤器,在高波动期间调整策略参数或暂停交易
- 优化重入场逻辑:可考虑在重入场时采用更严格的条件限制,如趋势确认指标
- 完善止盈机制:可实现移动止损功能,在趋势延续时保护更多利润
- 增加时间过滤:可添加交易时间段限制,避开低流动性期间
- 优化计算效率:可通过减少不必要的计算和绘图来提升策略运行效率
这是一个设计合理、逻辑清晰的趋势跟踪策略,通过ATR动态调整提供了良好的市场适应性。策略的重入场机制是一个创新点,能够在良好的市场条件下提供额外的盈利机会。虽然存在一些需要注意的风险点,但通过建议的优化方向可以进一步提升策略的稳定性和盈利能力。对于寻求系统化交易方法的投资者来说,这是一个值得考虑的基础策略框架。 ||
This is a trend-following strategy that dynamically adjusts using ATR, combining moving averages and ATR indicators to determine entry and exit points. The strategy's core feature is using ATR to dynamically adjust moving average bands, entering long positions when price breaks above the upper band, and setting stop-loss and take-profit levels based on ATR multiples. Additionally, the strategy includes an innovative re-entry mechanism allowing new positions when price retraces to the entry point.
The strategy operates based on the following key elements:
- Uses ATR-adjusted moving averages as trend indicators, forming dynamic upper and lower bands
- Generates long entry signals when price breaks above the upper band, with entry price at current close
- Sets stop-loss at 2×ATR below entry price
- Sets take-profit at (5+custom multiplier)×ATR above entry price
- Automatically re-enters positions if price retraces to original entry level after stop-loss or take-profit
- Implements 30-bar maximum display limit for optimized chart visualization
- Strong Dynamic Adaptability: ATR-adjusted moving averages self-adapt to market volatility changes
- Scientific Risk Management: Stop-loss and take-profit levels dynamically set based on ATR, matching market volatility characteristics
- Innovative Re-entry Mechanism: Allows re-entry at favorable price levels, increasing profit opportunities
- Excellent Visualization: Provides clear entry, stop-loss, and take-profit line displays for trade monitoring
- Flexible Parameters: Adjustable trend period and take-profit multiplier through input parameters
- Trend Reversal Risk: Frequent stop-losses possible in ranging markets
- Re-entry Risk: Consecutive stop-losses possible when re-entering at previous entry points
- Slippage Risk: Actual execution prices may deviate from signal prices during high volatility
- Parameter Sensitivity: Optimal parameters may vary significantly across different market conditions
- Computational Load: Real-time calculation of multiple technical indicators may increase system load
- Implement Market Environment Filters: Add volatility filters to adjust parameters or pause trading during high volatility
- Optimize Re-entry Logic: Consider stricter conditions for re-entry, such as trend confirmation indicators
- Enhance Profit Taking: Implement trailing stops to protect more profits in trending markets
- Add Time Filters: Implement trading time restrictions to avoid low liquidity periods
- Improve Calculation Efficiency: Reduce unnecessary calculations and plotting to enhance strategy performance
This is a well-designed, logically clear trend-following strategy with good market adaptability through ATR dynamic adjustment. The re-entry mechanism is an innovative feature that can provide additional profit opportunities under favorable market conditions. While there are some risk factors to consider, the suggested optimization directions can further enhance the strategy's stability and profitability. For investors seeking systematic trading methods, this represents a worthwhile basic strategy framework.[/trans]
Source (PineScript)
/*backtest
start: 2024-02-19 00:00:00
end: 2025-02-16 08:00:00
period: 1d
basePeriod: 1d
exchanges: [{"eid":"Futures_Binance","currency":"BTC_USDT"}]
*/

//@version=6
strategy("KON SET By Sai", overlay=true, max_lines_count=40)

// INPUTS
length = input.int(10, "Trend Length")
target_multiplier = input.int(0, "Set Targets") // Target adjustment
max_bars = 30  // Number of bars to display the lines after signal

// VARIABLES
var bool inTrade = false
var float entryPrice = na
var float stopLoss = na
var float targetPrice = na
var int barCount = na  // Counter to track how many bars have passed since signal

// ATR for stop-loss and target calculation
atr_value = ta.sma(ta.atr(200), 200) * 0.8

// Moving averages for trend detection
sma_high = ta.sma(high, length) + atr_value
sma_low = ta.sma(low, length) - atr_value

// Signal conditions for trend changes
signal_up = ta.crossover(close, sma_high)
signal_down = ta.crossunder(close, sma_low)

// Entry conditions
if not inTrade and signal_up
    entryPrice := close
    stopLoss := close - atr_value * 2
    targetPrice := close + atr_value * (5 + target_multiplier)
    strategy.entry("Long", strategy.long)
    strategy.exit("Exit Long", "Long", stop=stopLoss, limit=targetPrice)
    inTrade := true
    barCount := 0  // Reset bar count when signal occurs

// Exit conditions
if inTrade and (close <= stopLoss or close >= targetPrice)
    inTrade := false
    entryPrice := na
    stopLoss := na
    targetPrice := na
    barCount := na  // Reset bar count on exit

// Re-entry logic
if not inTrade and close == entryPrice
    entryPrice := close
    stopLoss := close - atr_value * 2
    targetPrice := close + atr_value * (5 + target_multiplier)
    strategy.entry("Re-Long", strategy.long)
    strategy.exit("Re-Exit Long", "Re-Long", stop=stopLoss, limit=targetPrice)
    inTrade := true
    barCount := 0  // Reset bar count when re-entry happens

// Count bars since the signal appeared (max 30 bars)
if inTrade and barCount < max_bars
    barCount := barCount + 1

// Plotting lines for entry, stop-loss, and targets (Only during active trade and within max_bars)
entry_line = plot(inTrade and barCount <= max_bars ? entryPrice : na, title="Entry Price", color=color.new(color.green, 0), linewidth=1, style=plot.style_cross)
sl_line = plot(inTrade and barCount <= max_bars ? stopLoss : na, title="Stop Loss", color=color.new(color.red, 0), linewidth=1, style=plot.style_cross)
target_line = plot(inTrade and barCount <= max_bars ? targetPrice : na, title="Target Price", color=color.new(color.blue, 0), linewidth=1, style=plot.style_cross)

// Background color between entry and target/stop-loss (Only when inTrade and within max_bars)
fill(entry_line, target_line, color=color.new(color.green, 90), title="Target Zone")
fill(entry_line, sl_line, color=color.new(color.red, 90), title="Stop-Loss Zone")

// Label updates (reduce overlap and clutter)
if bar_index % 50 == 0 and inTrade and barCount <= max_bars  // Adjust label frequency for performance
    label.new(bar_index + 1, entryPrice, text="Entry: " + str.tostring(entryPrice, "#.##"), style=label.style_label_left, color=color.green, textcolor=color.white, size=size.small)
    label.new(bar_index + 1, stopLoss, text="Stop Loss: " + str.tostring(stopLoss, "#.##"), style=label.style_label_left, color=color.red, textcolor=color.white, size=size.small)
    label.new(bar_index + 1, targetPrice, text="Target: " + str.tostring(targetPrice, "#.##"), style=label.style_label_left, color=color.blue, textcolor=color.white, size=size.small)
Detail
https://www.fmz.com/strategy/482457
Last Modified
2025-02-18 15:11:28