Name
ATR和交易量结合的动态信号线趋势跟踪策略-Dynamic-Signal-Line-Trend-Following-Strategy-Combining-ATR-and-Volume
Author
ChaoZhang
Strategy Description
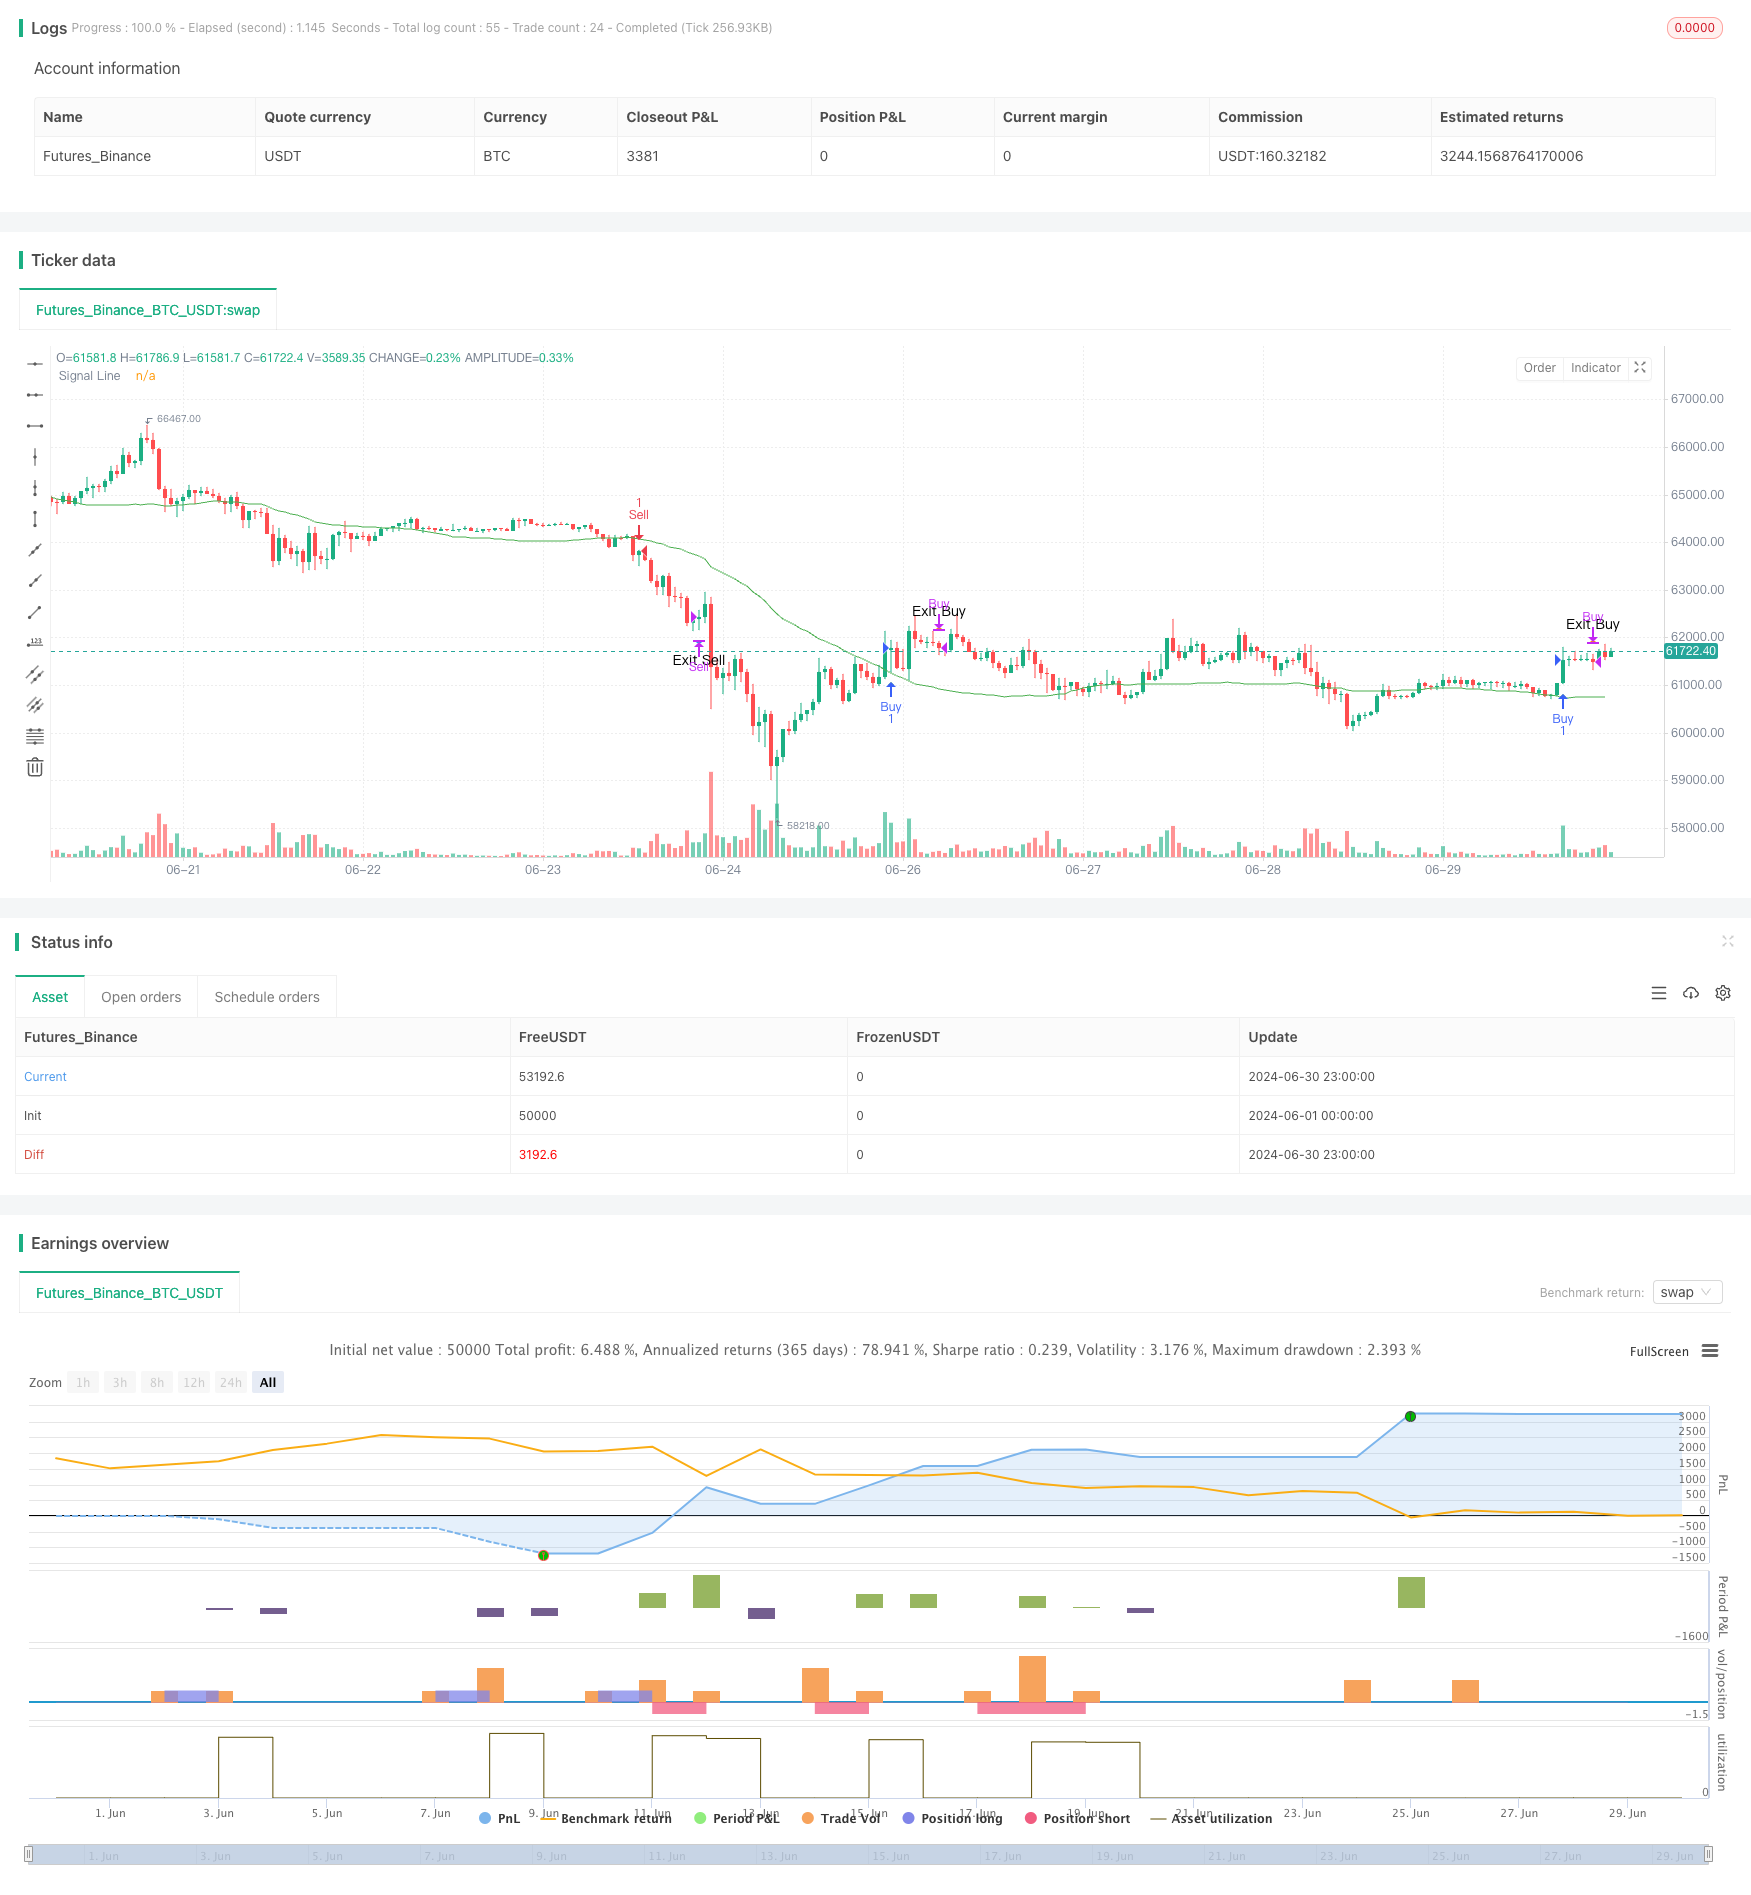
[trans]
这个策略是一个结合了简单移动平均线(SMA)、平均真实范围(ATR)和交易量的动态信号线趋势跟踪系统。它利用ATR来调整信号线的位置,并使用交易量作为确认指标。该策略旨在捕捉市场趋势,同时考虑市场波动性和交易活跃度,适用于日内交易时间框架。
-
信号线计算:
- 使用50周期的SMA作为基准线。
- 将20周期的ATR值乘以用户定义的偏移量,从SMA中减去,形成动态信号线。
-
入场条件:
- 买入:当价格的低点突破信号线上方,且当前交易量大于50周期平均交易量的1.5倍时。
- 卖出:当价格的高点跌破信号线下方,且当前交易量大于50周期平均交易量的1.5倍时。
-
出场条件:
- 多头平仓:当收盘价低于前一根K线的最低价时。
- 空头平仓:当收盘价高于前一根K线的最高价时。
-
可视化:
- 在图表上绘制信号线。
- 使用三角形标记买入、卖出和平仓信号。
-
动态适应性:通过结合SMA和ATR,信号线能够根据市场波动性动态调整,提高策略的适应性。
-
交易量确认:使用交易量作为额外的过滤条件,有助于减少虚假信号,提高交易的可靠性。
-
趋势跟踪:策略设计遵循趋势跟踪原则,有利于捕捉大趋势移动。
-
风险管理:通过设置明确的出场条件,有助于控制风险,防止过度亏损。
-
灵活性:策略参数可调,允许交易者根据不同市场条件进行优化。
-
可视化友好:通过图表标记清晰展示交易信号,便于分析和回测。
-
震荡市场风险:在横盘或震荡市场中,可能产生频繁的假突破信号,导致过度交易和佣金损失。
-
滑点风险:特别在日内交易中,高频交易可能面临严重的滑点问题,影响实际执行效果。
-
过度依赖交易量:在某些市场条件下,交易量可能不是可靠的指标,可能导致错过重要的交易机会。
-
参数敏感性:策略效果高度依赖于参数设置,不同市场和时间框架可能需要频繁调整。
-
趋势反转风险:策略可能在趋势反转初期反应较慢,导致一定的回撤。
-
多时间框架分析:引入更长时间周期的趋势判断,以提高整体趋势判断的准确性。
-
动态参数调整:开发自适应机制,根据市场状况自动调整SMA长度、ATR周期和交易量乘数。
-
增加市场状态过滤:引入波动率或趋势强度指标,在不同市场状态下采用不同的交易策略。
-
改进出场机制:考虑使用跟踪止损或基于ATR的动态止损,以更好地管理风险和锁定利润。
-
整合基本面数据:对于较长时间周期,可考虑引入基本面指标作为额外的过滤条件。
-
优化交易量指标:探索更复杂的交易量分析方法,如相对交易量或交易量分布分析。
-
加入机器学习模型:使用机器学习算法优化参数选择和信号生成过程。
ATR和交易量结合的动态信号线趋势跟踪策略是一个灵活而全面的交易系统,适合日内交易者使用。它通过结合技术指标和交易量分析,提供了一种平衡风险和收益的方法。该策略的核心优势在于其动态适应市场条件的能力,以及使用交易量作为确认指标来增强信号可靠性。
然而,该策略也面临一些挑战,如在震荡市场中的表现和参数优化的复杂性。为了进一步提高策略的稳健性和性能,可以考虑引入多时间框架分析、动态参数调整和更复杂的风险管理技术。
总的来说,这个策略为交易者提供了一个坚实的基础,可以根据个人交易风格和市场特性进行进一步的定制和优化。通过持续的回测和实盘验证,交易者可以逐步完善策略,提高其在各种市场条件下的表现。
||
This strategy is a dynamic signal line trend following system that combines Simple Moving Average (SMA), Average True Range (ATR), and trading volume. It utilizes ATR to adjust the position of the signal line and uses volume as a confirmation indicator. The strategy aims to capture market trends while considering market volatility and trading activity, suitable for intraday trading timeframes.
-
Signal Line Calculation:
- Uses a 50-period SMA as the baseline.
- Subtracts the 20-period ATR value multiplied by a user-defined offset from the SMA to form a dynamic signal line.
-
Entry Conditions:
- Buy: When the price's low point breaks above the signal line, and the current volume is greater than 1.5 times the 50-period average volume.
- Sell: When the price's high point falls below the signal line, and the current volume is greater than 1.5 times the 50-period average volume.
-
Exit Conditions:
- Long position close: When the closing price is lower than the previous candle's lowest price.
- Short position close: When the closing price is higher than the previous candle's highest price.
-
Visualization:
- Plots the signal line on the chart.
- Uses triangle markers to indicate buy, sell, and exit signals.
-
Dynamic Adaptability: By combining SMA and ATR, the signal line can dynamically adjust to market volatility, improving the strategy's adaptability.
-
Volume Confirmation: Using volume as an additional filter condition helps reduce false signals and increases trade reliability.
-
Trend Following: The strategy design follows trend-following principles, beneficial for capturing major trend movements.
-
Risk Management: Setting clear exit conditions helps control risk and prevent excessive losses.
-
Flexibility: Strategy parameters are adjustable, allowing traders to optimize for different market conditions.
-
Visualization-Friendly: Clearly displays trading signals through chart markers, facilitating analysis and backtesting.
-
Choppy Market Risk: In sideways or choppy markets, frequent false breakout signals may occur, leading to overtrading and commission losses.
-
Slippage Risk: Especially in intraday trading, high-frequency trading may face serious slippage issues, affecting actual execution effectiveness.
-
Over-reliance on Volume: Under certain market conditions, volume may not be a reliable indicator, potentially leading to missed important trading opportunities.
-
Parameter Sensitivity: Strategy effectiveness highly depends on parameter settings, which may require frequent adjustments for different markets and timeframes.
-
Trend Reversal Risk: The strategy may react slowly at the beginning of trend reversals, leading to some drawdowns.
-
Multi-Timeframe Analysis: Introduce trend judgments from longer time periods to improve overall trend assessment accuracy.
-
Dynamic Parameter Adjustment: Develop adaptive mechanisms to automatically adjust SMA length, ATR period, and volume multiplier based on market conditions.
-
Add Market State Filters: Introduce volatility or trend strength indicators to adopt different trading strategies under various market states.
-
Improve Exit Mechanism: Consider using trailing stops or ATR-based dynamic stops to better manage risk and lock in profits.
-
Integrate Fundamental Data: For longer timeframes, consider introducing fundamental indicators as additional filter conditions.
-
Optimize Volume Indicators: Explore more complex volume analysis methods, such as relative volume or volume distribution analysis.
-
Incorporate Machine Learning Models: Use machine learning algorithms to optimize parameter selection and signal generation processes.
The Dynamic Signal Line Trend Following Strategy Combining ATR and Volume is a flexible and comprehensive trading system suitable for intraday traders. It provides a method to balance risk and reward by combining technical indicators and volume analysis. The core advantage of this strategy lies in its ability to dynamically adapt to market conditions and use volume as a confirmation indicator to enhance signal reliability.
However, the strategy also faces some challenges, such as performance in choppy markets and the complexity of parameter optimization. To further improve the strategy's robustness and performance, considerations can be given to introducing multi-timeframe analysis, dynamic parameter adjustment, and more sophisticated risk management techniques.
Overall, this strategy provides traders with a solid foundation that can be further customized and optimized according to individual trading styles and market characteristics. Through continuous backtesting and live trading validation, traders can gradually refine the strategy and improve its performance under various market conditions.
[/trans]
Source (PineScript)
/*backtest
start: 2024-06-01 00:00:00
end: 2024-06-30 23:59:59
period: 1h
basePeriod: 15m
exchanges: [{"eid":"Futures_Binance","currency":"BTC_USDT"}]
*/

//@version=5
strategy("Buy and Sell Strategy with ATR and Volume", overlay=true)

// Input Parameters
length = input.int(50, title="SMA Length")
atr_length = input.int(20, title="ATR Length")
signal_line_offset = input.int(1, title="Signal Line ATR Offset", minval=0)
volume_multiplier = input.float(1.5, title="Volume Multiplier")

// Calculations
sma_close = ta.sma(close, length)
atr_val = ta.atr(atr_length)
signal_line = sma_close - atr_val * signal_line_offset
avg_volume = ta.sma(volume, length)

// Conditions
buy_condition = ta.crossover(low, signal_line) and volume > avg_volume * volume_multiplier
sell_condition = ta.crossunder(high, signal_line) and volume > avg_volume * volume_multiplier

// Strategy Execution
if (buy_condition)
    strategy.entry("Buy", strategy.long)
if (sell_condition)
    strategy.entry("Sell", strategy.short)

// Exit Conditions
exit_buy_condition = strategy.position_size > 0 and close < low[1]
exit_sell_condition = strategy.position_size < 0 and close > high[1]

if (exit_buy_condition)
    strategy.close("Buy")
if (exit_sell_condition)
    strategy.close("Sell")

// Plot Signals
plot(signal_line, color=color.green, title="Signal Line")
plotshape(series=buy_condition ? low : na, style=shape.triangleup, color=color.green, size=size.small, location=location.belowbar, title="Buy Signal")
plotshape(series=sell_condition ? high : na, style=shape.triangledown, color=color.red, size=size.small, location=location.abovebar, title="Sell Signal")
plotshape(series=exit_buy_condition ? close : na, style=shape.triangledown, color=color.orange, size=size.small, location=location.abovebar, title="Exit Buy Signal", text="Exit Buy")
plotshape(series=exit_sell_condition ? close : na, style=shape.triangleup, color=color.blue, size=size.small, location=location.belowbar, title="Exit Sell Signal", text="Exit Sell")
Detail
https://www.fmz.com/strategy/458177
Last Modified
2024-07-30 16:01:40