Name
ATR增强型蜡烛反转模式识别与风险管理策略-ATR-Enhanced-Candlestick-Reversal-Pattern-Recognition-and-Risk-Management-Strategy
Author
ianzeng123
Strategy Description
[trans]
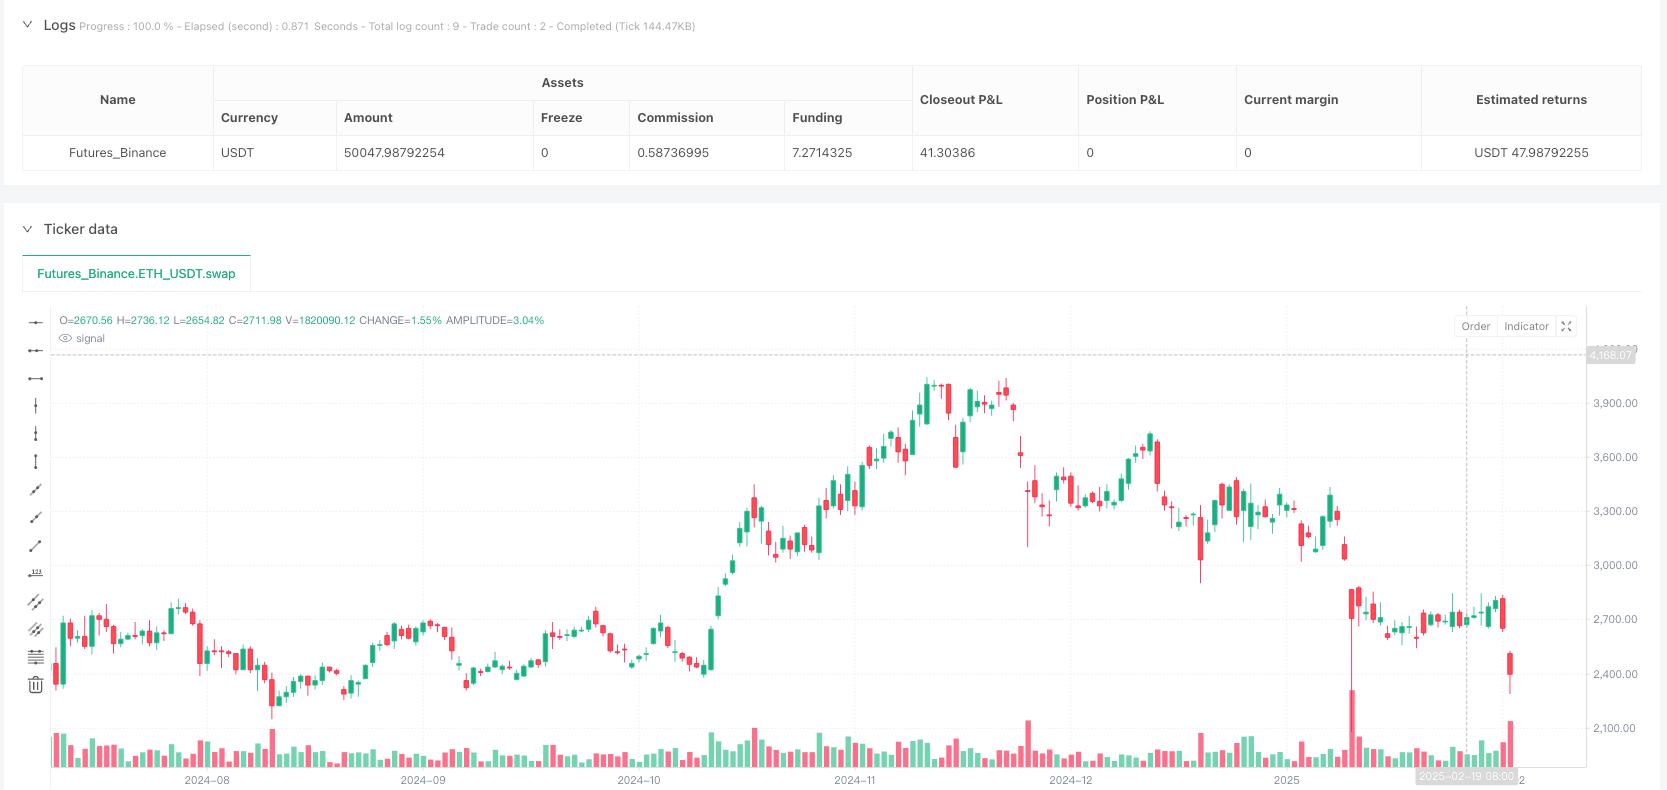
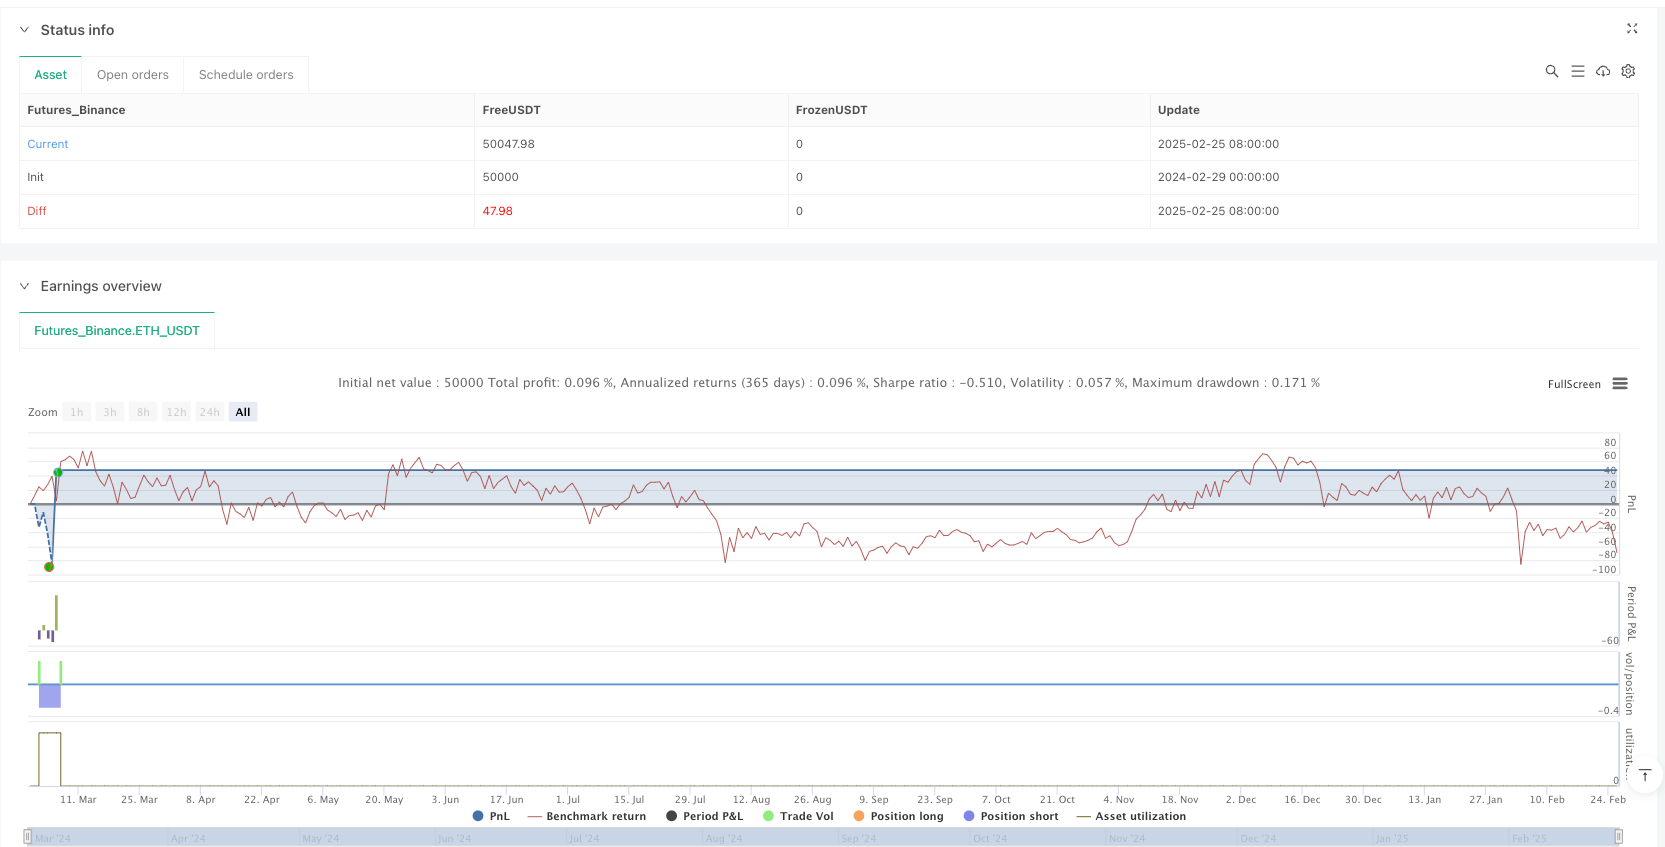
ATR增强型蜡烛反转模式识别与风险管理策略是一种专注于识别市场潜在反转点的交易系统。该策略主要通过检测两种经典的蜡烛图形态——锤子线(看涨反转信号)和流星线(看跌反转信号),并结合平均真实范围(ATR)指标作为过滤条件,确保只在足够显著的价格波动环境下触发交易信号。同时,策略内置了基于ATR的动态止损和止盈机制,有效控制每笔交易的风险和收益比例。该策略适用于中长期交易者,特别是那些希望在技术分析基础上增加风险管理维度的投资者。
该策略的核心原理基于识别特定的蜡烛图形态,并通过ATR指标验证这些形态的有效性。具体实现逻辑如下:
-
ATR过滤器设置:策略使用14周期的ATR计算市场波动性,并设定1.5倍ATR作为形态有效性的阈值,确保只在足够大的价格波动环境下触发信号。
-
蜡烛图形态定义:
- 计算蜡烛实体大小(body)、上影线(upper wick)、下影线(lower wick)以及总体范围(total range)
- 锤子线(Hammer)定义:下影线长度超过实体长度的2倍,上影线长度小于实体长度,总体范围大于1.5倍ATR
- 流星线(Shooting Star)定义:上影线长度超过实体长度的2倍,下影线长度小于实体长度,总体范围大于1.5倍ATR
-
信号确认机制:
- 锤子线信号确认:形态满足锤子线定义,并且收盘价上穿开盘价
- 流星线信号确认:形态满足流星线定义,并且收盘价下穿开盘价
-
入场条件:
- 确认锤子线信号时,执行做多入场
- 确认流星线信号时,执行做空入场
-
风险管理机制:
- 止损设置:多头止损设为最低价减去1.5倍ATR,空头止损设为最高价加上1.5倍ATR
- 止盈设置:多头止盈设为收盘价加上2.5倍ATR,空头止盈设为收盘价减去2.5倍ATR
深入分析该策略的代码实现,可以总结出以下几点显著优势:
-
精确的形态识别:策略通过严格的数学定义来识别锤子线和流星线形态,减少了主观判断带来的误差,提高了信号的准确性。
-
ATR波动性过滤:使用ATR作为过滤条件,确保只在足够显著的价格波动环境下触发交易信号,有效减少了假突破和噪音信号。
-
信号确认机制:不仅依赖形态识别,还要求收盘价与开盘价的交叉确认,进一步提高了信号的可靠性。
-
动态风险管理:基于ATR的止损和止盈设置,使风险管理机制能够根据市场波动性自动调整,比固定点数的止损止盈更加灵活和适应性强。
-
可视化实现:策略在图表上直观显示交易信号,便于交易者快速识别和验证。
-
资金管理整合:默认采用账户权益比例作为仓位管理方式,确保在不同账户规模下都能保持一致的风险暴露。
-
自动化友好:代码结构清晰,适合与AutoView等自动交易系统集成,实现全自动交易。
尽管该策略具有多项优势,但在实际应用中仍存在一些潜在风险和局限性:
-
假信号风险:尽管使用了ATR过滤,蜡烛图形态识别仍可能在某些市场条件下产生假信号,特别是在高波动性或者频繁震荡的市场环境中。
-
参数敏感性:ATR乘数、止损和止盈倍数等参数设置对策略性能有显著影响,不同市场环境可能需要不同的参数配置。
-
趋势依赖性:该策略主要识别潜在的反转点,但在强趋势市场中,反转信号可能频繁出现但不一定有效。
-
止损幅度考量:当前的止损设置(1.5倍ATR)在高波动市场中可能导致止损点位过远,增加单笔交易的风险敞口。
-
信号滞后性:由于需要等待蜡烛收盘并确认形态,策略可能在价格已经有一定移动后才发出信号,错过最佳入场点。
针对这些风险,可以采取以下解决方法:
- 结合更多技术指标或市场结构分析来过滤信号
- 针对不同市场和时间框架优化参数配置
- 在强趋势环境中考虑禁用逆势交易信号
- 添加时间过滤器,避免在重要新闻或低流动性时段交易
- 考虑使用更灵活的仓位管理策略,根据信号强度调整交易规模
基于对策略代码的深入分析,可以提出以下几个优化方向:
-
趋势过滤:整合趋势指标(如移动平均线、ADX等),只在与主要趋势方向一致时接受信号,或者给予顺势信号更高的权重,这可以显著减少在强趋势中接收到的错误反转信号。
-
多时间框架分析:引入更高时间框架的确认机制,例如只有当日线和4小时图都显示相同方向的信号时才执行交易,这种方法可以提高信号质量和成功率。
-
量能确认:添加成交量分析维度,要求在形态确认时成交量有显著增加,这对于确认市场参与者对反转的认可度非常重要。
-
动态参数优化:实现基于历史波动率或市场状态的参数自适应机制,例如在不同的VIX水平或市场阶段自动调整ATR乘数和风险管理参数。
-
止损策略增强:考虑实现追踪止损功能,特别是对于盈利交易,这可以在保护已有盈利的同时允许趋势继续发展。
-
信号强度分级:基于形态完美度(如影线长度比例、实体大小等)对信号进行强度评级,并据此调整仓位大小,这种差异化管理可以更好地反映信号的可信度。
-
时间过滤器:添加交易时间过滤,避开低流动性时段或重大经济数据发布期间,减少由异常波动引起的假信号。
-
市场环境识别:开发市场状态分类系统,在不同类型的市场(趋势、区间、高波动等)中应用不同的交易规则或参数设置。
这些优化方向的实施可以显著提升策略的稳健性和适应性,使其能够在更广泛的市场环境中保持良好表现。
ATR增强型蜡烛反转模式识别与风险管理策略是一个将传统技术分析方法与现代量化风险管理技术相结合的交易系统。其核心价值在于通过严格的数学定义和ATR过滤机制,提高了蜡烛图形态识别的准确性和可靠性,同时采用基于市场波动性的动态风险管理方法,实现了对交易风险的有效控制。
该策略最显著的特点是将形态识别、信号确认和风险管理三个维度有机结合,形成了一个完整的交易系统。尽管存在一些潜在的风险和局限性,但通过建议的优化方向,特别是增加趋势过滤、多时间框架分析和动态参数优化等技术,策略的整体表现可以得到进一步提升。
对于交易者而言,这个策略提供了一个理解和应用蜡烛图形态的系统化框架,尤其适合那些希望在技术分析基础上引入风险管理维度的投资者。通过合理的参数调整和针对特定市场特性的优化,该策略有潜力在各种市场条件下保持稳定的表现。
||
The ATR-Enhanced Candlestick Reversal Pattern Recognition and Risk Management Strategy is a trading system focused on identifying potential market reversal points. This strategy primarily works by detecting two classic candlestick patterns—Hammer (bullish reversal signal) and Shooting Star (bearish reversal signal)—combined with the Average True Range (ATR) indicator as a filtering condition to ensure trade signals are triggered only in environments with significant price volatility. Additionally, the strategy incorporates ATR-based dynamic stop-loss and take-profit mechanisms, effectively controlling the risk-reward ratio for each trade. This strategy is suitable for medium to long-term traders, especially those looking to add a risk management dimension to their technical analysis approach.
The core principle of this strategy is based on identifying specific candlestick patterns and validating these patterns through the ATR indicator. The specific implementation logic is as follows:
-
ATR Filter Setup: The strategy uses a 14-period ATR to calculate market volatility and sets 1.5 times ATR as the threshold for pattern validity, ensuring signals are triggered only in environments with sufficient price movement.
-
Candlestick Pattern Definitions:
- Calculates candle body size, upper wick, lower wick, and total range
- Hammer definition: Lower wick length exceeds twice the body length, upper wick length is less than body length, and total range is greater than 1.5 times ATR
- Shooting Star definition: Upper wick length exceeds twice the body length, lower wick length is less than body length, and total range is greater than 1.5 times ATR
-
Signal Confirmation Mechanism:
- Hammer signal confirmation: Pattern meets Hammer definition, and closing price crosses above opening price
- Shooting Star signal confirmation: Pattern meets Shooting Star definition, and closing price crosses below opening price
-
Entry Conditions:
- When Hammer signal is confirmed, execute long entry
- When Shooting Star signal is confirmed, execute short entry
-
Risk Management Mechanism:
- Stop-loss setting: Long stop-loss set at low price minus 1.5 times ATR, short stop-loss set at high price plus 1.5 times ATR
- Take-profit setting: Long take-profit set at closing price plus 2.5 times ATR, short take-profit set at closing price minus 2.5 times ATR
Through in-depth analysis of the strategy's code implementation, the following significant advantages can be summarized:
-
Precise Pattern Recognition: The strategy uses strict mathematical definitions to identify Hammer and Shooting Star patterns, reducing errors from subjective judgment and improving signal accuracy.
-
ATR Volatility Filtering: Using ATR as a filtering condition ensures trade signals are triggered only in environments with significant price movement, effectively reducing false breakouts and noise signals.
-
Signal Confirmation Mechanism: Relies not only on pattern recognition but also requires confirmation through closing and opening price crossovers, further enhancing signal reliability.
-
Dynamic Risk Management: ATR-based stop-loss and take-profit settings allow the risk management mechanism to automatically adjust according to market volatility, offering more flexibility and adaptability than fixed-point stop-loss and take-profit approaches.
-
Visualization Implementation: The strategy visually displays trading signals on charts, facilitating quick identification and verification by traders.
-
Capital Management Integration: Adopts account equity proportion as the default position management method, ensuring consistent risk exposure across different account sizes.
-
Automation-Friendly: Clear code structure, suitable for integration with automated trading systems like AutoView for fully automated trading.
Despite its numerous advantages, there are several potential risks and limitations when applying this strategy in practice:
-
False Signal Risk: Despite using ATR filtering, candlestick pattern recognition may still generate false signals under certain market conditions, especially in highly volatile or frequently oscillating market environments.
-
Parameter Sensitivity: ATR multiplier, stop-loss, and take-profit multiplier parameter settings significantly impact strategy performance, and different market environments may require different parameter configurations.
-
Trend Dependency: This strategy primarily identifies potential reversal points, but in strong trending markets, reversal signals may appear frequently but not necessarily be effective.
-
Stop-Loss Range Consideration: The current stop-loss setting (1.5 times ATR) may lead to distant stop-loss points in high-volatility markets, increasing risk exposure for individual trades.
-
Signal Lag: As the strategy requires waiting for candle closing and pattern confirmation, signals may be generated after prices have already moved significantly, missing optimal entry points.
To address these risks, the following solutions can be implemented:
- Combine additional technical indicators or market structure analysis to filter signals
- Optimize parameter configurations for different markets and timeframes
- Consider disabling counter-trend signals in strong trending environments
- Add time filters to avoid trading during important news releases or low liquidity periods
- Consider using more flexible position management strategies, adjusting trade size based on signal strength
Based on in-depth analysis of the strategy code, the following optimization directions can be proposed:
-
Trend Filtering: Integrate trend indicators (such as moving averages, ADX, etc.) to accept signals only when aligned with the main trend direction or give higher weight to trend-following signals. This can significantly reduce false reversal signals received during strong trends.
-
Multi-Timeframe Analysis: Introduce higher timeframe confirmation mechanisms, for example, executing trades only when daily and 4-hour charts show signals in the same direction. This approach can improve signal quality and success rate.
-
Volume Confirmation: Add volume analysis dimension, requiring significant volume increase during pattern confirmation. This is crucial for verifying market participants' acknowledgment of the reversal.
-
Dynamic Parameter Optimization: Implement parameter self-adaptive mechanisms based on historical volatility or market states, for example, automatically adjusting ATR multipliers and risk management parameters at different VIX levels or market stages.
-
Stop-Loss Strategy Enhancement: Consider implementing trailing stop-loss functionality, especially for profitable trades. This can protect existing profits while allowing trends to continue developing.
-
Signal Strength Grading: Grade signals based on pattern perfection (such as wick length ratio, body size, etc.) and adjust position size accordingly. This differentiated management can better reflect signal credibility.
-
Time Filtering: Add trading time filters to avoid low liquidity periods or major economic data release periods, reducing false signals caused by abnormal volatility.
-
Market Environment Recognition: Develop a market state classification system, applying different trading rules or parameter settings in different types of markets (trending, range-bound, high volatility, etc.).
Implementing these optimization directions can significantly enhance the strategy's robustness and adaptability, enabling it to maintain good performance across a wider range of market environments.
The ATR-Enhanced Candlestick Reversal Pattern Recognition and Risk Management Strategy is a trading system that combines traditional technical analysis methods with modern quantitative risk management techniques. Its core value lies in improving the accuracy and reliability of candlestick pattern recognition through strict mathematical definitions and ATR filtering mechanisms, while adopting dynamic risk management methods based on market volatility for effective control of trading risks.
The most significant feature of this strategy is the organic integration of pattern recognition, signal confirmation, and risk management dimensions to form a complete trading system. Despite some potential risks and limitations, through the suggested optimization directions—especially adding trend filtering, multi-timeframe analysis, and dynamic parameter optimization techniques—the overall performance of the strategy can be further enhanced.
For traders, this strategy provides a systematic framework for understanding and applying candlestick patterns, particularly suitable for those looking to introduce risk management dimensions on the basis of technical analysis. Through reasonable parameter adjustments and optimizations targeting specific market characteristics, this strategy has the potential to maintain stable performance under various market conditions. [/trans]
Source (PineScript)
/*backtest
start: 2024-02-29 00:00:00
end: 2025-02-26 08:00:00
period: 1d
basePeriod: 1d
exchanges: [{"eid":"Futures_Binance","currency":"ETH_USDT"}]
*/

//@version=5
strategy("Hammers & Stars Strategy", overlay=true, default_qty_type=strategy.percent_of_equity, default_qty_value=2)

// ATR Filter
atrLength = 14
atrMultiplier = 1.5
atrValue = ta.atr(atrLength)

// Candlestick Pattern Definitions
bodySize = math.abs(close - open)
wicksUpper = high - math.max(close, open)
wicksLower = math.min(close, open) - low
totalRange = high - low

// Hammer Pattern (Bullish Reversal)
isHammer = wicksLower > (2 * bodySize) and wicksUpper < bodySize and totalRange > atrMultiplier * atrValue
hammerSignal = isHammer and ta.crossover(close, open)  // Confirmation

// Shooting Star Pattern (Bearish Reversal)
isShootingStar = wicksUpper > (2 * bodySize) and wicksLower < bodySize and totalRange > atrMultiplier * atrValue
shootingStarSignal = isShootingStar and ta.crossunder(close, open)  // Confirmation

// Entry Conditions
if hammerSignal
    strategy.entry("Hammer Buy", strategy.long)
if shootingStarSignal
    strategy.entry("ShootingStar Sell", strategy.short)

// Stop Loss & Take Profit
slMultiplier = 1.5
tlMultiplier = 2.5
longStopLoss = low - slMultiplier * atrValue
longTakeProfit = close + tlMultiplier * atrValue
shortStopLoss = high + slMultiplier * atrValue
shortTakeProfit = close - tlMultiplier * atrValue

strategy.exit("Take Profit / Stop Loss", from_entry="Hammer Buy", stop=longStopLoss, limit=longTakeProfit)
strategy.exit("Take Profit / Stop Loss", from_entry="ShootingStar Sell", stop=shortStopLoss, limit=shortTakeProfit)

// Plot Signals on Chart
plotshape(hammerSignal, location=location.belowbar, color=color.green, style=shape.labelup, title="Hammer")
plotshape(shootingStarSignal, location=location.abovebar, color=color.red, style=shape.labeldown, title="Shooting Star")
Detail
https://www.fmz.com/strategy/484092
Last Modified
2025-02-28 09:48:37