Name
ATR-RSI增强型趋势追踪交易系统-ATR-RSI-Enhanced-Trend-Following-Trading-System
Author
ChaoZhang
Strategy Description
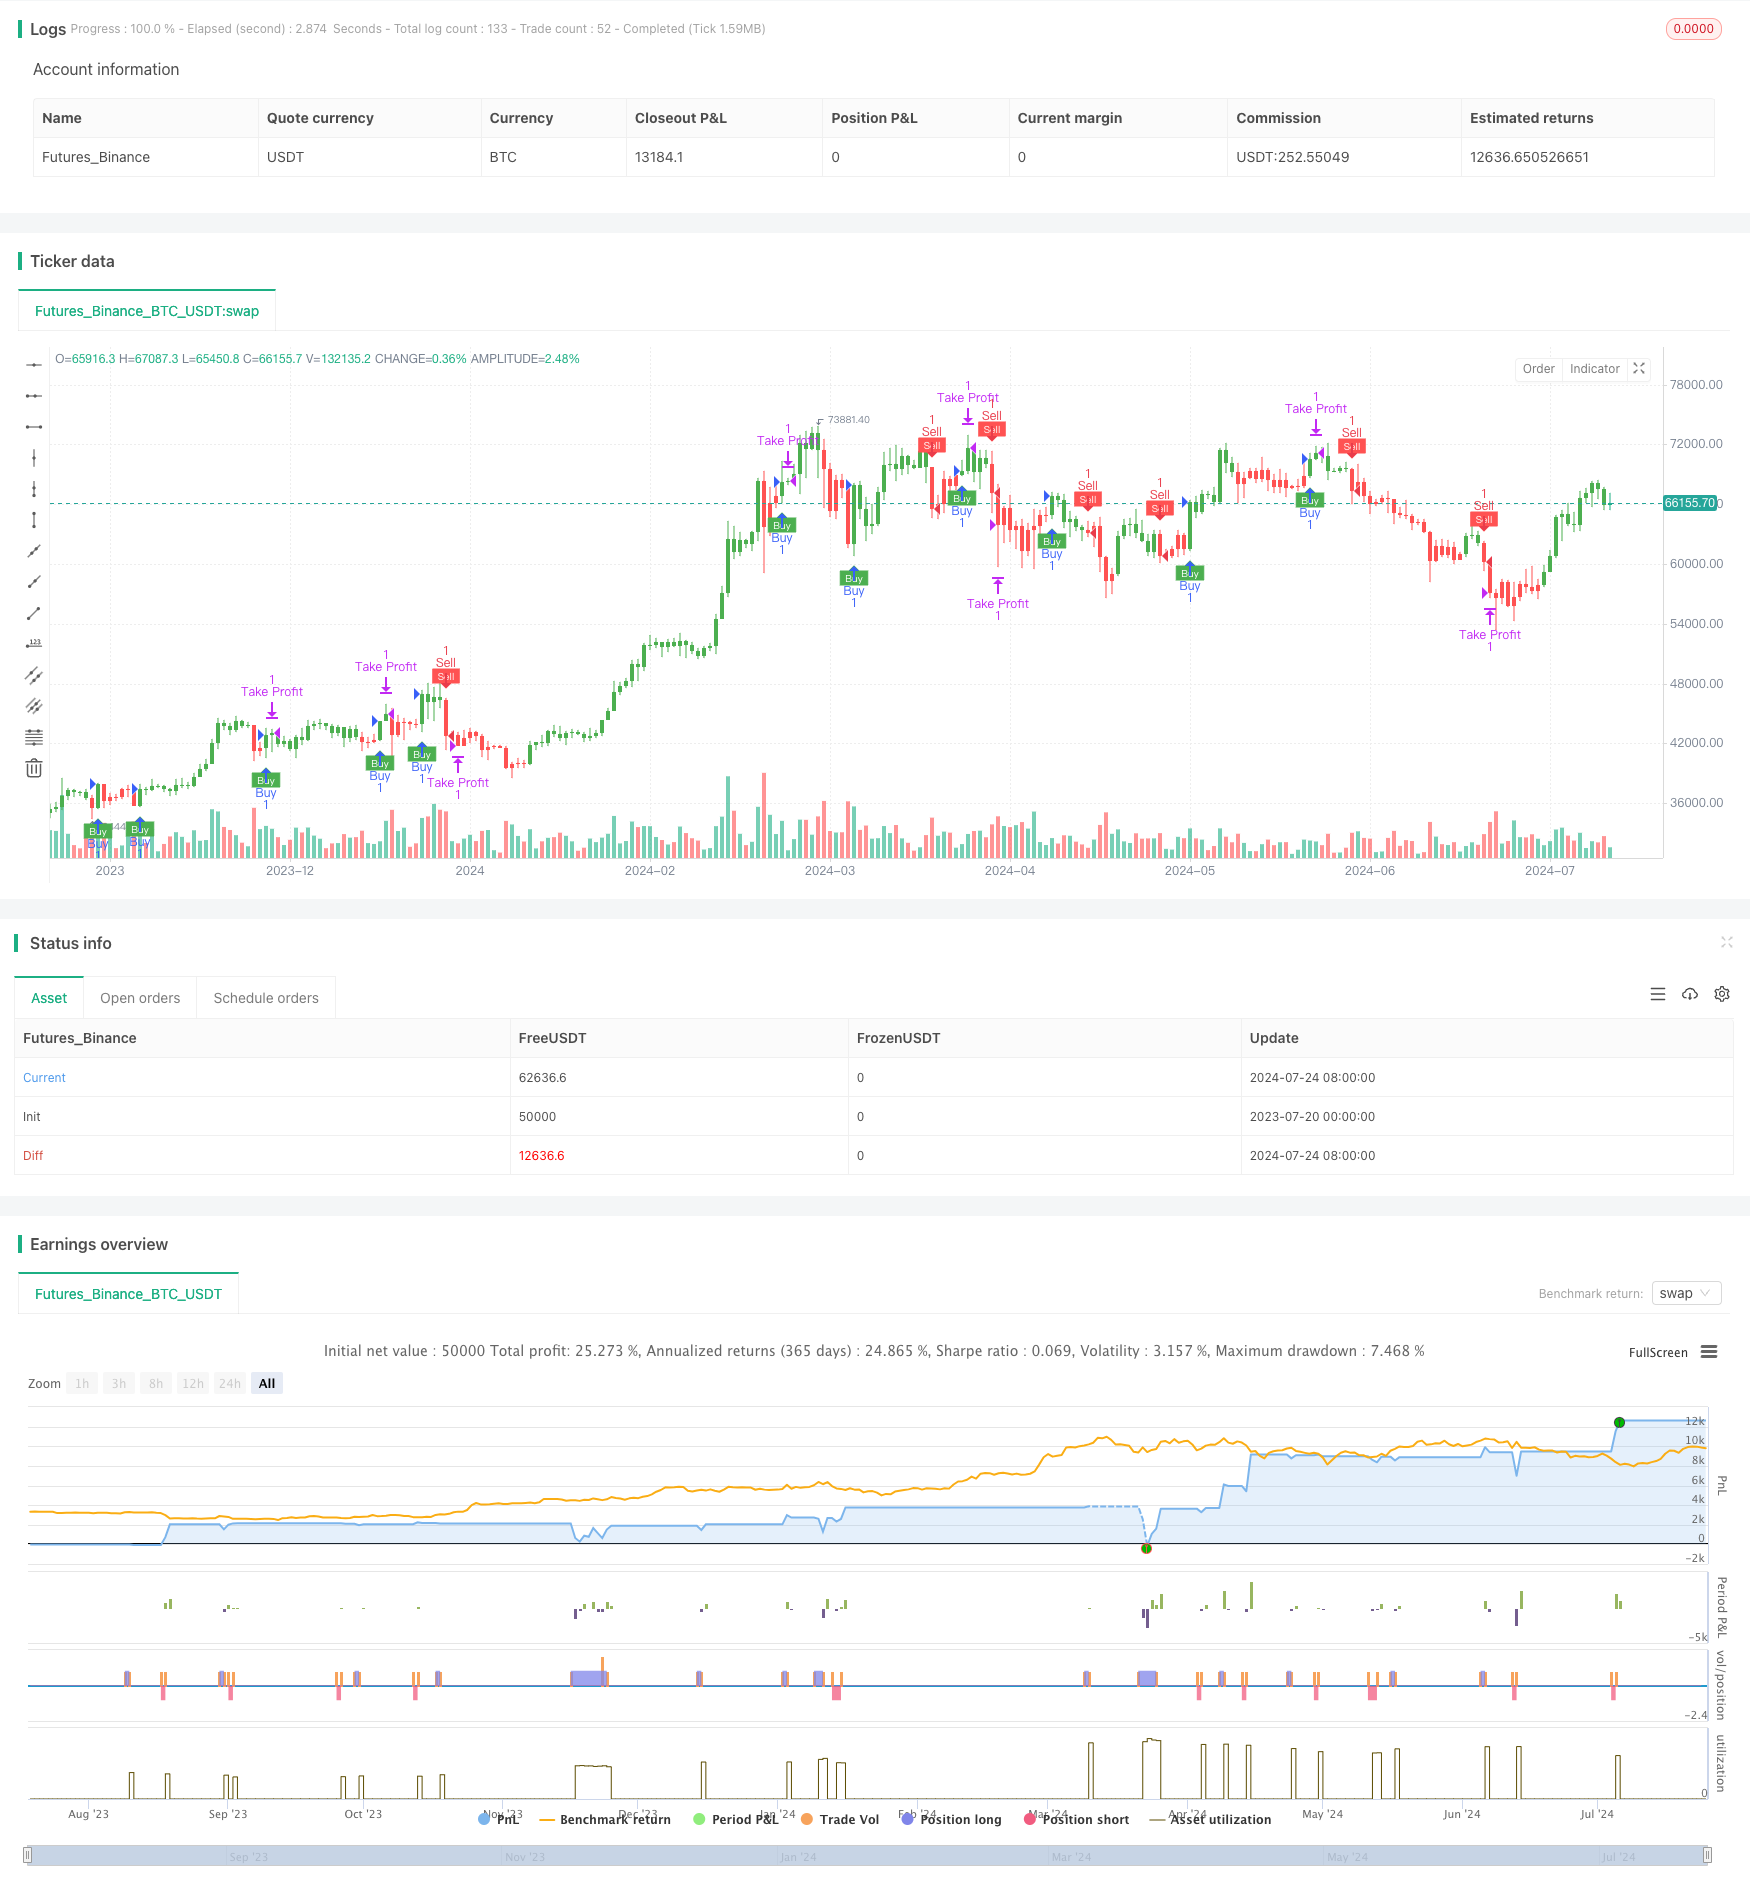
[trans]
ATR-RSI增强型趋势追踪交易系统是一个结合了平均真实范围(ATR)、相对强弱指标(RSI)和指数移动平均线(EMA)的高级量化交易策略。该策略利用UT Bot警报系统作为核心,通过ATR跟踪止损、RSI过滤和EMA交叉来识别潜在的交易机会。系统还整合了平滑K线(Heikin Ashi)选项,以减少市场噪音,提高信号质量。这种多指标融合方法旨在捕捉强劲的市场趋势,同时通过设定百分比退出点来管理风险。
-
ATR跟踪止损:使用ATR计算动态止损水平,随市场波动调整。这为趋势跟踪提供了灵活的基础。
-
RSI过滤:只有当RSI高于50时允许买入,低于50时允许卖出。这有助于确保交易方向与整体市场动量一致。
-
EMA交叉:使用1周期EMA与ATR跟踪止损线的交叉来生成交易信号。这提供了额外的趋势确认。
-
Heikin Ashi选项:可选择使用平滑K线来减少假信号,提高趋势识别的准确性。
-
百分比退出:根据入场价格设定固定百分比的获利和止损水平,以管理每笔交易的风险回报比。
-
非重绘设计:策略采用非重绘设计,确保历史回测结果与实时交易表现一致。
-
多指标融合:结合ATR、RSI和EMA,全面评估市场状况,提高信号可靠性。
-
动态风险管理:ATR跟踪止损随市场波动调整,提供灵活的风险控制。
-
趋势确认:RSI过滤和EMA交叉共同作用,有助于确认强劲趋势,减少假突破。
-
灵活性:可选Heikin Ashi模式,适应不同市场条件和交易风格。
-
精确退出:基于百分比的获利和止损设置,确保每笔交易都有明确的风险管理策略。
-
非重绘特性:保证策略在回测和实盘中表现一致,提高可信度。
-
自动化:完全系统化的设计,减少人为情绪干扰,提高执行效率。
-
过度交易:在震荡市场中可能产生频繁的假信号,导致过度交易和手续费侵蚀。
-
滞后性:由于使用多个指标,可能在趋势转折点反应较慢,影响盈利。
-
参数敏感:策略效果高度依赖于ATR周期、RSI设置等参数,不当的参数选择可能导致表现不佳。
-
市场适应性:可能在某些特定市场条件下表现优异,但在其他情况下效果欠佳。
-
固定百分比退出:可能在大趋势中过早退出,错失更多盈利机会。
-
动态RSI阈值:考虑根据市场波动性动态调整RSI的买卖阈值,以适应不同市场阶段。
-
多时间框架分析:引入更长期的时间框架分析,提高趋势判断的准确性。
-
波动率调整:根据ATR值动态调整交易规模和百分比退出水平,更好地适应市场波动。
-
机器学习集成:利用机器学习算法优化参数选择和信号生成过程,提高策略的适应性。
-
情绪指标整合:考虑加入市场情绪指标,如VIX或期权隐含波动率,以增强市场timing。
-
自适应指标:开发能够根据市场条件自动调整的指标,如自适应移动平均线。
-
风险平价:实施风险平价方法,根据不同市场的波动性动态分配资金。
ATR-RSI增强型趋势追踪交易系统是一个综合性的量化交易策略,通过融合多个技术指标和风险管理技术,旨在捕捉持续性强劲趋势。其核心优势在于动态风险管理、多重趋势确认和灵活的参数设置。然而,使用者需要注意潜在的过度交易风险和参数优化的重要性。通过持续的优化和调整,如引入动态阈值、多时间框架分析和机器学习技术,该策略有潜力在各种市场环境中保持稳定性能。对于寻求系统化方法来捕捉市场趋势的交易者而言,这是一个值得深入研究和定制的强大工具。
||
The ATR-RSI Enhanced Trend Following Trading System is an advanced quantitative trading strategy that combines Average True Range (ATR), Relative Strength Index (RSI), and Exponential Moving Average (EMA). This strategy utilizes the UT Bot alert system as its core, identifying potential trading opportunities through ATR trailing stops, RSI filtering, and EMA crossovers. The system also incorporates a Heikin Ashi candle option to reduce market noise and improve signal quality. This multi-indicator fusion approach aims to capture strong market trends while managing risk through percentage-based exit points.
-
ATR Trailing Stop: Uses ATR to calculate dynamic stop-loss levels that adjust with market volatility, providing a flexible foundation for trend following.
-
RSI Filter: Allows buying only when RSI is above 50 and selling when below 50, ensuring trade direction aligns with overall market momentum.
-
EMA Crossover: Utilizes crossovers between a 1-period EMA and the ATR trailing stop line to generate trade signals, providing additional trend confirmation.
-
Heikin Ashi Option: Offers the choice to use smoothed candles to reduce false signals and improve trend identification accuracy.
-
Percentage-Based Exits: Sets fixed percentage profit and stop-loss levels based on entry price to manage risk-reward for each trade.
-
Non-Repainting Design: Ensures historical backtest results are consistent with real-time trading performance.
-
Multi-Indicator Fusion: Combines ATR, RSI, and EMA for a comprehensive market assessment, enhancing signal reliability.
-
Dynamic Risk Management: ATR trailing stops adjust with market volatility, providing flexible risk control.
-
Trend Confirmation: RSI filtering and EMA crossovers work together to confirm strong trends and reduce false breakouts.
-
Flexibility: Optional Heikin Ashi mode adapts to different market conditions and trading styles.
-
Precise Exits: Percentage-based profit and stop-loss settings ensure clear risk management for each trade.
-
Non-Repainting Feature: Guarantees consistent strategy performance in backtests and live trading, increasing credibility.
-
Automation: Fully systematic design reduces emotional interference and improves execution efficiency.
-
Overtrading: May generate frequent false signals in choppy markets, leading to excessive trading and commission erosion.
-
Lagging Nature: Due to the use of multiple indicators, may react slowly at trend reversal points, affecting profitability.
-
Parameter Sensitivity: Strategy effectiveness highly depends on parameters like ATR period and RSI settings; improper parameter selection may lead to poor performance.
-
Market Adaptability: May excel in specific market conditions but underperform in others.
-
Fixed Percentage Exits: Could lead to premature exits in strong trends, missing out on larger profit opportunities.
-
Dynamic RSI Thresholds: Consider dynamically adjusting RSI buy/sell thresholds based on market volatility to adapt to different market phases.
-
Multi-Timeframe Analysis: Introduce longer-term timeframe analysis to improve trend judgment accuracy.
-
Volatility Adjustment: Dynamically adjust trade size and percentage exit levels based on ATR values to better adapt to market volatility.
-
Machine Learning Integration: Utilize machine learning algorithms to optimize parameter selection and signal generation processes, enhancing strategy adaptability.
-
Sentiment Indicator Integration: Consider adding market sentiment indicators, such as VIX or option implied volatility, to enhance market timing.
-
Adaptive Indicators: Develop indicators that automatically adjust based on market conditions, such as adaptive moving averages.
-
Risk Parity: Implement risk parity methods to dynamically allocate capital based on the volatility of different markets.
The ATR-RSI Enhanced Trend Following Trading System is a comprehensive quantitative trading strategy that aims to capture strong, sustained trends by integrating multiple technical indicators and risk management techniques. Its core strengths lie in dynamic risk management, multiple trend confirmations, and flexible parameter settings. However, users need to be aware of potential overtrading risks and the importance of parameter optimization. Through continuous optimization and adjustments, such as introducing dynamic thresholds, multi-timeframe analysis, and machine learning techniques, this strategy has the potential to maintain stable performance across various market environments. For traders seeking a systematic approach to capturing market trends, this is a powerful tool worth deep research and customization.
[/trans]
Source (PineScript)
//@version=5
strategy("UT Bot Alerts - Non-Repainting with RSI Filter", overlay=true)

// Inputs
a = input.int(1, title="Key Value. 'This changes the sensitivity'")
c = input.int(10, title="ATR Period")
h = input.bool(false, title="Signals from Heikin Ashi Candles")
percentage = input.float(0.002, title="Percentage for Exit (0.2% as decimal)")

// RSI Inputs
rsiPeriod = input.int(14, title="RSI Period")
rsiSource = input.source(close, title="RSI Source")

// ATR Calculation
xATR = ta.atr(c)
nLoss = a * xATR

// Heikin Ashi Calculation
haClose = request.security(syminfo.tickerid, timeframe.period, close, lookahead=barmerge.lookahead_on)
haOpen = request.security(syminfo.tickerid, timeframe.period, open, lookahead=barmerge.lookahead_on)
haHigh = request.security(syminfo.tickerid, timeframe.period, high, lookahead=barmerge.lookahead_on)
haLow = request.security(syminfo.tickerid, timeframe.period, low, lookahead=barmerge.lookahead_on)
haCloseSeries = (haOpen + haHigh + haLow + haClose) / 4

src = h ? haCloseSeries : close

// RSI Calculation
rsiValue = ta.rsi(rsiSource, rsiPeriod)

// Non-repainting ATR Trailing Stop Calculation
var float xATRTrailingStop = na
if (barstate.isconfirmed)
    xATRTrailingStop := src > nz(xATRTrailingStop[1], 0) and src[1] > nz(xATRTrailingStop[1], 0) ? math.max(nz(xATRTrailingStop[1]), src - nLoss) : src < nz(xATRTrailingStop[1], 0) and src[1] < nz(xATRTrailingStop[1], 0) ? math.min(nz(xATRTrailingStop[1]), src + nLoss) : src > nz(xATRTrailingStop[1], 0) ? src - nLoss : src + nLoss

// Position Calculation
var int pos = 0
if (barstate.isconfirmed)
    pos := src[1] < nz(xATRTrailingStop[1], 0) and src > nz(xATRTrailingStop[1], 0) ? 1 : src[1] > nz(xATRTrailingStop[1], 0) and src < nz(xATRTrailingStop[1], 0) ? -1 : nz(pos[1], 0)

xcolor = pos == -1 ? color.red : pos == 1 ? color.green : color.blue

ema = ta.ema(src, 1)
above = ta.crossover(ema, xATRTrailingStop)
below = ta.crossover(xATRTrailingStop, ema)

// Track entry prices
var float entryPrice = na

// Buy and sell conditions with RSI filter
buy = src > xATRTrailingStop and above and barstate.isconfirmed and rsiValue > 50
sell = src < xATRTrailingStop and below and barstate.isconfirmed and rsiValue < 50

// Calculate target prices for exit
var float buyTarget = na
var float sellTarget = na

if (buy)
    entryPrice := src
    buyTarget := entryPrice * (1 + percentage)
    sellTarget := entryPrice * (1 - percentage)
    strategy.entry("Buy", strategy.long)

if (sell)
    entryPrice := src
    buyTarget := entryPrice * (1 + percentage)
    sellTarget := entryPrice * (1 - percentage)
    strategy.entry("Sell", strategy.short)

// Exit conditions
var bool buyExit = false
var bool sellExit = false

if (strategy.position_size > 0 and barstate.isconfirmed)
    if (src >= buyTarget)
        strategy.exit("Take Profit", "Buy", limit=buyTarget)
        buyExit := true
    if (src <= sellTarget)
        strategy.exit("Take Profit", "Buy", limit=sellTarget)
        sellExit := true

if (strategy.position_size < 0 and barstate.isconfirmed)
    if (src <= sellTarget)
        strategy.exit("Take Profit", "Sell", limit=sellTarget)
        sellExit := true
    if (src >= buyTarget)
        strategy.exit("Take Profit", "Sell", limit=buyTarget)
        buyExit := true

// Plotting
plotshape(buy, title="Buy", text='Buy', style=shape.labelup, location=location.belowbar, color=color.green, textcolor=color.white, size=size.tiny)
plotshape(sell, title="Sell", text='Sell', style=shape.labeldown, location=location.abovebar, color=color.red, textcolor=color.white, size=size.tiny)

barcolor(src > xATRTrailingStop ? color.green : na)
barcolor(src < xATRTrailingStop ? color.red : na)

alertcondition(buy, "UT Long", "UT Long")
alertcondition(sell, "UT Short", "UT Short")
alertcondition(buyExit, "UT Long Exit", "UT Long Exit")
alertcondition(sellExit, "UT Short Exit", "UT Short Exit")
Detail
https://www.fmz.com/strategy/457811
Last Modified
2024-07-26 17:35:31