Name
Adaptive-Bollinger-Bands-Trend-Following-Strategy-with-Multi-Level-Risk-Management-自适应布林带趋势跟踪策略与多层风险管理系统
Author
ChaoZhang
Strategy Description
[trans]
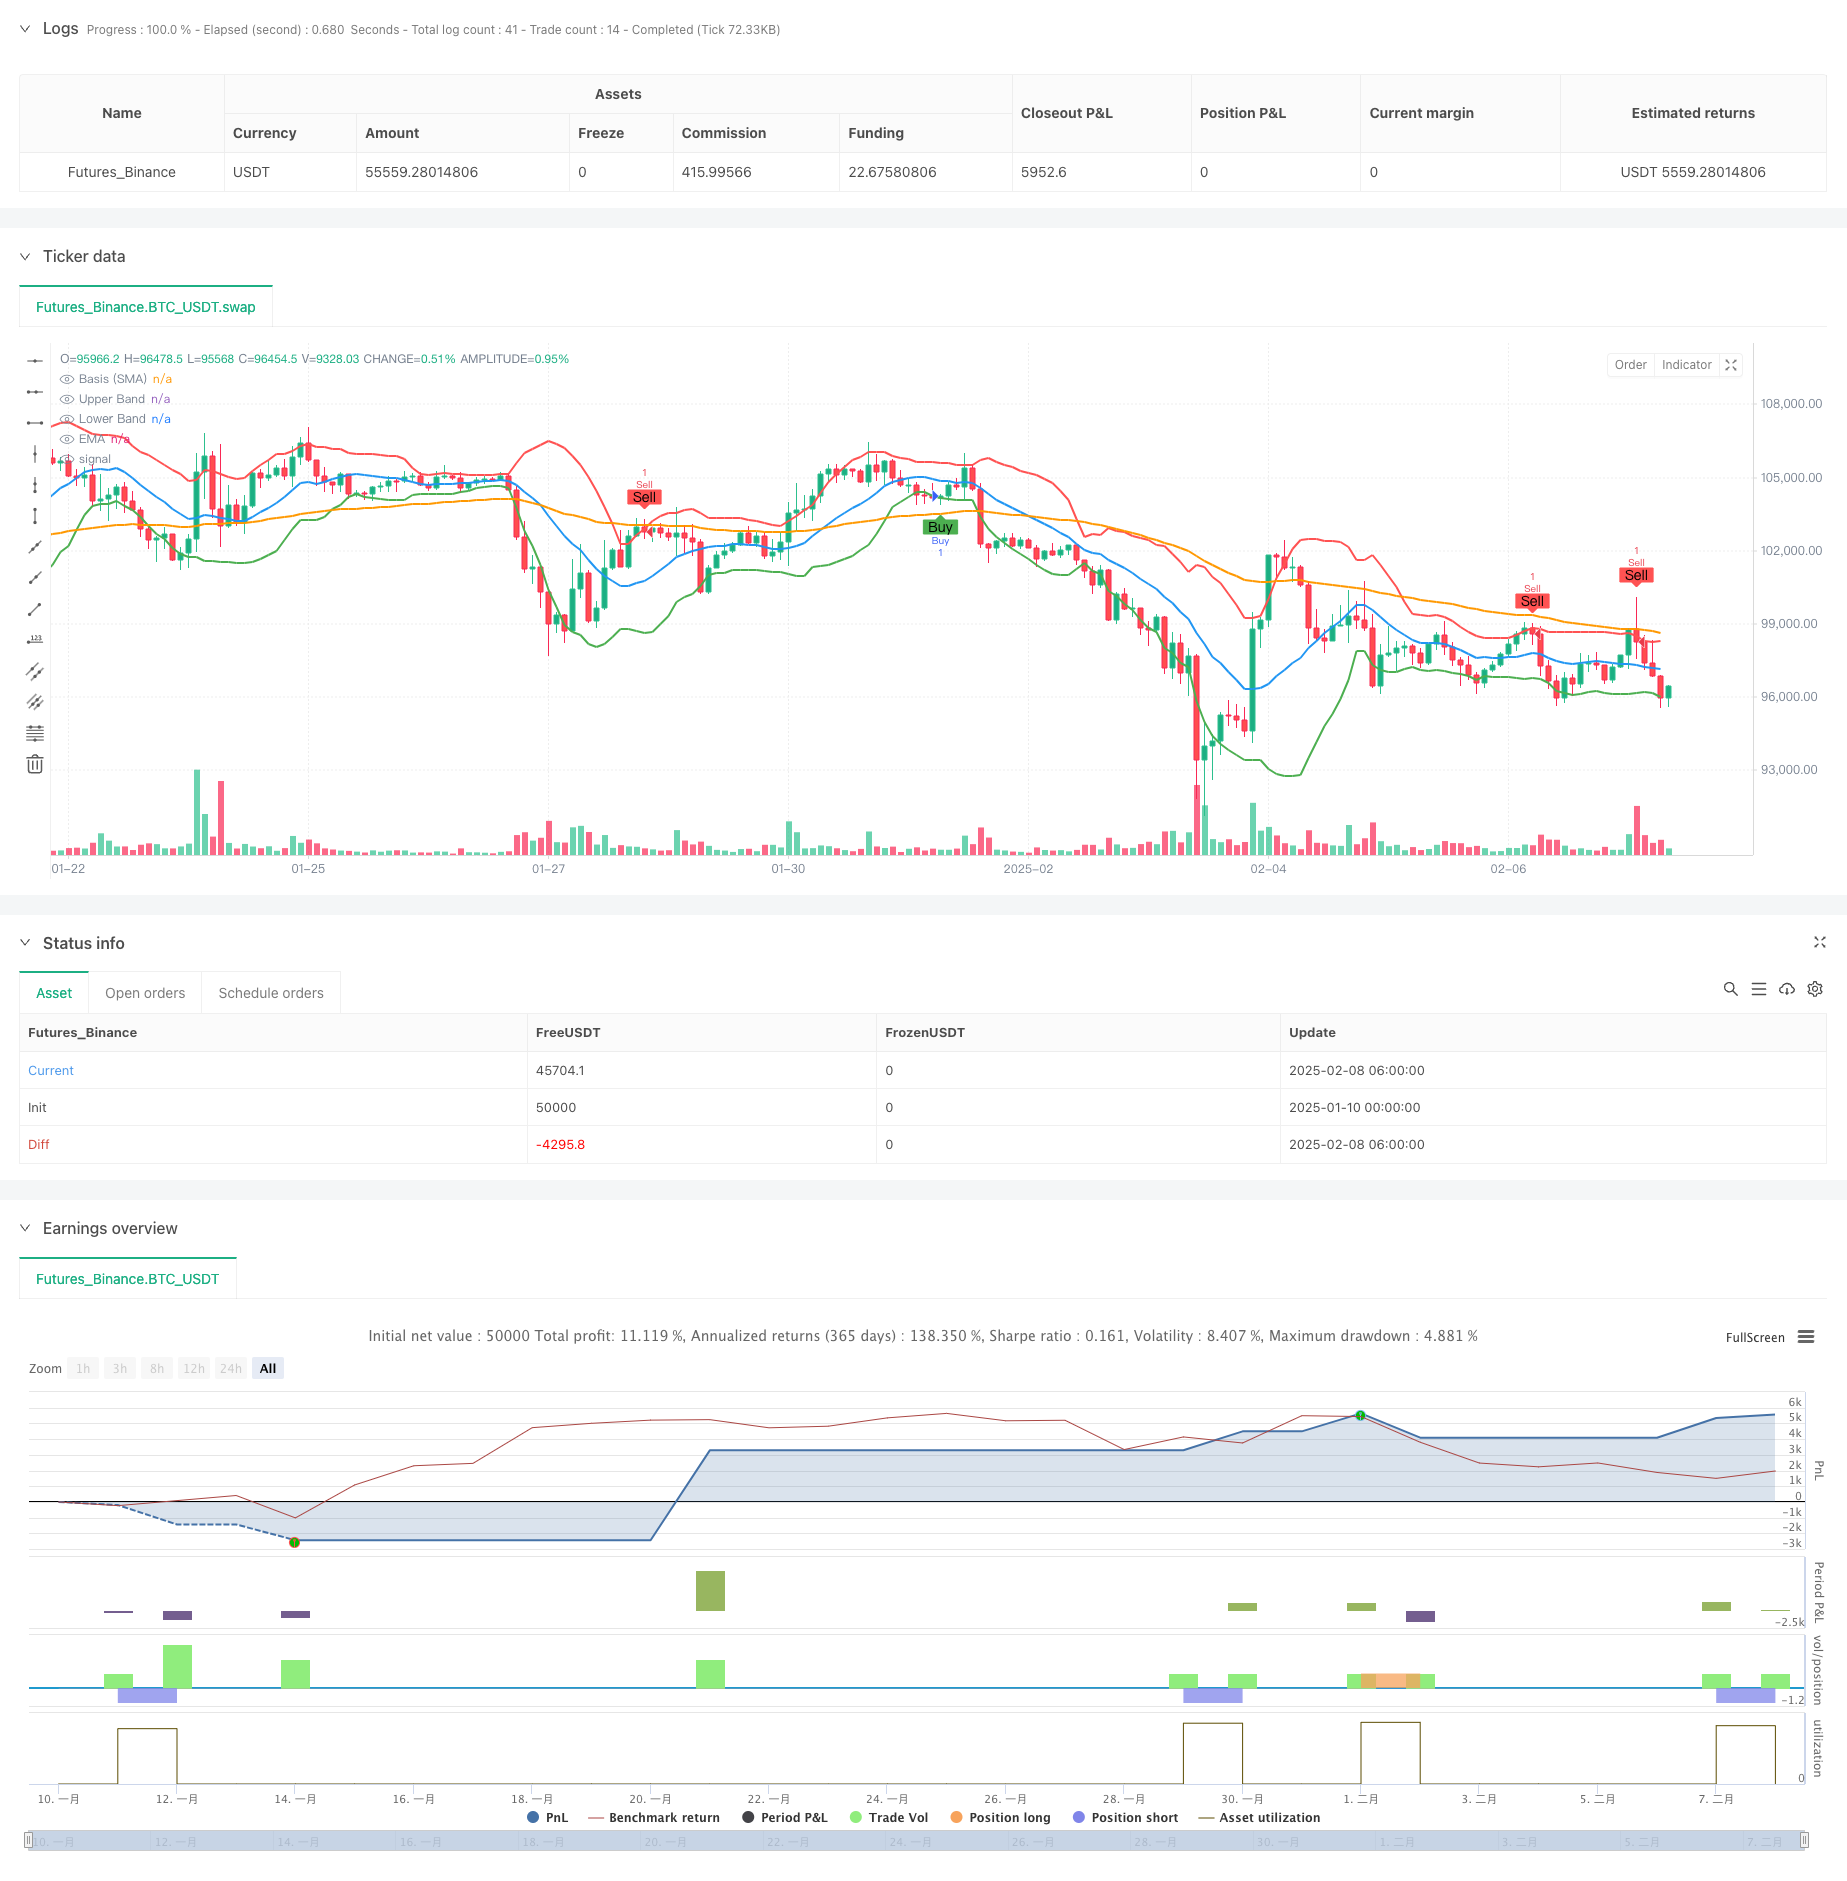
该策略是一个结合布林带和EMA指标的趋势跟踪系统,通过多层风险控制机制来优化交易表现。策略核心是利用布林带上下轨的突破回归形态来捕捉市场趋势,同时结合EMA趋势过滤器来提高交易的准确性。系统还包含了完整的风险管理体系,包括追踪止损、固定止损、获利目标以及基于时间的平仓机制。
策略的交易逻辑基于以下几个核心要素:
- 使用标准差(STDDEV)为1.5、周期为14的布林带作为主要的交易信号指标
- 当前一根K线收盘价突破上轨并且当前K线反转时,触发做空信号
- 当前一根K线收盘价突破下轨并且当前K线走强时,触发做多信号
- 可选择性地添加80周期EMA作为趋势过滤器,只在趋势方向一致时开仓
- 当价格穿越布林带中轨时激活追踪止损
- 可设置固定的止损和获利目标金额
- 支持基于K线数量的自动平仓机制
- 结合了趋势跟踪和反转交易的特点,能够在不同市场环境下表现稳定
- 多层次的风险控制系统提供了全面的资金管理方案
- 灵活的参数设置允许策略适应不同的市场条件
- EMA过滤器有效降低了假突破带来的风险
- 追踪止损机制能够有效地锁定利润
- 时间维度的平仓机制避免了长期套牢的风险
- 在震荡市场中可能产生频繁的假突破信号
- 固定金额的止损可能不适合所有市场条件
- EMA过滤可能导致错过一些重要的交易机会
- 追踪止损可能在高波动市场中过早平仓
- 参数优化可能导致过度拟合历史数据
- 引入自适应的布林带周期,根据市场波动率动态调整
- 开发基于资金管理的动态止损系统
- 增加交易量分析来确认突破的有效性
- 实现智能的参数优化系统
- 添加市场环境识别模块,在不同市场条件下使用不同的参数设置
这是一个设计完善的趋势跟踪系统,通过布林带和EMA的组合提供可靠的交易信号,并通过多层次的风险控制确保交易的安全性。策略的可配置性强,能够适应不同的交易风格和市场环境。虽然存在一些固有的风险,但通过建议的优化方向可以进一步提升策略的稳定性和盈利能力。 ||
This strategy is a trend-following system that combines Bollinger Bands and EMA indicators with a multi-layer risk control mechanism to optimize trading performance. The core strategy utilizes Bollinger Bands breakout-reversion patterns to capture market trends while incorporating an EMA trend filter to enhance trading accuracy. The system includes a comprehensive risk management framework with trailing stops, fixed stop losses, profit targets, and time-based position closure.
The trading logic is based on the following core elements:
- Uses Bollinger Bands with 1.5 standard deviation and 14-period length as the primary trading signal indicator
- Triggers short signals when the previous candle closes above the upper band and current candle reverses
- Triggers long signals when the previous candle closes below the lower band and current candle turns bullish
- Optionally applies an 80-period EMA as a trend filter, only entering positions when trend direction aligns
- Activates trailing stops when price crosses the Bollinger Bands middle line
- Allows setting fixed stop loss and take profit amounts
- Supports automatic position closure based on bar count
- Combines trend-following and reversal trading characteristics for stable performance across different market conditions
- Multi-layered risk control system provides comprehensive money management
- Flexible parameter settings allow strategy adaptation to different market conditions
- EMA filter effectively reduces false breakout risks
- Trailing stop mechanism effectively locks in profits
- Time-dimensional closure mechanism prevents long-term position trapping
- May generate frequent false breakout signals in ranging markets
- Fixed monetary stop losses may not suit all market conditions
- EMA filtering might cause missing important trading opportunities
- Trailing stops may close positions prematurely in highly volatile markets
- Parameter optimization may lead to overfitting historical data
- Introduce adaptive Bollinger Bands periods based on market volatility
- Develop dynamic stop-loss system based on money management
- Add volume analysis to confirm breakout validity
- Implement intelligent parameter optimization system
- Add market environment recognition module for different parameter settings in different market conditions
This is a well-designed trend-following system that provides reliable trading signals through the combination of Bollinger Bands and EMA, while ensuring trading safety through multi-layered risk control. The strategy offers strong configurability to adapt to different trading styles and market environments. While there are some inherent risks, the suggested optimization directions can further enhance the strategy's stability and profitability.[/trans]
Source (PineScript)
/*backtest
start: 2025-01-10 00:00:00
end: 2025-02-08 08:00:00
period: 2h
basePeriod: 2h
exchanges: [{"eid":"Futures_Binance","currency":"BTC_USDT"}]
*/

//@version=5
strategy("AI Bollinger Bands Strategy with SL, TP, and Bars Till Close", overlay=true)

// Input parameters
bb_length           = input.int(14, title="Bollinger Bands Length", minval=1)
bb_stddev           = input.float(1.5, title="Bollinger Bands Standard Deviation", minval=0.1)
use_ema             = input.bool(true, title="Use EMA Filter")
ema_length          = input.int(80, title="EMA Length", minval=1)
use_trailing_stop   = input.bool(true, title="Use Trailing Stop")
use_sl              = input.bool(true, title="Use Stop Loss")
use_tp              = input.bool(false, title="Use Take Profit")
sl_dollars          = input.float(300.0, title="Stop Loss (\$)", minval=0.0)
tp_dollars          = input.float(1000.0, title="Take Profit (\$)", minval=0.0)
use_bars_till_close = input.bool(true, title="Use Bars Till Close")
bars_till_close     = input.int(10, title="Bars Till Close", minval=1)
// New input to toggle indicator plotting
plot_indicators     = input.bool(true, title="Plot Bollinger Bands and EMA on Chart")

// Calculate Bollinger Bands and EMA
basis      = ta.sma(close, bb_length)
upper_band = basis + bb_stddev * ta.stdev(close, bb_length)
lower_band = basis - bb_stddev * ta.stdev(close, bb_length)
ema        = ta.ema(close, ema_length)

// Plot Bollinger Bands and EMA conditionally
plot(plot_indicators  ? basis : na, color=color.blue, linewidth=2, title="Basis (SMA)")
plot(plot_indicators ? upper_band : na, color=color.red, linewidth=2, title="Upper Band")
plot(plot_indicators  ? lower_band : na, color=color.green, linewidth=2, title="Lower Band")
plot(plot_indicators   ? ema   : na, color=color.orange, linewidth=2, title="EMA")

// EMA conditions
ema_long_condition  = ema > ema[1]
ema_short_condition = ema < ema[1]

// Entry conditions
sell_condition = close[1] > upper_band[1] and close[1] > open[1] and close < open
if sell_condition and (not use_ema or ema_short_condition)
    strategy.entry("Sell", strategy.short)

buy_condition = close[1] < lower_band[1] and close > open
if buy_condition and (not use_ema or ema_long_condition)
    strategy.entry("Buy", strategy.long)

// Trailing stop logic
if use_trailing_stop
    if strategy.position_size > 0 and close >= basis
        strategy.exit("Trailing Stop Long", from_entry="Buy", stop=low)
    if strategy.position_size < 0 and close <= basis
        strategy.exit("Trailing Stop Short", from_entry="Sell", stop=high)

// Stop Loss and Take Profit logic
if use_sl or use_tp
    if strategy.position_size > 0
        long_entry = strategy.position_avg_price
        long_sl    = long_entry - sl_dollars
        long_tp    = long_entry + tp_dollars
        if use_sl and close <= long_sl
            strategy.close("Buy", comment="Long SL Hit")
        if use_tp and close >= long_tp
            strategy.close("Buy", comment="Long TP Hit")
    if strategy.position_size < 0
        short_entry = strategy.position_avg_price
        short_sl    = short_entry + sl_dollars
        short_tp    = short_entry - tp_dollars
        if use_sl and close >= short_sl
            strategy.close("Sell", comment="Short SL Hit")
        if use_tp and close <= short_tp
            strategy.close("Sell", comment="Short TP Hit")

// Bars Till Close logic
var int bars_since_entry = na
if strategy.position_size != 0
    bars_since_entry := na(bars_since_entry) ? 0 : bars_since_entry + 1
else
    bars_since_entry := na

if use_bars_till_close and not na(bars_since_entry) and bars_since_entry >= bars_till_close
    strategy.close("Buy", comment="Bars Till Close Hit")
    strategy.close("Sell", comment="Bars Till Close Hit")

// Plot buy/sell signals
plotshape(sell_condition and (not use_ema or ema_short_condition), title="Sell Signal", location=location.abovebar, color=color.red, style=shape.labeldown, text="Sell")
plotshape(buy_condition and (not use_ema or ema_long_condition), title="Buy Signal", location=location.belowbar, color=color.green, style=shape.labelup, text="Buy")
Detail
https://www.fmz.com/strategy/481370
Last Modified
2025-02-10 15:14:57