Name
Adaptive-FVG-Detection-and-MA-Trend-Trading-Strategy-with-Dynamic-Resistance-基于时适-FVG-检测与移动平均趋势的动态阻力交易策略
Author
ChaoZhang
Strategy Description
[trans]
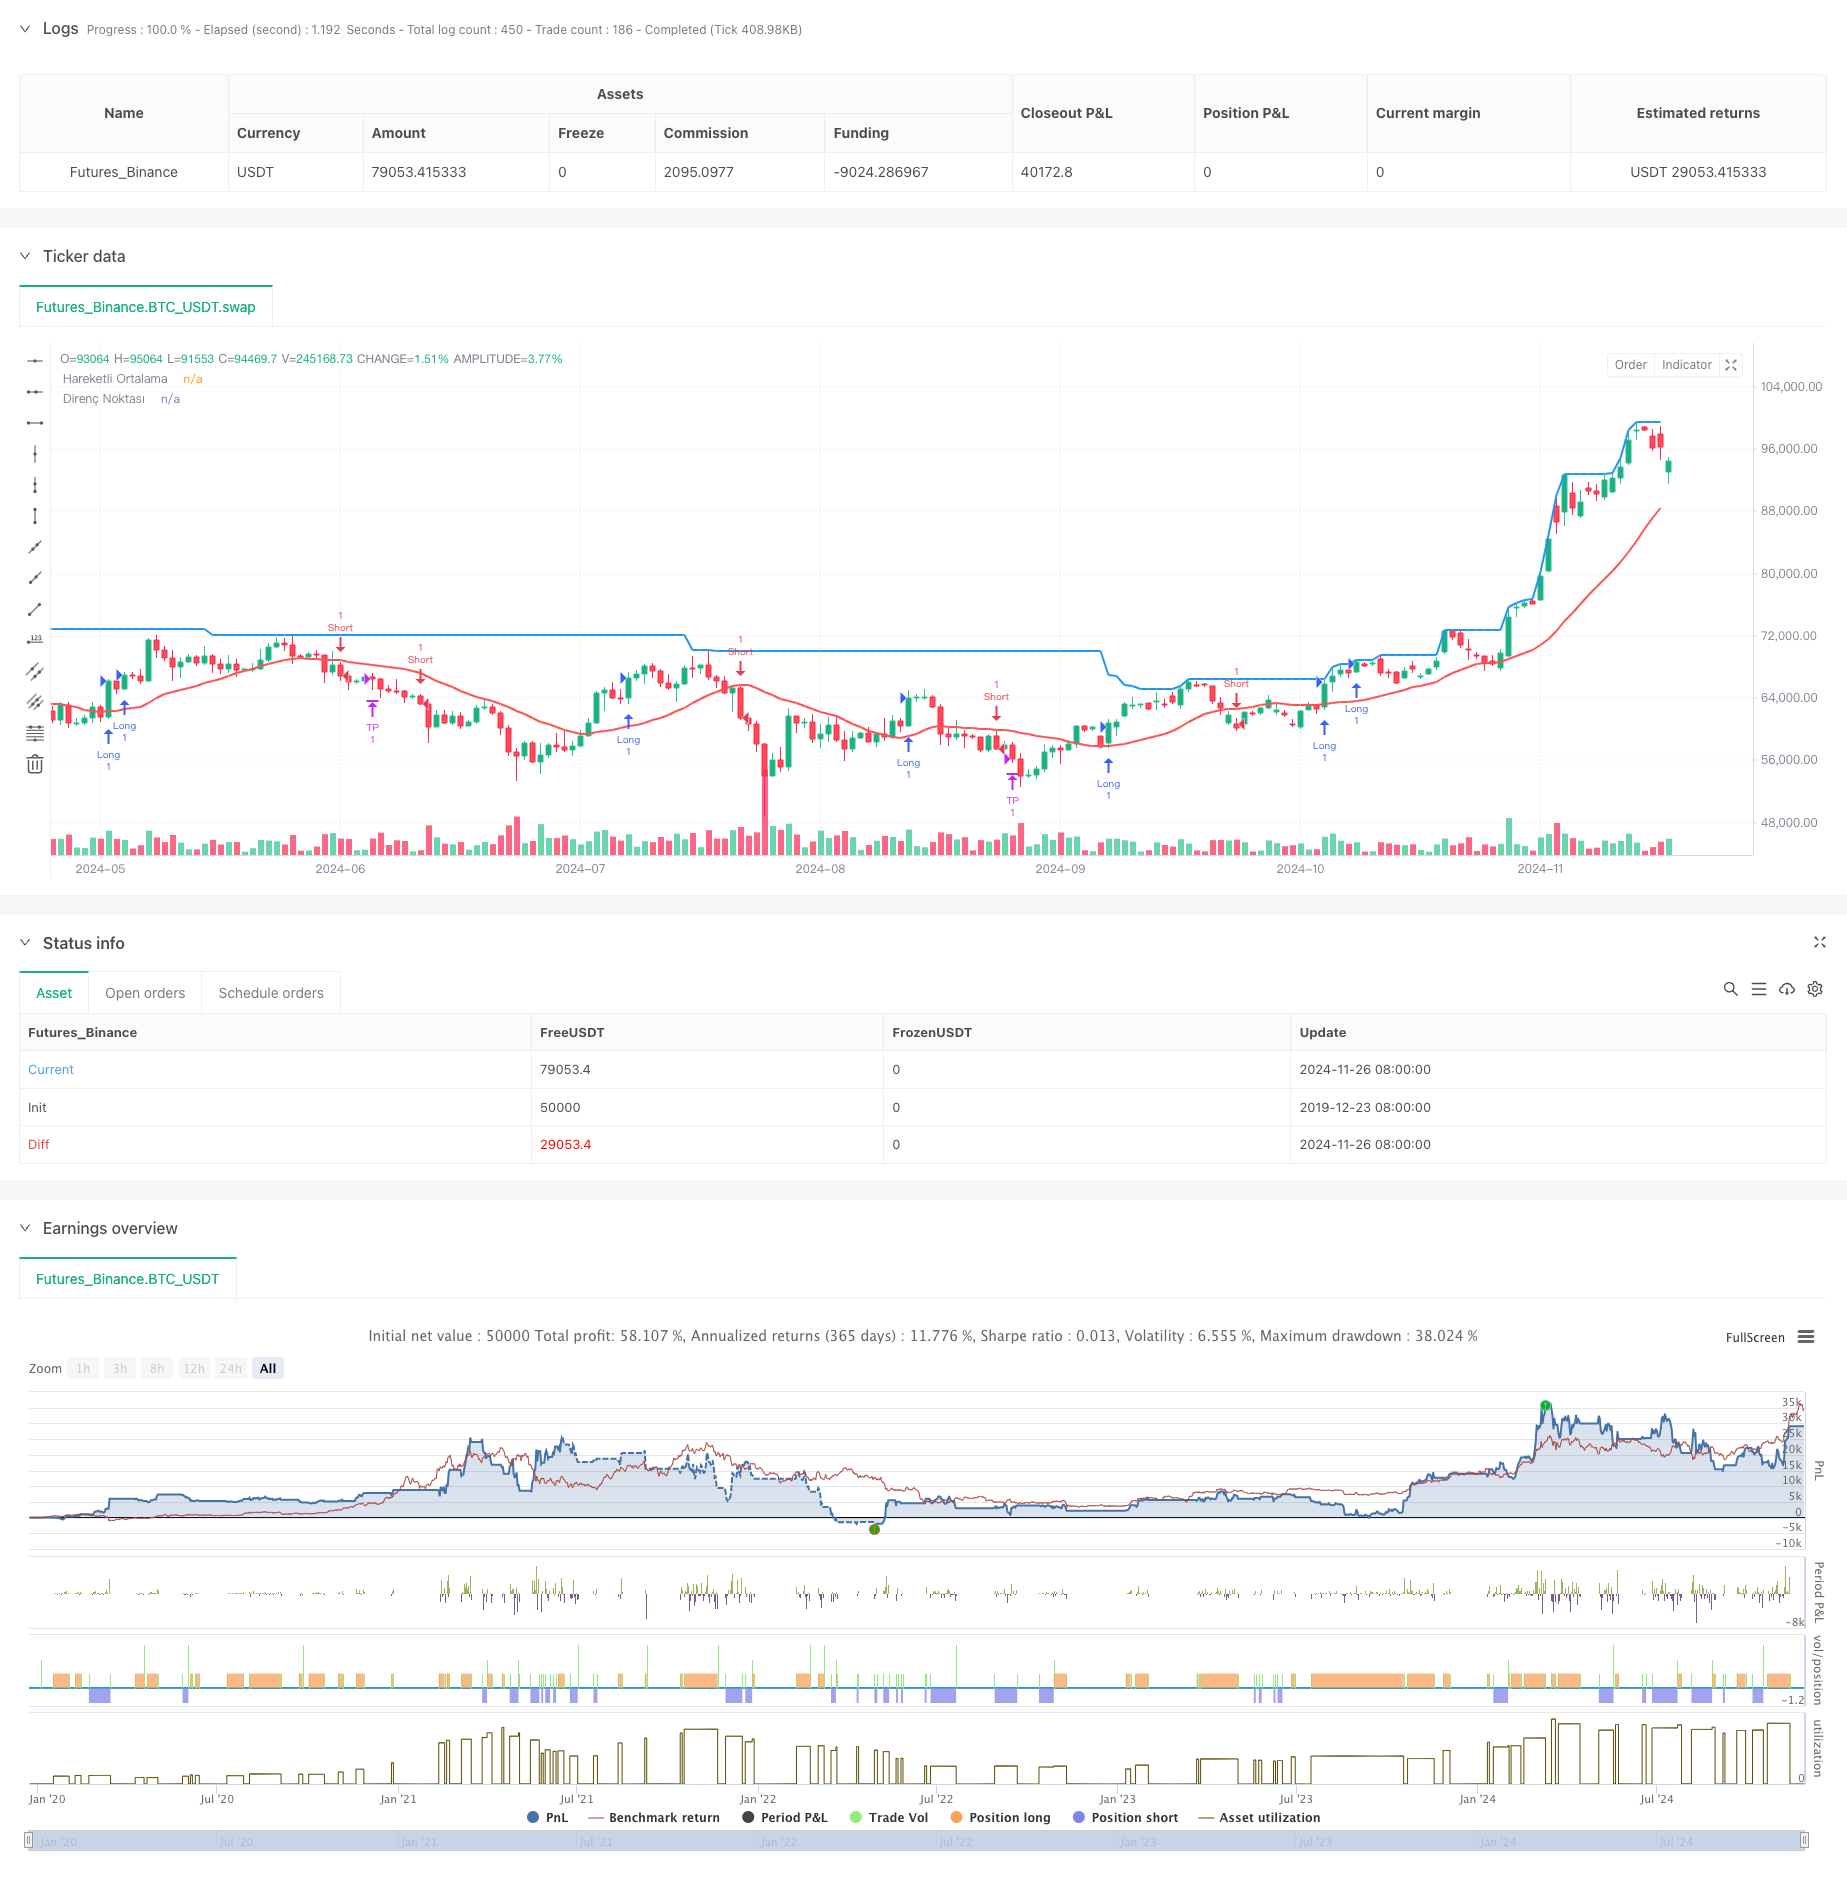
该策略是一个结合了公平价值缺口(FVG)检测、移动平均线趋势判断和动态阻力位的综合交易系统。策略通过在不同时间框架下识别FVG形成,并结合移动平均线趋势方向,在出现反转信号时进行交易。系统还包含了动态止损和基于历史高点的获利目标设置。
策略的核心逻辑包含以下几个关键部分:
- FVG检测:在指定时间框架(默认1小时)内检测多头和空头的公平价值缺口
- 趋势判断:使用20周期移动平均线判断市场趋势方向
- 反转确认:通过蜡烛图形态判断市场反转信号
- 动态阻力:使用近期最高点作为阻力位和获利目标
- 风险管理:采用百分比止损保护策略
- 多维度分析:结合了价格形态、趋势和市场结构
- 自适应性强:能够在不同市场环境下调整参数
- 风险可控:具有明确的止损和获利设置
- 视觉化支持:提供FVG区域和关键价位的图形展示
- 逻辑完整:包含入场、出场和风险管理的完整交易系统
- 时间框架依赖:不同时间框架可能产生冲突信号
- 市场波动:剧烈波动可能导致止损过于频繁
- 参数敏感:参数设置对策略表现影响较大
- 趋势依赖:在震荡市场中可能表现欠佳
- 信号滞后:移动平均线具有一定滞后性
- 引入波动率自适应:根据市场波动调整止损和获利目标
- 增加过滤条件:添加成交量或其他技术指标确认
- 优化时间框架:测试不同时间框架组合的效果
- 改进趋势判断:使用多重移动平均线或其他趋势指标
- 完善反转确认:加入更多形态识别方法
这是一个融合了多个交易理念的综合性策略,通过FVG、趋势和价格形态的配合来寻找高概率交易机会。策略的优势在于系统性强,风险可控,但需要注意参数优化和市场环境的适应性。通过建议的优化方向,策略还有进一步提升的空间。 ||
This strategy is a comprehensive trading system that combines Fair Value Gap (FVG) detection, moving average trend determination, and dynamic resistance levels. The strategy identifies FVG formation across different timeframes, integrates moving average trend direction, and executes trades upon reversal signals. The system also includes dynamic stop-loss and profit targets based on historical highs.
The core logic includes the following key components:
- FVG Detection: Identifies bullish and bearish fair value gaps within specified timeframes (default 1 hour)
- Trend Determination: Uses 20-period moving average to assess market trend direction
- Reversal Confirmation: Evaluates market reversal signals through candlestick patterns
- Dynamic Resistance: Utilizes recent highs as resistance levels and profit targets
- Risk Management: Implements percentage-based stop-loss protection
- Multi-dimensional Analysis: Combines price patterns, trends, and market structure
- High Adaptability: Can adjust parameters in different market environments
- Controlled Risk: Features clear stop-loss and profit targets
- Visual Support: Provides graphical display of FVG zones and key price levels
- Complete Logic: Includes a comprehensive system for entry, exit, and risk management
- Timeframe Dependency: Different timeframes may generate conflicting signals
- Market Volatility: Severe fluctuations may trigger frequent stop-losses
- Parameter Sensitivity: Strategy performance heavily depends on parameter settings
- Trend Dependency: May underperform in ranging markets
- Signal Lag: Moving averages have inherent lag
- Introduce Volatility Adaptation: Adjust stop-loss and profit targets based on market volatility
- Add Filtering Conditions: Include volume or other technical indicators for confirmation
- Optimize Timeframes: Test different timeframe combinations for effectiveness
- Improve Trend Determination: Use multiple moving averages or other trend indicators
- Enhance Reversal Confirmation: Incorporate additional pattern recognition methods
This is a comprehensive strategy that integrates multiple trading concepts, seeking high-probability trading opportunities through the combination of FVG, trends, and price patterns. The strategy's strengths lie in its systematic approach and risk control, but attention must be paid to parameter optimization and market environment adaptability. Through the suggested optimization directions, there is room for further strategy improvement. [/trans]
Source (PineScript)
/*backtest
start: 2019-12-23 08:00:00
end: 2024-11-27 08:00:00
period: 1d
basePeriod: 1d
exchanges: [{"eid":"Futures_Binance","currency":"BTC_USDT"}]
*/

//@version=5
strategy("SMC FVG Entry Strategy with Retest", overlay=true)

// Parametreler
stopLossPercent = input(2, title="Stop Loss (%)") / 100
lookbackPeriod = input(50, title="Güçlü Direnç İçin Geriye Dönük Süre")
fvgLength = input.timeframe("60", title="FVG Zaman Dilimi")  // 1 saatlik zaman dilimi
maPeriod = input(20, title="MA Dönemi")  // Trend yönü için MA dönemi

// FVG'leri Hesapla
var float fvgLow = na
var float fvgHigh = na
var bool fvgFilled = false

// Seçilen zaman diliminde FVG'leri kontrol et
if (ta.change(time(fvgLength)))
    bull_fvg = low > high[2] and close[1] > high[2]
    bear_fvg = high < low[2] and close[1] < low[2]

    if (bull_fvg)
        fvgLow := low[2]
        fvgHigh := high
        fvgFilled := true
    else if (bear_fvg)
        fvgLow := low
        fvgHigh := high[2]
        fvgFilled := true

// Trend Yönü Kontrolü (MA kullanarak)
ma = ta.sma(close, maPeriod)
trendUp = close > ma
trendDown = close < ma

// Dönüş Mumu Kontrolü
bullishReversal = close > open and close[1] < open[1] and fvgFilled and close > fvgHigh
bearishReversal = close < open and close[1] > open[1] and fvgFilled and close < fvgLow

// İlk güçlü direnç noktası
resistanceLevel = ta.highest(high, lookbackPeriod)

// Giriş Koşulları
if (bullishReversal and trendUp)
    entryPrice = close
    stopLoss = entryPrice * (1 - stopLossPercent)
    takeProfit = resistanceLevel
    strategy.entry("Long", strategy.long)
    strategy.exit("TP", "Long", limit=takeProfit, stop=stopLoss)

if (bearishReversal and trendDown)
    entryPrice = close
    stopLoss = entryPrice * (1 + stopLossPercent)
    takeProfit = resistanceLevel
    strategy.entry("Short", strategy.short)
    strategy.exit("TP", "Short", limit=takeProfit, stop=stopLoss)

// FVG'leri Grafik Üzerinde Göster
// if (fvgFilled)
//     var box fvgBox = na
//     if (na(fvgBox))
//         fvgBox := box.new(left=bar_index[1], top=fvgHigh, bottom=fvgLow, right=bar_index, bgcolor=color.new(color.green, 90), border_color=color.green)
//     else
//         box.set_top(fvgBox, fvgHigh)
//         box.set_bottom(fvgBox, fvgLow)
//         box.set_left(fvgBox, bar_index[1])
//         box.set_right(fvgBox, bar_index)

// Direnç Noktasını Göster
plot(resistanceLevel, color=color.blue, title="Direnç Noktası", linewidth=2)
plot(ma, color=color.red, title="Hareketli Ortalama", linewidth=2)
Detail
https://www.fmz.com/strategy/473346
Last Modified
2024-11-29 14:50:09