Name
Adaptive-Trend-Detection-Strategy-with-Dual-Envelope-EMA-System-基于双包络EMA系统的自适应趋势检测策略
Author
ChaoZhang
Strategy Description
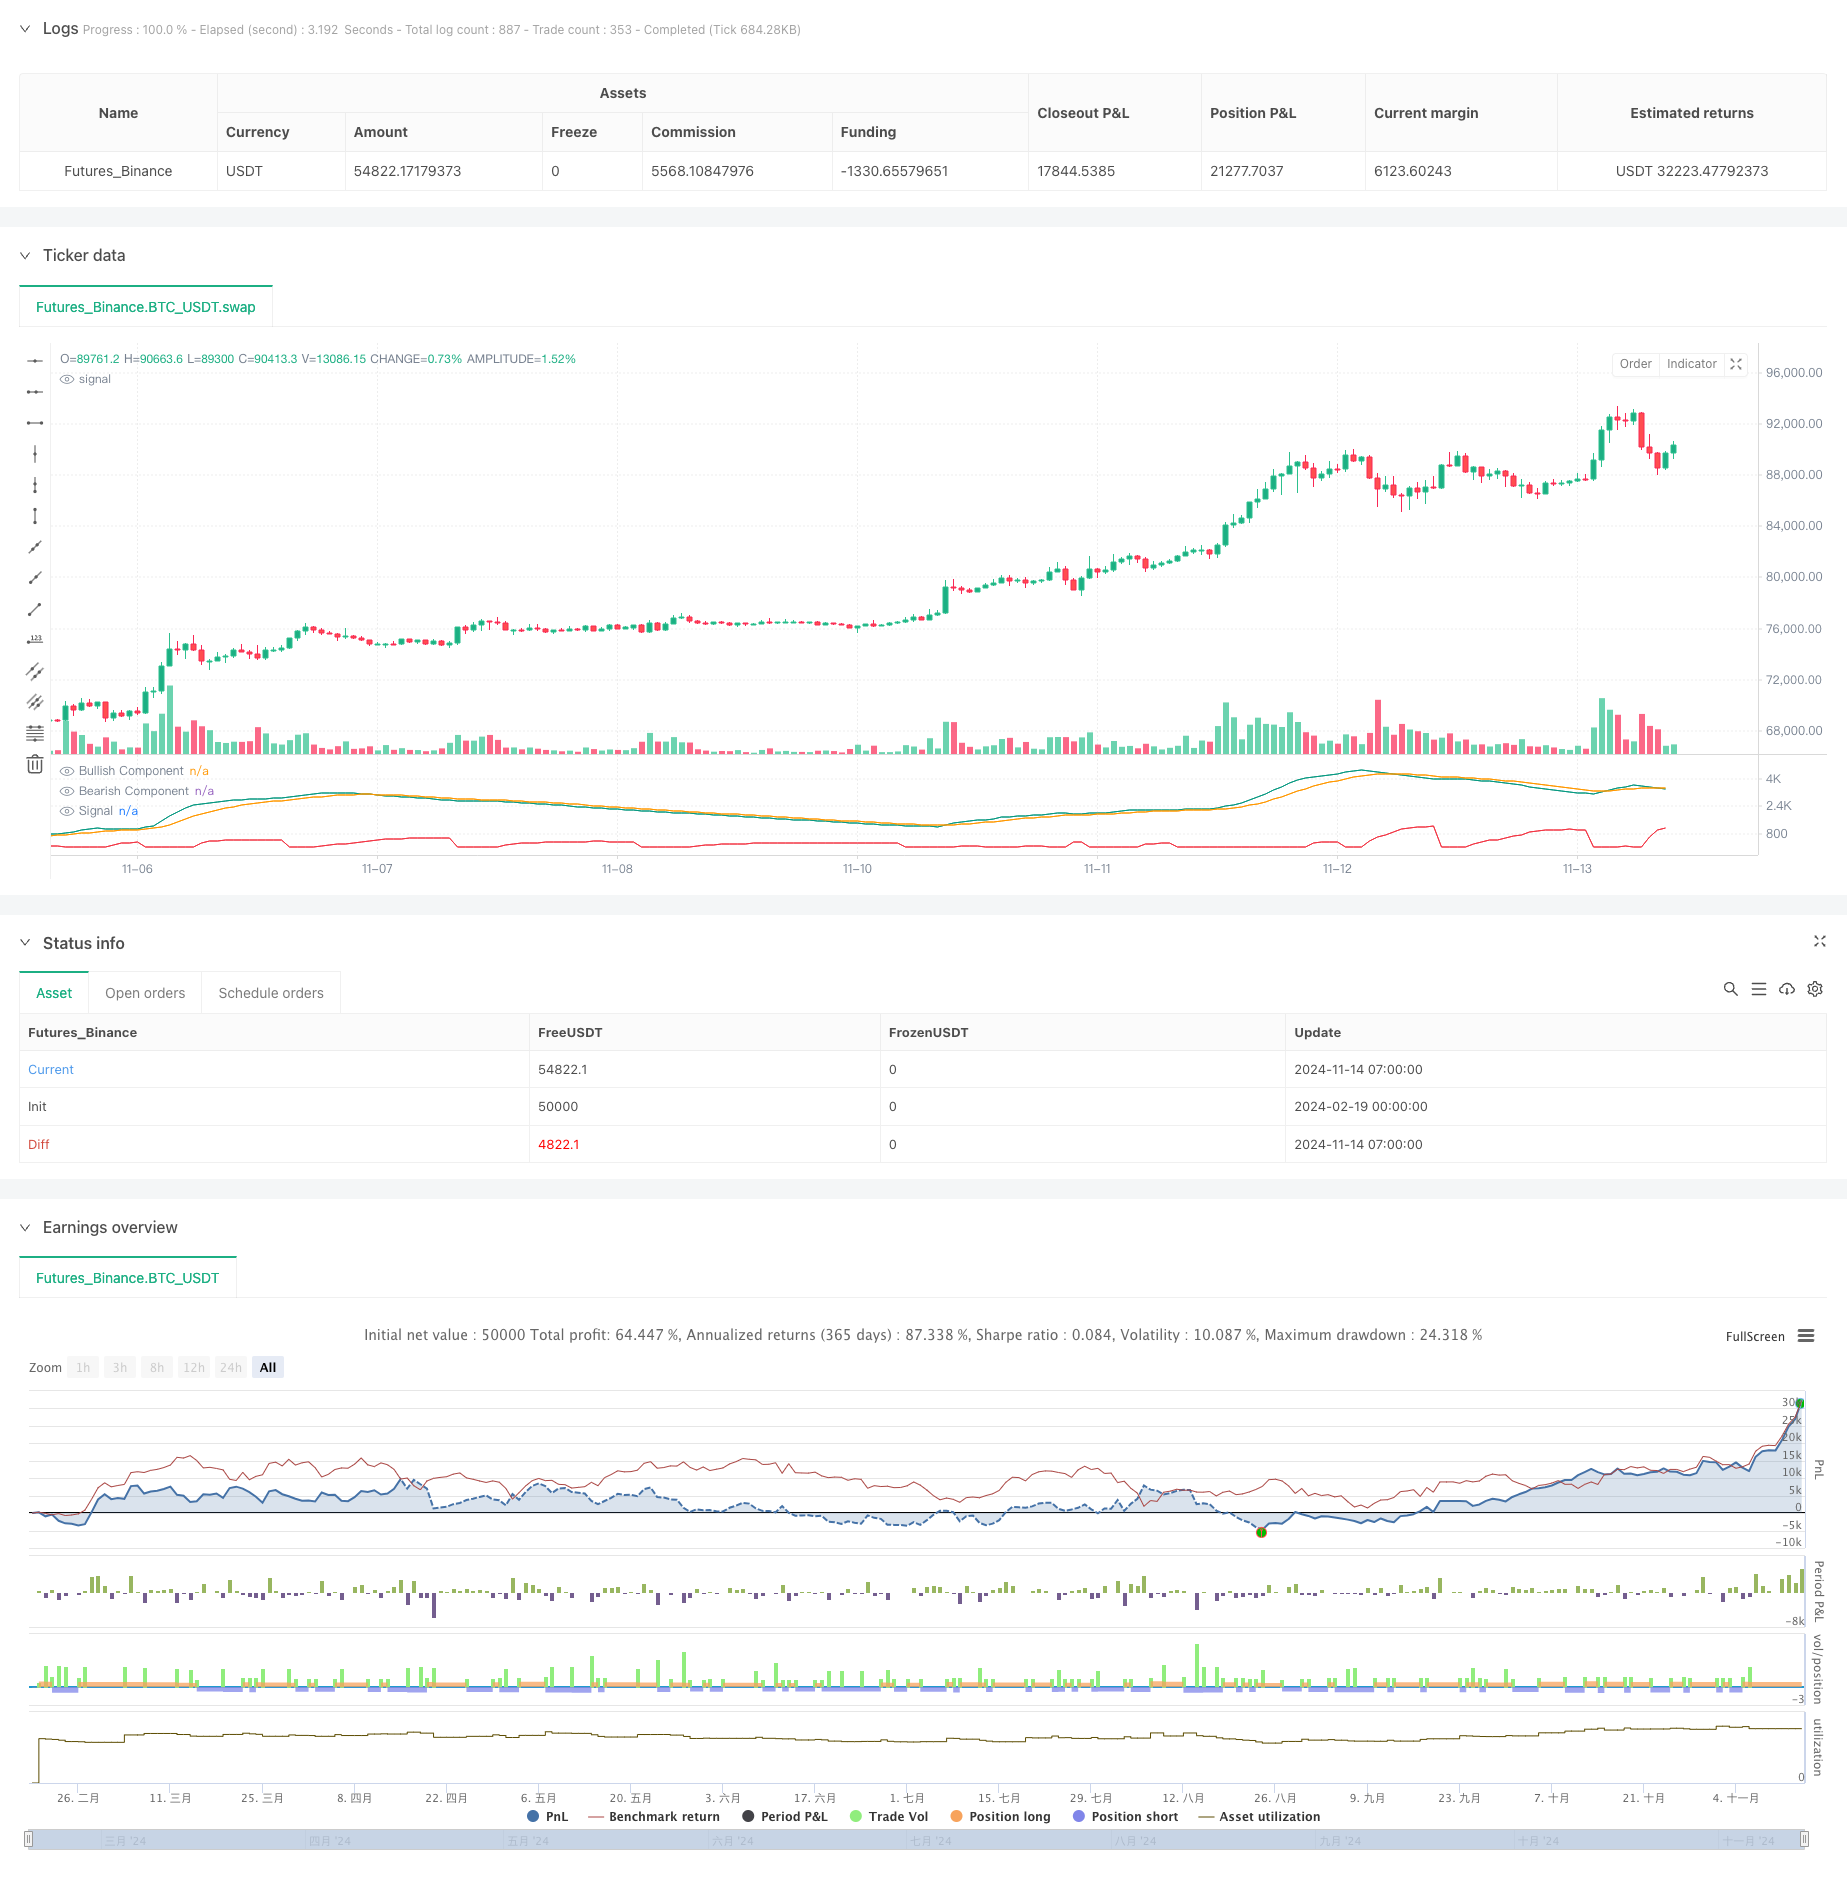
[trans]
该策略是一种创新的趋势检测系统,基于双重指数移动平均线(EMA)包络的计算方法。它通过分析价格走势的多维特征,实时计算多空力量对比,从而识别市场趋势的变化和持续性。该策略最大的特点在于其自适应性,能够根据市场状况动态调整信号强度。
策略的核心原理是通过复杂的EMA包络计算来衡量市场的多空力量。具体来说:
- 利用开盘价和收盘价构建上下两个EMA包络系统
- 通过数学计算得出多头力量(bull)和空头力量(bear)指标
- 计算信号线作为趋势确认的辅助指标
- 当多头力量超过空头力量时产生做多信号,反之产生做空信号
- 自适应性强 - 策略能够根据市场波动自动调整敏感度
- 信号稳定 - 通过多重指标确认,减少虚假信号
- 风险控制完善 - 内置资金管理系统,限制每次交易的资金使用比例
- 可视化效果好 - 独立显示面板清晰展示各项指标
- 参数灵活 - 可根据不同市场特征调整周期参数
- 趋势反转风险 - 在剧烈波动市场中可能出现信号滞后
- 资金管理风险 - 需要合理设置初始资金和交易比例
- 市场适应性风险 - 在不同市场环境下需要调整参数
- 技术实现风险 - 需要保证计算过程的稳定性和准确性
- 增加市场波动率过滤器,在高波动期间调整信号敏感度
- 引入成交量指标作为辅助确认系统
- 优化资金管理系统,加入动态仓位控制
- 增加趋势强度过滤器,提高信号质量
- 开发自适应参数优化系统
这是一个基于科学计算方法的趋势跟踪策略,通过先进的技术指标设计和严格的风险控制,实现了对市场趋势的有效捕捉。策略的核心优势在于其自适应性和可靠性,通过合理的参数优化和风险管理,能够在不同市场环境下保持稳定的表现。 ||
This strategy is an innovative trend detection system based on dual Exponential Moving Average (EMA) envelope calculations. It analyzes multidimensional price characteristics to calculate real-time bull-bear power comparisons, identifying market trend changes and persistence. The strategy's main feature is its adaptability, allowing dynamic adjustment of signal strength based on market conditions.
The core principle relies on complex EMA envelope calculations to measure market forces. Specifically:
- Constructs upper and lower EMA envelopes using open and close prices
- Derives bullish and bearish power indicators through mathematical calculations
- Computes a signal line as a supplementary trend confirmation indicator
- Generates long signals when bullish power exceeds bearish power, and vice versa
- Strong Adaptability - Automatically adjusts sensitivity based on market volatility
- Stable Signals - Multiple indicator confirmation reduces false signals
- Comprehensive Risk Control - Built-in money management system limits position sizes
- Excellent Visualization - Separate panel clearly displays all indicators
- Flexible Parameters - Adjustable cycle parameters for different market characteristics
- Trend Reversal Risk - Potential signal lag in highly volatile markets
- Money Management Risk - Requires proper initial capital and trading ratio settings
- Market Adaptability Risk - Parameters need adjustment in different market environments
- Technical Implementation Risk - Requires stable and accurate calculation processes
- Add volatility filters to adjust signal sensitivity during high volatility periods
- Incorporate volume indicators as confirmation systems
- Optimize money management with dynamic position sizing
- Add trend strength filters to improve signal quality
- Develop adaptive parameter optimization systems
This is a scientifically-based trend following strategy that effectively captures market trends through advanced technical indicator design and strict risk control. The strategy's core strengths lie in its adaptability and reliability, maintaining stable performance across different market environments through proper parameter optimization and risk management.[/trans]
Source (PineScript)
/*backtest
start: 2024-02-19 00:00:00
end: 2024-11-14 08:00:00
period: 1h
basePeriod: 1h
exchanges: [{"eid":"Futures_Binance","currency":"BTC_USDT"}]
*/

//  This work is licensed under a Attribution-NonCommercial-ShareAlike 4.0 International (CC BY-NC-SA 4.0)
//  https://creativecommons.org/licenses/by-nc-sa/4.0/
//  © alexgrover
//
//  Original post:
//  https://alpaca.markets/learn/andean-oscillator-a-new-technical-indicator-based-on-an-online-algorithm-for-trend-analysis/

//@version=5
strategy(title="Andean Oscillator [Strategy]",
     shorttitle="AndeanOsc_Strategy",
     overlay=false,              // Zobraziť sa môže v samostatnom okne
     initial_capital=10000,      // Počiatočný kapitál
     default_qty_type=strategy.percent_of_equity,
     default_qty_value=100,      // Použiť 100% z účtu na jeden obchod
     pyramiding=0)               // Nenavyšovať pozície

//------------------------------------------------------------------------------
//Inputs
//------------------------------------------------------------------------------
length     = input.int(50, "Length")
sig_length = input.int(9, "Signal Length")

//------------------------------------------------------------------------------
//Výpočet Andean Oscillatora
//------------------------------------------------------------------------------
var float alpha = 2.0 / (length + 1)

// Premenné musia byť deklarované ako `var` pre zachovanie stavu
var float up1 = 0.
var float up2 = 0.
var float dn1 = 0.
var float dn2 = 0.

C = close
O = open

// Výpočet EMA obálok
up1 := nz(math.max(C, O, up1[1] - (up1[1] - C) * alpha), C)
up2 := nz(math.max(C * C, O * O, up2[1] - (up2[1] - C * C) * alpha), C * C)

dn1 := nz(math.min(C, O, dn1[1] + (C - dn1[1]) * alpha), C)
dn2 := nz(math.min(C * C, O * O, dn2[1] + (C * C - dn2[1]) * alpha), C * C)

// Býčia zložka a medvedia zložka
bull   = math.sqrt(dn2 - dn1 * dn1)
bear   = math.sqrt(up2 - up1 * up1)

// Signál = EMA z max(bull, bear)
signal = ta.ema(math.max(bull, bear), sig_length)

//------------------------------------------------------------------------------
//Jednoduchá LOGIKA STRATÉGIE (iba demonštrácia)
//------------------------------------------------------------------------------
// Príklad:
// - Ak je bull > bear, vstúpime do long (býčia sila väčšia ako medvedia)
// - Ak je bear > bull, vstúpime do short (medvedia sila väčšia ako býčia)
//
// S pyramiding=0 sa otvorí vždy iba jedna pozícia – ak príde opačný signál,
// TradingView zatvorí starú a otvorí novú.

if bull > bear
    strategy.entry("Long", strategy.long, comment="Bull > Bear")

if bear > bull
    strategy.entry("Short", strategy.short, comment="Bear > Bull")

//------------------------------------------------------------------------------
// Plotovanie (na posúdenie v samostatnom paneli)
//------------------------------------------------------------------------------
plot(bull,   "Bullish Component",  color=#089981)
plot(bear,   "Bearish Component",  color=#f23645)
plot(signal, "Signal",             color=#ff9800)
Detail
https://www.fmz.com/strategy/482454
Last Modified
2025-02-18 15:06:49